MetaTrader 5용 새 Expert Advisor 및 지표 - 32

This Automatic support/resistance indicator calculates various peaks and troughs of the price action, identifies relevant levels and draws support and resistance automatically. It uses the built-in "ZigZag" indicator in Metatrader as a data source hence, very much accurate indicator. The support and resistance lines are contineusely updated as new levels and formed. The indicator has only 5 parameters to set, and mostly it can be used with the default values: The description of the settings is

Important Note: Trend Starter Indicator (TSI) detailed settings manual, trading strategies (coming soon) and setfiles (coming soon) are available in this LINK The Trend Starter Indicator (TSI) provides traders with precise and actionable signals for potential market entry points. By capitalizing on the unique interplay of two internal oscillators combined with astute price action monitoring, TSI optimizes and simplifies the decision-making process in the dynamic world of trading. But that'
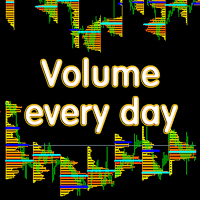
Основные отличия и преимущества индикатора Volume every day от похожего продукта Volume Profile V6 В Volume every day можно параметром Range period задать временной диапазон построения профиля, а параметром Range count задать количество профилей данных диапазонов. Например, на втором скрине Range period=1Day, а Range count=10 - это значит, что профиль будет строиться на периоде один день, десять последних дней. Важно, что переключение тайм фрейма графика не влияет на построение профиля, что т

The VIX Fix is a volatility indicator developed by renowned trader Larry Williams. It's designed to measure volatility in assets that don't have options or futures, such as individual stocks and forex markets. Essentially, it acts as a synthetic VIX (Volatility Index) for any asset , providing a gauge of market uncertainty. This modified version of William's indicator helps you to find market bottoms and market tops. It comes with 2 styles: Stochastic and histogram style. Please see screenshots

The Schaff Trend Cycle indicator is the product of combining Slow Stochastics and the moving average convergence/divergence (MACD). The MACD has a reputation as a trend indicator, but it's also notorious for lagging due to its slow responsive signal line. The improved signal line gives the STC its relevance as an early warning sign to detect currency trends. this indicator is converted from Trading View code of STC Indicator - A Better MACD [SHK]

Volume Profile is a very useful indicator . it allows you to spot the price levels where important price action took place. It is similar to support and resistance levels but with a different logic. ( Check Out Fixed Range Volume Profile MT5 )
One of the first thing that traders mark up when analyzing a chart is support and resistance. Volume Profile can be used for doing that too.
The indicator scans the defined number of previous bars and calculates the volume of activity at each price
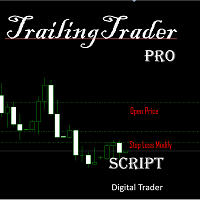
啟用TrailingTrader腳本後 報價視窗的交易品種 將會進行移動止損
設定參數 Symbol 設定需要移動止損的持倉品種 中間需要以","分隔 Magic 輸入需要移動止損的持倉單是別號 不需要識別時輸入-1 Comm 輸入 需要移動止損的持倉單是備註 不需要識別時不做任何輸入 TrailingDistance 啟動移動的點數 TrailingCallBack 移動止損的回調點數
工作原理 持倉單在獲利的條件下 市價超過設定的點數時 腳本自動設定止損線在市價回調的點數位置 當市價繼續往獲利的方向運行時 止損線會持續往運行方向調整 直到市價回調到止損線時獲利平倉 當同一品種持有多張持倉單時 移動止損會分開運行 當盈利超過一定的範圍時 移動止損線會形成同步狀況
特點 當交易員習慣手動開單 又無法長時間盯盤時 可以啟用移動止損 當持倉單一旦觸發工作 就可以確認該單會在獲利的條件下出場 可以跟EA交穿插使用 根據EA設定的Magic或Command做介入式管理
起用條件 需要使用MT5交易的電腦全天候開機運行 可以啟用腳本後 再同步到官方VPS 此時同步的腳本可以全天
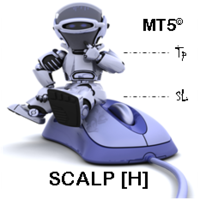
SCALP [H] is a panel-shaped robot designed to help the trader [scalper] trade on the Step Index, Step Index 200, Step Index 500, Multi Step 2 Index and Multi Step 4 Index assets [from Deriv.com broker]. From the dashboard, the trader can open new market orders and lock in the stop loss and take profit instantly. On the panel we have: the buttons to open new market orders; the buttons to select the points previously set in the inputs for stop loss and take profit and finally, the button for close

OrderManager 소개: MT5용 혁신적인 유틸리티 MetaTrader 5용 새로운 Order Manager 유틸리티를 통해 전문가처럼 거래를 관리하세요. 단순성과 사용 편의성을 염두에 두고 설계된 Order Manager는 각 거래와 관련된 위험을 쉽게 정의하고 시각화할 수 있습니다. 이를 통해 보다 효과적인 결정을 내리고 거래 전략을 최적화할 수 있습니다. OrderManager에 대한 자세한 정보는 매뉴얼을 참조하십시오. [ 매뉴얼 ] [ MT4 버전 ] [ 텔레그램 채널 ]
주요 특징: 위험 관리: 거래의 위험을 빠르고 쉽게 정의하여 더 나은 결정을 내리고 거래 성능을 향상시킵니다. 시각적 표현: 열린 포지션을 명확하고 간결하게 이해하기 위해 거래와 관련된 위험을 그래픽으로 볼 수 있습니다. 주문 수정: 몇 번의 클릭만으로 주문을 쉽게 수정하거나 닫아, 거래 과정을 간소화하고 소중한 시간을 절약합니다. 손끝의 뉴스: 한 번의 터치로 최신 시장 뉴스를 얻어 항상 정

이동 평균 수렴 발산(MACD) 거래 전략은 추세와 흐름 방향의 변화를 식별하는 데 사용되는 인기 있는 기술 분석 도구입니다. MACD는 12기간의 지수 이동 평균(EMA)에서 26기간의 EMA를 빼서 계산됩니다. "신호 선"이라고 불리는 9기간의 EMA는 MACD 위에 표시되어 매수 및 매도 신호를 트리거로 작용합니다. MACD 선이 신호 선 위에 있으면 매수 트렌드로 간주되고, 신호 선 아래에 있으면 매도 트렌드로 간주됩니다. 거래자들은 종종 이 정보를 사용하여 잠재적인 매수 및 매도 기회를 파악합니다. MACD는 다양한 방식으로 사용될 수 있는 다재다능한 지표입니다. 일반적으로 사용되는 몇 가지 방법은 다음과 같습니다. 교차: MACD 선이 신호 선 위로 크로스되면 매수 교차가 발생하고, MACD 선이 신호 선 아래로 크로스되면 매도 교차가 발생합니다. 발산: MACD가 새로운 고점을 형성하면서 기초 자산이 그렇지 않은 경우 매수 발산이 발생하고, MACD가 새로운 저점을 형성
FREE

우선적으로 이 거래 시스템은 다시 그리지 않고, 다시 그리지 않으며, 지연되지 않는 것을 강조할 가치가 있습니다. 이는 전문적인 거래에 이상적입니다. 온라인 강좌, 사용자 매뉴얼 및 데모. "스마트 서포트 앤 레지스턴스 트레이딩 시스템"은 새로운 및 경험 많은 트레이더를 위해 개발된 고급 지표입니다. 이 시스템은 외환 시장에서 정밀도와 신뢰감을 제공합니다. 이 포괄적인 시스템은 일일 거래 전략, 스윙 거래 전략, 지원 및 저항 전략, 캔들스틱 패턴 전략, VWAP 전략, 다중 시간대 추세 전략 등을 포함한 7개 이상의 전략, 10개의 지표 및 다양한 거래 방식을 결합합니다. 이 시스템은 화살표 신호, 진입 및 출구 지점, 거래 경보, 높은 시간대 추세 분석, 실시간 거래 모니터링 및 트렌드 및 볼륨 캔들 색상 제공합니다. 자동 지원 및 저항 감지로 다양한 시장 상황에서 신중한 결정을 돕는 다면적 인 지표입니다.
스마트 서포트 앤 레지스턴스 트레이딩 시스템은 프리미엄 및 강력한

Volatility Doctor Desert Eagle을 소개합니다: 폭발적인 거래 성공을 위한 궁극의 스캘핑 알고리즘!
거래 게임을 혁신하려면 준비가 되었나요? Volatility Doctor Desert Eagle을 찾아보지 마십시오. 이 알고리즘은 정밀도, 통제 및 수익성으로 트레이더를 강화하기 위해 설계된 궁극의 스캘핑 알고리즘입니다. 다음은 Volatility Doctor Desert Eagle이 다른 모든 것보다 뛰어나게 만드는 이유입니다.
1) 간단하고 직관적입니다: 복잡한 용어나 가파른 학습 곡선이 없습니다. 당사 알고리즘은 간단하고 이해하기 쉬운 매개 변수를 자랑하며 모든 경험 수준의 트레이더가 그 힘을 활용할 수 있도록합니다.
2) 데이터 기반 결정: 시장 변동성의 강력한 측정치의 힘을 활용하여 거래 결정을 수립하십시오. 추측을 작별하고 데이터 기반 전략에 인사를 올리십시오.
3) 완벽한 통제: 각 개별 설정에 대한 완전한 통제를 가지세요. 알고리즘
FREE

Heracles Indicator를 소개합니다. 이 지표를 사용하면 분석이 필요하지 않고 쉽게 거래할 수 있습니다. 자동으로 누적 구역, 진입 지점 및 명확한 이익 실현 수준을 식별합니다.
Heracles Indicator는 가격이 매수 또는 매도 진입 지점에 도달하면 알림을 표시하고 신호 화살표를 표시하며 이익 실현을 위한 세 가지 수준을 제안합니다.
초보자 및 전문 트레이더 모두에게 적합합니다.
채널 지원: 여기를 클릭하세요 MT4 버전: 여기를 클릭하세요
권장 사항:
시간 프레임: M5 및 M15 통화 쌍: 모든 통화 쌍 계정 유형: 매우 낮은 스프레드를 가진 ECN, Raw 또는 Razor 권장 스톱 로스: 50 픽스 또는 High/Low 지역 권장 이익 실현 수준: 25 픽스, 50 픽스 및 75 픽스
사양:
1/ 자동으로 누적 구역을 그립니다. 2/ 자동으로 매수/매도 진입 지점을 제안합니다. 3/ 높은 정확도로 세 가지 이익 실현 수준을

폭락률 닥터 - 시장 리듬을 마스터하는 전문가 어드바이저!
정밀 거래의 힘을 해제할 준비가 되셨나요? 폭락률 닥터를 만나보세요. 외환 시장의 다이내믹한 세계에서 신뢰할 수 있는 동반자입니다. 이 멀티-통화 전문가 어드바이저는 그저 거래 도구가 아닙니다. 시장 투자를 탁월하게 안내하는 심포니 지휘자입니다.
주요 기능을 알아보세요:
1. 트렌드 추적 전문성: 폭락률 닥터는 견고한 시장 트렌드를 발견하기 위해 검증된 방법을 사용합니다. 단순한 추측을 버리고 정보를 기반으로 한 결정을 내릴 수 있습니다.
2. 완전한 통제: 내장된 자금 관리 도구를 활용하여 거래 전략을 직접 조정하세요. 언제든지 열 포지션의 수와 거래 크기를 어떻게 증폭할지를 결정할 수 있습니다. 이것은 여러분만의 전략서, 여러분만의 방식입니다.
3. 폭락률 마에스트로: 이름에서 알 수 있듯이 이 EA는 시장 폭락률을 측정하고 모방하는 데 중점을 둡니다. 물이 그릇의 모양을 취하는 것처럼 시장 조건에 맞

이 지표는 유명한 프랙탈 지표를 기반으로 하지만 많은 사용자 정의 및 유연성을 갖추고 있습니다.
이는 추세 반전을 식별하고 수익 잠재력을 극대화하기 위한 강력한 도구입니다.
고급 기능과 사용자 친화적인 인터페이스를 갖춘 이 제품은 모든 수준의 거래자를 위한 최고의 선택입니다. MT4 버전 : Ultimate Fractals MT4 특징 :
사용자 정의 가능한 프랙탈 캔들 수. 반전 라인. 사용자 정의 가능한 설정. 사용자 친화적 인 인터페이스. 주요 매개변수: Candles On Left - 프랙탈을 형성하기 위해 왼쪽에 있는 막대 수입니다. Candle On Right - 프랙탈에서 오른쪽에 있는 막대 수입니다.
시장의 불확실성이 당신을 방해하도록 놔두지 마십시오. "Ultimate Fractals" 표시기로 트레이딩 게임을 향상시키세요.
이 도구를 사용하여 자신감 있는 결정을 내리고 재정적 목표를 달성하는 성공적인 트레이더 대열에 합류하세요. 특정 "Ult
FREE

IMPORTANT: I've decided to reduce the price to the cheapest possible, as I'm currently working hard on my next EA and therefore don't have time to keep my old EAs as up-to-date as I would normally like to. I'm still available for support though! The Dow Jones index, also known as the US30, is a very well diversified index with a unique way of weighting it’s components. These factors often make this index’s open a bit more rangebound, so instead of trading breakouts, The US30 Market Maker uses

"Adaptive Moving Average Envelope" 지표는 금융 시장에서 현명한 결정을 돕는 도구입니다. 이 지표는 트레이딩에서의 트렌드 방향과 가능한 진입 및 이탈 포인트를 명확하게 제시하기 위해 설계되었습니다.
이 지표는 시장 변동성의 변화에 자동으로 적응하는 적응형 이동 평균을 기반으로 합니다. 이는 고요한 시장에서부터 변동성이 큰 시장까지 모두 유용하게 사용할 수 있습니다. 이 지표는 적응형 이동 평균을 둘러싼 두 개의 선을 표시합니다. 이러한 선은 중요한 서포트 및 저항 수준을 식별하는 데 도움을 주며, 자산을 언제 사고 팔아야 하는지에 대한 더 현명한 결정을 내릴 수 있도록 합니다.
고급 기술적인 특성을 가진 이 지표임에도 불구하고, 이해하고 사용하기 쉬워 초보자와 숙련 트레이더 모두에게 적합합니다. 이 지표의 시장 조건에 자동으로 적응하는 능력은 다양한 상황에서 다재다능하고 효과적이라고 할 수 있습니다. 시장 트렌드를 명확하게 시각화하여 충동적인 거
FREE

Volatility Doctor 기본 에디션을 소개합니다: 귀하의 궁극적인 시장 거장!
정밀 거래의 진정한 잠재력을 발휘하기 위한 여정에 나서 ready 하셨나요? Volatility Doctor를 소개합니다. 이것은 외환 시장의 끊임없이 진화하는 세계에서 신뢰할 수 있는 동료입니다. 이 특별한 다중 통화 전문가 자문가는 거래 도구뿐만 아니라 놀라운 정밀도와 세련미로 귀하의 투자를 지휘하는 가상의 지휘자입니다.
혁신적인 기능을 발견하세요:
1. 비할 데 없는 트렌드 분석: Volatility Doctor는 견고한 시장 트렌드를 식별하기 위해 검증된 방법을 사용합니다. 무작위 추측에 작별을 고하고 정보에 기반한 결정의 새로운 시대를 엽니다.
2. 귀하의 손에 절대적인 통제력: 내장된 자금 관리 도구로 거래 전략을 완전히 통제하세요. 특정 시점에 열 포지션 수와 거래 크기를 어느 정도로 증폭할지를 결정하세요. 이것은 귀하의 맞춤형 플레이북으로 귀하의 독특한 선호도에 맞게
FREE
TradeFlow 대시보드 MT5는 거래 관리의 패러다임 전환을 나타내며 Meta Trader 5 플랫폼 내에서 위험 관리 전략을 향상하고 의사 결정을 간소화하도록 맞춤화된 강력하고 다양한 솔루션을 제공합니다. 세련되고 사용자 친화적인 인터페이스를 갖춘 이 도구는 기존 거래 경험을 뛰어넘으며 특히 성과를 향상시키려는 수동 거래자에게 적합합니다.
TradeFlow Dashboard MT5의 주요 특징을 자세히 살펴보고 각 기능이 원활하고 강력한 거래 경험에 어떻게 기여하는지 살펴보겠습니다.
원활한 주문 실행: TradeFlow 대시보드 MT5를 사용하면 매우 쉽게 매수, 매도, 제한 및 중지 주문을 실행할 수 있습니다. 고정된 로트 크기를 선호하든, 백분율을 통해 위험을 관리하든, 이 도구는 귀하의 고유한 거래 스타일에 맞춰 조정되어 모든 거래에 정확성과 통제력을 제공합니다.
간편한 추적 중지 활성화: 원클릭으로 추적 중지를 활성화하면 시장의 역동적인 특성을 탐색하는 데
FREE

설명:
"시장 구조 HH HL LH LL" 지표는 금융 시장의 가격 역학을 분석하기 위한 강력하면서도 간단한 도구입니다. 이 지표는 거래자와 투자자가 추세 변화를 식별하고 가격 시계열의 중요한 지점을 식별하는 데 도움이 됩니다.
지표의 주요 구성 요소:
HH(고가): 가격이 이전 고점 위로 마감되는 고점입니다. HH는 강화된 상승 추세를 나타냅니다. HL(고저점): 가격이 이전 저점 위로 마감되는 최소값입니다. HL은 상승 추세의 지속을 확인합니다. LH(낮은 고점): 가격이 이전 고점 아래로 마감되는 고점입니다. LH는 추세 반전 가능성을 나타냅니다. LL(낮은 저점): 가격이 이전 저점 아래로 마감되는 최소값입니다. LL은 하락 추세의 시작을 확인합니다.
사용하는 방법:
"시장 구조 HH HL LH LL" 지표는 거래자와 투자자가 시장의 현재 추세를 판단하는 데 도움이 됩니다. 상승 추세는 HH와 HL의 연속으로 나타나고, 하락 추세는 LH와 LL의 연속으로

The Stochastic Oscillator is one of the main indicators used in the analysis of financial assets. It is one of the highlights in the study of price movements and can be an important indicator of changing trends in the capital market. Stochastic is an oscillator used to identify when an asset is overbought or oversold. It consists of two lines: %K, which is calculated from the highs and lows of a period, and %D, which is a moving average of %K. Our version contains color filling, which facilitate
FREE

The Ultimate Forex Expert Advisor
A beast designed to conquer Automated Trading with Ease. This isn't just another Expert Advisor; it's a true powerhouse designed to revolutionize your trading experience. After 14 years of relentless testing, refining, and unwavering dedication, I am proud to present an Expert Advisor that has earned its well-deserved name and price.
Here's why it stands out from the rest: Unparalleled Flexibility:
FX-Legend works seamlessly across all currency pairs, e

Forex Scalper EA trades three currency pairs simultaneously! The strategy is very simple: limit orders are placed in both directions until one is triggered. Pyramid scheme (multiple limit orders) increase profits when price moves in one direction or another.
This EA provides functions: Start Trading, End Trading, Сlose Order(Time), Pending Order Placement (Time), Tralling stop (automatically according to strategy), trading can be switched off, daily range (strategy), stop loss per day (risk m
FREE
Robô para Operações com Opções da B3 - Versão Mapa Demo
Ele permite executar operações com opções de ativos da B3, desde a montagem de uma posição simples com opções e o ativo, até 4 pernas, e operações estruturadas, rolagens, rodar strike, e fechar posição, tudo de forma simples e intuitiva.
Mostra o mapa das opções por vencimento, com seus principais valores, as gregas, preço teórico, últimos volumes, e diversos indicadores relacionados as opções, além de indicar as opções que se está pos
FREE
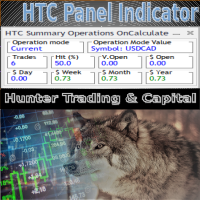
HTC Panel Indicator is an operational summary dashboard for use in conjunction with trading EA.
It provides a concise summary of the current year's trades, open positions and profit history.
The summary can be filtered by the current chart asset, by the ID (magic number) of an EA or by all trades performed in the year.
The panel must be inserted into the chart as an indicator, making it possible to add it to a chart that already has a trading EA.
FREE

QM (Quasimodo) Pattern is based on Read The Market(RTM) concepts. The purpose of this model is to face the big players of the market (financial institutions and banks), As you know in financial markets, big traders try to fool small traders, but RTM prevent traders from getting trapped. This style is formed in terms of price candles and presented according to market supply and demand areas and no price oscillator is used in it. RTM concepts are very suitable for all kinds of investments, includi

This is a simple Candle Stick Pattern Indicator, which shows in the current time period all standardisized Patterns in the chart. All Patterns will be calculatet automatically based on standard conditions. Following Candle Stick Patterns are included: Bullish Hammer | Bearish Hammer Bullish Inverted Hammer | Bearish Inverted Hammer Bullish Engulfing | Bearish Engulfing Piercing | Dark Cloud Cover Bullish 3 Inside | Bearish 3 Inside There are only a few settings at the begining to take. Every Pat
FREE
Unlock the power of synchronized chart analysis with Chart Sync, your ultimate solution for harmonizing technical objects across multiple charts on the same trading symbol,
ChartsSync Pro MT5 is a groundbreaking MetaTrader 5 utility designed to streamline your trading workflow, enhance analysis precision, and amplify your trading decisions.
Features:
Effortless Object Synchronization.
Multi-Chart Harmony.
User-Friendly Interface.
Real-Time Updates.
Sync Objects Color,Width and Style.
FREE

Introducing Auto Trendline Pro : Your Ultimate Trading Companion Are you tired of manually drawing trendlines on your forex charts? Do you wish for a tool that can simplify your trading while providing timely alerts? Look no further, because Auto Trendline Pro is here to revolutionize your trading experience. In the fast-paced world of forex trading, staying ahead of the curve is essential. Identifying trends, both upward and downward, can be a game-changer. This is where Auto Trendline Pro ste

In the ever-evolving world of Forex trading, understanding the different trading sessions is paramount to making informed trading decisions. Each trading session brings its own unique characteristics, opportunities, and challenges, and recognizing these can greatly enhance your trading strategies. Whether you're a novice or a seasoned trader, the Forex market's three main trading sessions – Asian, London, and New York – are crucial milestones that dictate market behavior and potential trade set

"Triple Performance" Trading Strategy Harness the market's full potential with this dynamic strategy! Key Indicators: MACD (Moving Average Convergence Divergence): Identifies trend reversals. RSI (Relative Strength Index): Signals market conditions. CCI (Commodity Channel Index): Measures market strength. Main Benefits: Maximize profits by utilizing clear signals. Automatic position control with MACD. Easy customization with configurable RSI and CCI levels.
Works perfectly with EUR/
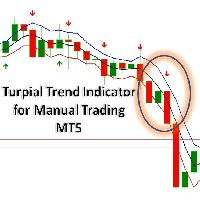
Turpial Trend Indicator for Manual Trading. Indicator (arrow) for all Symbols and Periodicity. This indicator considers a pullback strategy and a trend strategy. The strategy that is based on criteria for the Rsi, Atr and Macd indicators. The channel band corresponds to the maximum and minimum average values of three bars (Bill Williams 3-bar strategy). BUY when there is a Green Arrow. It is advisable to place the StopLoss below the bottom line of the channel. SELL when there is a Red Arrow. I

The KT Knoxville Divergence is a powerful tool that reveals unique price divergences in a financial instrument by employing a carefully crafted combination of the Relative Strength Index (RSI) and a momentum oscillator. This indicator effectively captures subtle variations in market dynamics and assists traders in identifying potentially profitable trading opportunities with greater precision. Knoxville Divergences is a type of divergence in trading developed by Rob Booker. Divergence in tradin

Hello Traders..
Tried deals without stop-lose? :)
=-=-=-=-=--- Grid EA Robot { Simple Moving Average } crossover 4sma & 11sma Strategy ---=-=-=-=-=
BY below pics you will know what strategy doing by automatic open and close Trades.
[ BUY ]
4.sma crossover 11.sma
https://ibb.co/0XZFBf2
[ SELL ]
11.sma crossunder 4.sma
https://ibb.co/VpqsLmD
[ backtest ] - XAUUSD - settings below. Note: don't change these settings for ( xauusd pair ) -TF 1 hour
https:/
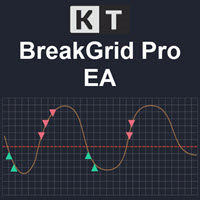
Unleash the power of precision and innovation in your trading with the KT BreakGrid Pro EA. Seamlessly blending the strategic prowess of breakout and grid trading, this expert advisor is your ultimate solution to navigating the complex Forex landscape with unmatched confidence and efficiency.
Recommendations
Symbol: EURUSD TimeFrame: M5 Account Type: Hedge Leverage: 1:500 Set Files: Not required. Default inputs provides best results.
Features Breakout-Infused Grid Strategy: Experience th

Note: minimum investment 1000 usd or (100 usd is Account Cent (10000 Cent)) Run At 0.01 lot start. Trading with an Expert Advisor (EA) on the M1 timeframe (1-minute chart) can be quite challenging due to the rapid price movements and increased noise in such short timeframes. However, it's not impossible, and some traders do use EAs on the M1 chart for specific strategies. Here are some considerations for trading with an EA on the M1 timeframe: 1. Strategy Selection: Choose a trading strategy
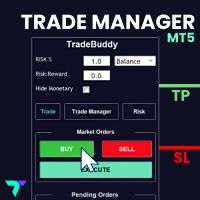
This adds an easy to use trading panel to your MetaTrader5 chart, enabling you to enter the market at lightning speed with your risk automatically calculated. Plus, it will help you automate your trade management with automatic & one click partial profits, stop loss to breakeven and more. Click here for the full Trade Buddy user guide If you want to test Trade Buddy before you purchase, please message us by visiting our profile and we will provide you with a 7 day free trial. Best of all, it’s c
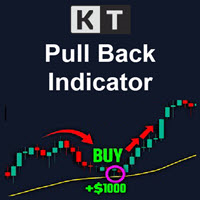
The KT Pull Back Arrows shows the pull back arrows using the RSI (Relative Strength Index) to identify suitable pull-back entry areas within the overbought and oversold zones. The indicator effectively pinpoints favorable moments for initiating pull-back trades by leveraging these RSI thresholds. Trend trading is often considered the most profitable strategy in the Forex market. It is the equivalent of riding the wave, going with the flow, and capitalizing on market momentum. However, timing is

The Stochastic Momentum Index (SMI), developed by William Blau and featured in the January 1993 edition of Technical Analysis of Stocks & Commodities magazine, introduces a unique perspective to trading analysis. Distinguished from the conventional Stochastic Oscillator, which evaluates the current close in relation to the recent x-period high/low range, the SMI assesses the close's position relative to the midpoint of this range. This innovation yields an oscillator with a range of +/- 100, re
FREE
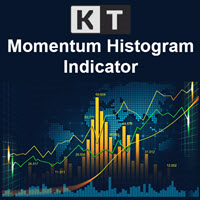
KT Momentum Histogram provides traders with a visualization of the momentum of a particular asset, which helps determine the strength and potential direction of a market trend. The indicator calculates and operates based on momentum in trading.
What Exactly is a Momentum Histogram
Momentum is the rate of acceleration of an asset's price or volume. In other words, it measures the speed at which the price of an asset is moving in a particular direction over a specific period of time. Positive
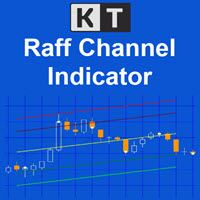
The KT Raff Channel is an enhanced and refined iteration of the original Raff channel concept pioneered by Gilbert Raff in 1996. This indicator builds upon Raff's initial work, incorporating modifications and advancements to provide traders with a more sophisticated and powerful tool. Gilbert Raff, a renowned name in the field of financial market analysis, is the developer of the Raff Regression Channel. This technical tool is designed for discerning and validating possible market price trends.
To access the MT4 version of this EA you can contact via private message. Also you can contact for further modifications. strategy description: - Detect underlying trend using the BxTrender indicator in daily time frame. - Trigger entry using supertrend indicator in M15 time frame. - Also use supertrend indicator to set SL and TP accordingly. EA setup - Nasdaq and other indices(like DAX40) are suggested to be traded. - Risk per trade is hard coded to 0.5%. - Risk:Reward ratio is hard coded to 1:
FREE
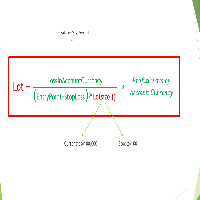
Important Note: Before using it in a real account test it in your demo account.
//+------------------------------------------------------------------+ //| Optimum_Lot_Size.mq5 | //| Copyright 2023, MetaQuotes Ltd. | //| https://www.mql5.com | //+------------------------------------------------------------------+ #property copyright "Copyright 2023, MetaQuotes Ltd." #propert
FREE

This indicator is used to find support and resistance lines
The support and pressure of different time periods can be found in the same icon cycle, and two time periods are provided here
Parameter Description:
---------------------- Main ---------------------
Timeframe //Used to select the main time period (recommended as the default PERIOD_D1);
Retracement interval //This value is the root number of backtracking k-lines (recommended to be 20 by default);

The indicator determines signals on a system of two components:
- correct fractals. The indicator that comes with MT4 and MT5 is quite crude, since some levels are calculated incorrectly. This indicator shows signals for the breakdown of strong levels. - wave level for fractals. Not to be confused with zigzag.
It is better to use on higher timeframes (M15 and higher), where the indicator perfectly shows entry points and reversal situations.
Of course, you can use standard indicators from

This is the Full Version, to get the free version please contact me.
The free version works on “AUDNZD” and “XAUUSD” charts.
All symbols and time frames scanner
Head and Shoulder
One of the most popular Price Action patterns is the Head and Shoulders pattern. The pattern has three local tops that resemble the left shoulder, head, and right shoulder. The head and shoulders chart pattern appears in all kinds of markets, including Forex, cryptocurrency, commodities, stocks, and bonds. The

Basic Gold Predictor is a sophisticated Expert Advisor meticulously crafted for traders and investors with a keen interest in the precious metal, gold. This advanced algorithm combines the power of multi-timeframe analysis and fundamental technical analysis to provide accurate and timely predictions for gold price movements.
Key Features: Multi-Timeframe Analysis: Basic Gold Predictor leverages multiple timeframes, from short-term intraday charts to longer-term daily charts. By considering var

The KT 4 Time Frame Trend is an invaluable forex indicator for traders seeking to identify the trend direction across 4-time frames accurately. This innovative indicator allows users to simultaneously observe and analyze price trends across four different timeframes. Whether you're a beginner or an experienced trader, this tool offers an enhanced understanding of trend dynamics, leading to improved trading strategies on your trading platform. The capability to concurrently monitor multiple timef
The KT Risk Management Indicator provides a comprehensive overview of the profit/loss and risk management characteristics of your Metatrader account, offering valuable insights and information. It efficiently categorizes the displayed information at account and symbol levels, ensuring a clear and organized presentation of crucial data. Risk is inherent when trading the Forex market - a reality that seasoned traders acknowledge and beginners quickly realize. To succeed in this volatile market, t
Daily Trading Statistics is expert advisor that count: -Today entries: sum of all in entries of the day; -Today winning deals profit: sum of the profits of all winning entries of the day; -Today lossing deals profit: sum of the profits of all losing entries of the day; -Today deals profit: balance of profits between the winning entries and the losing entries of the day.
FREE

Infinity Indicator MT5 1.0 Panel Asset Rate % EURUSD 96.0% GBPUSD 94.1% AUDCAD 90.5% USDCHF 87.8% BTCUSD 78.4% Panel Win Rate based on CandleMT4 Exit Button Calculates the StdDev standard deviation indicator on the RSI data, stored in the matrix similar to the keltner. input int HourCalculate = 12; RsiLength = 5; RsiPrice = PRICE_CLOSE; HalfLength = 4; DevPeriod = 100; Deviations = 0.9; UseAlert = true; DrawArrows = true; TimerWork=300; LevelUp = 80; LevelDown = 20; MoreS
This EA will automatically close all open order when profit or loss is reached according to users setting. You need to select close by percentage or close by amount. If close by percentage or close by amount is set to true the EA will exit. When the setting is set to true, the value of profit and loss can not be 0. Please set to true the option for Close Order with Same Symbol or Close All Order.
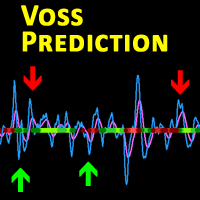
Description This is a modified version of the popular Voss Predictive Filter - A peek into the future by Dr. John Ehlers. It contains 2 lines - V-Line (blue) and F-Line (red), a trend indication and BUY/SELL signals.
Usage Buy Green dots indicate an up trend. Open a BUY position if the V-Line crosses the F-Line from below and an up trend is signaled (green dots) Close BUY position if V-Lines falls beneath F-Line again Sell Red dots indicate a down trend Open a sell position if V-Line falls

The KT Buy Sell Volume is a powerful tool traders use to gauge the strength and weakness of price movements. In the whirlwind of the Forex market, traders aim to identify and ride the waves of a bullish or bearish trend that exudes strength and potential. However, recognizing these trends necessitates a method, metric, or indicator to quantify their strength. One crucial factor that traders examine for this purpose is volume. Volume refers to the number of shares or contracts traded in a securit

- This is the exact conversion from TradingView: "Support/Resistance" By "BarsStallone". - This indicator lets you read the buffers for R/S values. - This is a non-repaint and light processing load indicator. - This is not a multi time frame indicator If you want the multi time frame version you should create a personal order and I deliver two files that you need them both to have the multi time frame indicator running on your system. - The MT4 version of the indicator is not light load from pr

The KT Trades Info indicator is useful for traders wishing to stay informed about their trading performance. This indicator provides real-time updates on the profitability of all ongoing and completed trades, enabling traders to make well-informed decisions. By incorporating key financial metrics, it provides a comprehensive picture of a trader's financial status at a glance. This means traders can monitor their performance with increased accuracy and precision, facilitating better risk manageme

Hold on to this beast, its a scalping EA to be used with different config with different pairs, works best on 4H timeframe, although one can backtest with other time frames to find out the best configuarations.
Reach out to me at shankysk47@gmail.com for Set info to be used alomg with the EA. I have spent 5 years in developing this EA, after many failed attempts I have made this EA. This should give the desired results
FREE

About This Indicator: RSI vs SMA Oscillator: A Comprehensive Technical Analysis Tool for Better View of Market Price
The RSI vs SMA Oscillator is a powerful technical analysis tool designed to understanding Market Price Fluctuation for buy or sell signals. This user-friendly Oscillator good for both novice and experienced traders, providing valuable insights into market trends and price movements. Key Features: - RSI Cross Alert: The indicator is based on the Relative Strength Index (RSI), a po
FREE

O SupRes Master é ferramenta essencial para traders, fornecendo alertas instantâneos sempre que o preço de um ativo fecha acima de uma resistência crucial ou abaixo de um suporte vital.
Além disso, ele simplifica a análise técnica ao destacar esses níveis críticos no gráfico, usando cores distintas para identificar níveis de suporte em azul e níveis de resistência em vermelho.
Essa abordagem visual torna mais fácil para os traders identificarem oportunidades de entrada ou saída, melhorando s

이 제품은 뉴스 시간 동안 모든 전문가 어드바이저 및 수동 차트를 필터링하여 수동 거래 설정이나 다른 전문가 어드바이저가 입력한 거래가 파괴될 수 있는 급격한 가격 상승으로부터 걱정하지 않아도 됩니다. 이 제품은 또한 뉴스 발표 전에 열린 포지션과 대기 주문을 처리할 수 있는 완전한 주문 관리 시스템이 함께 제공됩니다. The News Filter 를 구매하면 더 이상 내장 뉴스 필터에 의존할 필요가 없으며 이제부터 모든 전문가 어드바이저를 여기서 필터링할 수 있습니다.
뉴스 선택 뉴스 소스는 Forex Factory의 경제 캘린더에서 얻어집니다. USD, EUR, GBP, JPY, AUD, CAD, CHF, NZD 및 CNY와 같은 어떤 통화 기준으로 선택할 수 있습니다. Non-Farm (NFP), FOMC, CPI 등과 같은 키워드 식별을 기준으로 선택할 수도 있습니다. 저, 중, 고 영향을 가지는 뉴스를 필터링할 수 있도록 선택할 수 있습니다. 차트와 관련된 뉴스만
뉴스 필터를 사용하는 데 필요한 스크립트입니다. 이 스크립트는 필터링할 차트를 선택하고 입력을 뉴스 필터 프로그램으로 보냅니다. 모든 입력은 해당 차트에만 적용되므로 차트마다 다른 입력을 유연하게 설정할 수 있습니다. 뉴스 필터(무료 데모)에 대한 링크는 아래에서 확인할 수 있습니다: 뉴스 필터 가이드 + 다운로드 링크
뉴스 선택 뉴스 소스는 Forex Factory의 경제 캘린더에서 얻어집니다. USD, EUR, GBP, JPY, AUD, CAD, CHF, NZD 및 CNY와 같은 어떤 통화 기준으로 선택할 수 있습니다. Non-Farm (NFP), FOMC, CPI 등과 같은 키워드 식별을 기준으로 선택할 수도 있습니다. 저, 중, 고 영향을 가지는 뉴스를 필터링할 수 있도록 선택할 수 있습니다. 차트와 관련된 뉴스만 선택하는 자동 모드가 있습니다. 뉴스 소스는 최신 뉴스 데이터를 보장하기 위해 매 시간 자동으로 새로 고칩니다. 각 뉴스 영향 수준에 대한 별도의 입력이 제공되
FREE

인기 있는 "슈퍼트렌드" 지표는 테크니컬 분석 도구로, 금융 시장에서의 트렌드 방향과 가능한 진입 또는 청산 지점을 식별하는 데 도움을 줍니다. 이 지표는 평균 실 범위 (ATR)를 기반으로 하며, 이는 가격 범위를 기반으로 시장 변동성을 측정합니다. 다른 플랫폼에서는 무료로 제공되며, 여기서도 마찬가지입니다! 일반적으로 세 가지 방법으로 사용됩니다: 현재 트렌드 식별: 가격이 이 라인 위에 있는 경우 상승 트렌드로 간주되며, 가격이 이 라인 아래에 있는 경우 하락 트렌드로 간주됩니다. 손실 제한 수준으로 사용됩니다. 동적 지지/저항으로: 상승 트렌드에서 이 라인은 가격 아래에 위치하며 동적 지지 수준으로 작용합니다. 하락 트렌드에서는 이 라인이 가격 위에 위치하며 동적 저항 수준으로 작용합니다.
FREE
차트 범위(Chart Range)는 종가를 기준으로 지지선과 저항선을 분석하는 전문가 자문입니다.
Expert Advisor는 2012년부터 2022년까지 각 실제 틱에 대해 백테스트를 거쳤으며, 각 교차에 대한 예금은 10.000$(센트 계정의 100$)입니다.
통화 세트에 대해서는 댓글을 확인하세요.
라이브 신호 : https://www.mql5.com/en/signals/2058817
권장사항:
통화쌍: GBPUSD,AUDNZD,AUDCAD,EURGBP,AUDUSD,NZDCAD 기간: H4
Chart Range is an Expert Advisor that works on Support and Resistance based on closing prices . Expert Advisor was backtested from 2012 to 2022 on each real tick, with deposit for each cross of 10.000$

Yahweh는 주로 XAUUSD(Gold)와 지수를 거래하는 전문 자동화 거래 봇입니다. 수십 년간의 수동 백테스팅 전략을 바탕으로 개발되었으며 오랜 시간 동안 테스트를 거쳤습니다. Yahweh는 초기 추세 감지, 추세 지속 및 이러한 추세 방향으로의 거래를 위한 적절한 전략을 갖춘 추세 거래 봇입니다. 다양한 기술 지표를 사용하여 추세를 식별합니다.
추천 세트 파일은 내 채팅에서 다운로드 받으실 수 있습니다. 이는 좋은 시작을 제공할 것입니다. 그러나 우리는 한 브로커에서 다음 브로커까지 결과에서 상당한 차이를 발견했습니다. 출발점으로만 사용하시기 바랍니다.
테스트를 시작하기 전에 뉴스 기록 데이터를 다운로드했는지 확인하세요. EA를 라이브 차트에 1분 정도 연결하여 뉴스 데이터를 얻을 수도 있고, 댓글이나 채팅에 있는 링크를 통해 뉴스 내역 파일을 다운로드할 수도 있습니다.
전용 채널에 가입하세요 -> Yahweh Trading 채널 -질문, 지원 프로모션 가격을 활

"Hypercon Pro MT5"는 고전적인 거래 전략을 기반으로 한 다중 통화 전문 조언자입니다. 시장 진입점은 변동성 특성과 거래되는 통화쌍의 현재 역학을 고려하여 자동으로 결정됩니다. 위험을 줄이려면 센트 계정을 사용하는 것이 좋습니다. 신호. 입력 데이터: 1. 포지션 개설 "Period_": 차트의 기간에 따라 포지션 개시 강도가 결정됩니다. 기간이 짧을수록 거래가 더 공격적입니다. "Choosing_a_strategy": "Strategy_No.1: Lot_from_Take-Profit" - "Take-Profit"에 대한 데이터를 설정하면 포지션 볼륨("Lot_")이 자동으로 계산됩니다. "Strategy_No.2: Take-Profit_from_Lot" - "Lot_"에 대한 데이터 설정 및 "Take-Profit"("Take-Profit_closing"인 경우) 또는 "Stop-Loss"("Trailing_SL_closing"인 경우)가 자동으로 계산됩니다. "Al
The KT MTF Order Blocks automatically plots the institutional order blocks by using a unique blend of price action with comprehensive multi-timeframe analysis. This advanced approach reveals the area of price reversal, originating from significant buy and sell orders strategically placed by major market players.
Features
Algorithmic Precision: A refined and distinctive order block algorithm meticulously crafted to precisely identify the most pivotal order blocks, often triggering price reve
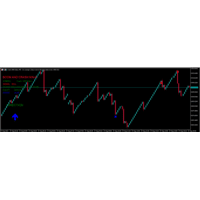
The indicator has three signals. The two arrow signals and when you get the message expect the spike. You only enter the market when all the conditions are met. The big arrow indicates the overall market direction while the small arrows indicates the support and resistance. Message "Expect spike" indicates that the market is about to spike so if you are trading against it you should exit that market.
FREE

Take control of your operations efficiently at trading, mannaging by an smart way the risk of your positions. Whit this tools, you can:
Estimate the potencial profits or losses from your operations, either in money or pips. You also can visualize profits or losses by substracting the spread cost previusly configured in the tool’s input parameters. Calculate the lot size or margin required for your orders. Estimate the risk/reward ratios of your positions. Study the negative impact of the sprea

The initial price is 92.25 USD, the future price is 250 USD
Universal advisor with the use of economic and fundamental news " Smart News Trade ". Trading tactics are based on tracking the dynamics of the market and accelerating the price movement. Not guessing, not forecasting, only calculations with clear guidelines for the direction of positions. The work is carried out with pending orders, a stop loss is used to protect funds. A VPS server is required for smooth operation. Ease of use: Th

Real Quants Forex Volatility Catcher for MT5 Introduction Real Quants Forex Volatility Catcher is a cutting-edge automated trading system designed specifically for MetaTrader 5. Developed through advanced machine learning and exhaustive data mining techniques, this system offers traders a robust strategy for navigating the complex terrains of the forex markets. With a commitment to rigorous testing that includes Monte Carlo simulations, walk-forward matrix optimization, and live execution valida
FREE
트레이딩 전략과 기술 지표를 판매하기에 가장 좋은 장소가 왜 MetaTrader 마켓인지 알고 계십니까? 광고나 소프트웨어 보호가 필요 없고, 지불 문제도 없습니다. 모든 것이 MetaTrader 마켓에서 제공됩니다.
트레이딩 기회를 놓치고 있어요:
- 무료 트레이딩 앱
- 복사용 8,000 이상의 시그널
- 금융 시장 개척을 위한 경제 뉴스
등록
로그인
계정이 없으시면, 가입하십시오
MQL5.com 웹사이트에 로그인을 하기 위해 쿠키를 허용하십시오.
브라우저에서 필요한 설정을 활성화하시지 않으면, 로그인할 수 없습니다.