MetaTrader 5용 새 Expert Advisor 및 지표 - 110

Hello all friends What I will present today is a grid system that doesn't have grid. Its work is Open to buy and sell at the same time. Or choose to open either side in the settings. The weakness of this system is that when the graph runs one way for a long time, it is very damaged. I have prepared a function for reducing damage.Details about how to set up according to the youtube link.
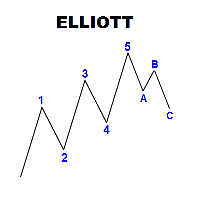
Panel with a set of labels for marking the Elliott wave structure. The panel is called up by the Q key, if you press twice, you can move the panel according to the schedule. The panel consists of seven rows, three colored buttons, each of which creates 5 or 3 labels of wave marking. Correction, consist of 3 tags, or five with a shift, you can break the chain of tags when installed by pressing the Esc key The optimal font for labels is Ewapro, which can be downloaded from a permanent link in the

Stop Loss with Profit
Free Version*.
Complete Version here.
This utility / expert for MetaTrader 5 modifies the stop loss of all your operations dynamically and automatically to ensure the minimum benefits you want, and be able to operate with or without Take Profit.
Maximize your benefits, by being able to trade with Unlimited Take Profit. You will ensure the number of minimum points you want to earn in each operation and the stop loss will be adjusted as long as the benefit of the oper
FREE

Stop Loss with Profit
This utility / expert for MetaTrader 5 modifies the stop loss of all your operations dynamically and automatically to ensure the minimum benefits you want, and be able to operate with or without Take Profit.
Maximize your benefits, by being able to trade with Unlimited Take Profit. You will ensure the number of minimum points you want to earn in each operation and the stop loss will be adjusted as long as the benefit of the operation grows.
For example: you open a pur

Ondas de Divergência. Antes do mercado tomar um sentido e se manter em tendencia, existem sinais que podem ser lidos, nos permitindo assim entender o "lado mas forte", e realizar trades de maior probabilidade de acerto com risco reduzido, esses movimentos são persistentes e contínuos, proporcionando excelente rentabilidade. Ondas de Divergência é um histograma que acumula a divergência de entre preço e volume a cada tick, permitindo assim encontrar pontos de absorção, áreas de acumulo e distrib

The DYJ ThreeMACross is based on three Moving Average indicators. ThreeMACross is based on the following idea: crossing of three Moving Average lines (Fast, Middle and slow ones) is used as a signal for opening and closing a position together. Go Long when Fast MA (MA1) crosses above Middle MA (MA2), and Middle MA (MA2) crosses above Slow MA (MA3). Go Short when Fast MA (MA1) crosses below Middle MA (MA2), and Middle MA (MA2) crosses below Slow MA (MA3). The Expert Advisor also features money m
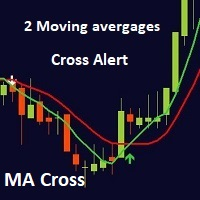
MA cross ALERT MT5 This indicator is a full 2 moving averages cross Alert ( email and push notification "mobile" ), 2 MA with full control of MA method and applied price for each moving average "slow and fast", -simple, exponential, smoothed, linear weighted. - close, open, high, low, median price, typical price, weighted price. you can modify periods as well for both MA. For any suggestions don't hesitate, thanks
Boleta de negociação, adiciona automáticamente as ordens Take Profit e Stop Loss quando excutada uma ordem de compra ou venda. Ao apertar as teclas de atalho (A, D, ou TAB), serão inseridas duas linhas de pre-visualização, representando as futuras ordens de take profit (azul) e stop loss (vermelho), as quais irão manter o distanciamento especificado pelo usuário. Ditas ordens só serão adicionadas ao ser executada a ordem inicial. Ao operar a mercado, as ordens pendentes de take profit, e stop lo

Orca EA ΜΤ5 는 완전 자동화된 Expert Advisor입니다. 고급 가격 행동 기반 알고리즘은 다음 캔들의 방향을 예측하고 적절한 거래를 개시(또는 개시하지 않음)하려고 합니다. 그것은 모든 시장 조건에서 매우 다재다능하게 만드는 고유한 설정 수를 가지고 있습니다. Orca EA MT5 에는 ECN Raw Spread ICMarkets 계정(뉴욕 기반 GMT+3 시간대 서버)에 특별히 최적화된 2022년 세트 파일이 함께 제공됩니다. 다른 브로커 또는 계정 유형을 사용할 수 있지만 Orca EA MT5 를 테스트하고 브로커/계정에 맞게 필요한 시간 조정을 해야 할 수 있습니다. 조언: 저의 모든 EA는 시장을 예측하는 기적의 제품이 아니라 잃는 것보다 더 많은 것을 얻으려고 노력하는 정직하고 잘 코딩된 전문가 조언자입니다. 그들은 마팅게일이나 그리드 전략을 사용하지 않기 때문에 그들의 결과는 수익성이 있는 직선이 아니지만 기복이 있고 성공하기 위해서는 인내와 규
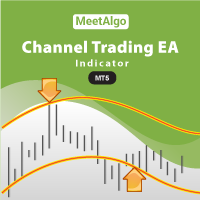
CAP Channel Trading EA MT4 is Expert Advisor that base on our famous indicator CAP Channel Indicator . EA is a non-optimized expert advisor you have to find best setting by yourself. Who using our CAP Channel Indicator and looking for EA that base on Channel indicator this EA is best for them. We give lots of options so you can customize your trading strategy. [ Installation Guide | Update Guide | Submit Your Problem | All Products ] Channel Trading is a volatility-based indicator th

The indicator shows Profit Zones on the chart, displaying the beginning and end of the local trend Profit Zone PRO is perfect for all Meta Trader symbols: currencies, metals, cryptocurrencies, stocks and indices
Advantages of the Profit Zone PRO indicator:
Input signals without redrawing The algorithms of the indicator allow you to find the ideal moments to enter a transaction (purchase or sale of an asset), which increase the success of transactions for 100% of traders. The indicator has t
FREE
Unique trend trading algorithm with advanced filtering and many features which should become a part of your trading arsenal. This indicator can give you also trading advisors (with take profit target), success rate scanner and much more.
Important information
For additional detailed information you can visit the 747Developments website.
Features Easy to use (just drag and drop to the chart) Possible to use with any trading instrument Possible to use on any time-frame Take profit advisors S
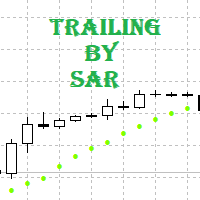
Tracking positions using trailing on the Parabolic SAR indicator. It is necessary to allow automated trading in the terminal settings. In testing mode, the utility opens Buy or Sell positions on the first ticks, which allows you to visually observe the given logic, changing the utility parameters. In real mode, the utility does not open positions. Parameters magic - magic number. If less than 0, positions with any magic number are tracked. only_this_symbol - only chart symbol. If false , posi
FREE
Expert Advisor Description - Basically, EA will open position in case of cross between main line and signal line on stochastic. - Unique to this EA, using the two pre-set stochastic so that the EA can open the trade position. - The first stochastic determines the cross, while the second stochastic determines the overbought or oversold levels.
Parameters Description - Volume_Lot => Number of lots determined from the balance percentage. Example Balance = 1.000 USD, Volume Lot = 100, Then lot

Expert Advisor Description Strategy using two classic indicators in MetaTrader, stochastic oscillator and moving average Accompanied by multi timeframe and parameter that can be changed according to the strategy that suits you
Feature Money Management : Stop Loss, Take Profit, Trailing Stop Trading Option : Stochastic Oscillator, two Moving Average, Multi Timeframes https://youtu.be/3dXAUUnxg1s
youtubeembedcode.com/pl/ http://add-link-exchange.com
KT Murrey Math robot incorporates a trading strategy that explicitly trades the price bars that crossed above or below a Murrey Math level. Entries: A buy order is placed when a bar closes above a Murrey Math level. A sell order is placed when a bar closes below a Murrey math level. Exits: EA places the stop-loss and take-profit always at the subsequent Murrey Math levels.
MT4 Version is available here https://www.mql5.com/en/market/product/45404
Features
This EA combines a simple Murrey

Version 1.14 incorporates some significant changes compared to all previous versions. Additionally, this robot has been designed in a new manner, focusing on minimal adjustable inputs because I personally advocate simplicity within the complexity of anything. Hence, a minimalist user interface has been implemented without compromising performance. This robot also has its version for the MT4 platform, which will be released soon. What can you expect from this robot? Well, I've been hard at work,

This indicator is based on the ICCI.
If a long pattern is detected, the indicator displays a buy arrow.
If a short pattern is detected, the indicator displays a sell arrow. Settings
CCI Period - default set to (14) Features
Works on all currency pairs and timeframes
Draws Arrows on chart Colors
Line Color
Line Width
Line Style
Arrow Color This tool can help you analyse the market and indicates market entry.

Backtest from 2015-2019 MetaQuotes Data Every Tick Mode.
Start depo 10000 USD Lot size: 0,5 (You can modify it but maintain the ratio)
EA created for EURUSD M15
Open transaction based on RVI + Momentum + MA Crossover
Close transaction based on Stochastic
The parameters of indicators have been optimized.
Change manually only lot size.
EA does one transaction at the time.
No adding position, no martingale, no grid.
To avoid risky situations.
Fell free to increase lot size

가격 수준 분석, 고급 통계, TakeProfit 계산 및 3가지 유형의 알림. 이익: 결과를 다시 그리지 마십시오 촛불이 닫힐 때 엄격하게 신호를 보냅니다. 거짓 고장 필터링 알고리즘 어떤 트렌드 전략과도 잘 어울립니다. 모든 도구 및 시계열에서 작동 매뉴얼 및 지침 -> HERE / 문제 해결 -> HERE / MT4 버전 -> HERE 지표로 거래하는 방법 AW Breakout Catcher와 거래하는 간단한 3단계: 1단계 - 포지션 열기 70% 이상의 성공률로 매수 신호를 받았습니다. 2단계 - StopLoss 결정 반대 신호로 트렁크 선택 3단계 - 이익 실현 전략 정의 전략 1: TP1 도달 시 전체 포지션 청산 전략 2: TP1 도달 시 포지션의 50% 청산 및 TP2 도달 시 나머지 50% 청산 전략 3: 반대 신호에서 전체 포지션 청산 통계 모듈 더 나은 쌍 선택을 위해 내장된 통계 계산을 사용하십시오. 거래 계산 - 통계가 제공되는 총 신호 수

The most advanced news filter and drawdown limiter on MQL market NEW: Take a Break can be backtested against your account history! Check the " What's new " tab for details. Take a Break has evolved from a once simple news filter to a full-fledged account protection tool. It pauses any other EA during potentially unfavorable market conditions and will continue trading when the noise is over. Typical use cases: Stop trading during news/high volatility (+ close my trades before). Stop trading when

The adviser was developed according to the 2TF strategy for EURUSD and GBPUSD. Indicators used: EMA (5), EMA (10), ADX (28), MACD (5; 10; 4).
Rules for Buy Orders EMA (Fast) crossed EMA (Slow) from the bottom up. ADX + DI (blue) above –DI (red). MACD is above zero.
Rules for Sell Orders EMA (Fast) crossed EMA (Slow) from top to bottom. ADX + DI (blue) below –DI (red). MACD is below zero. In the parameters of the adviser, you can change various strategy settings, indicator periods, size and m
FREE

Attention: New update - 4 major practicality improvements!
1) Alarm 2) Midas text value 3) Click panel 4) Can be connected to an EA to operate in semi-automatic mode
Attention - This indicator does not work perfectly in backtest due to MT5 peculiarities (Reading hotkeys or panel clicks) . My suggestion is that you test Automatic Vwap Midas which has automatic operation to analyze the calculation and then buy Start if you think the indicator will match your operating.
This indicator i

Color Levels - удобный инструмент для тех, кто использует технический анализ с использованием таких инструментов, как Трендовая линия и Прямоугольник. Имеется возможность настройки двух пустых прямоугольников, трех закрашенных и двух трендовых линий. Настройки индикатора крайне просты и делятся на пронумерованные блоки: С цифрами 1 и 2 вначале - настройки пустых прямоугольников (рамок); С цифрами 3, 4 и 5 - настройки закрашенных прямоугольников; С цифрами 6 и 7 - настройки трендовых линий. Объ

The Market Momentum indicator is based on the Volume Zone Oscillator (VZO), presented by Waleed Aly Khalil in the 2009 edition of the International Federation of Technical Analysts journal, and presents a fresh view of this market valuable data that is oftenly misunderstood and neglected: VOLUME. With this new approach of "seeing" Volume data, traders can infer more properly market behavior and increase their odds in a winning trade.
"The VZO is a leading volume oscillator; its basic usefulnes
FREE

The Rise of Skywalker: It is an advanced trading system. This is a fully automatic Expert Advisor, which allows you to presize the trade according to the preferences of the trader. Is a revolution in the customization of the trading. The Rise of Skywalker is a expert advisor based in the indicator The Rise of Sky walker: ( https://www.mql5.com/es/market/product/44534 ) This system uses only one trade in each operation. Do not use Grip or martingale Low risk system since it h

Panthers Traders presents the new Expert Advisor "MRK TRADER", a robot for Forex, Indices, Commodities and Cryptocurrencies. This expert advisor works hedge strategies, has different variables to configure each other, works as a work tool or as a 100% automatic expert advisor, if you do not have experience, for your greater profitability, get in touch by private and I will explain your different variables and how to apply them in different assets, I recommend watching the videos of the YouTub

Just $10 for six months!!!. This will draw Order Blocks just by clicking on a candle with different colors for different time frames. It will use the body or the wicks. It can also draw the mean threshold of the candle open/close or high/low.
As a drawing tool, it is not active all the time after adding it to the chart.
Activate by pressing 'b' twice on the keyboard within a second. If activated but then decided not to draw, deactivate by pressing 'b' once. Box color depends if candle is a

1. Why did I develop this series of indicators
I found that most traders need to use multiple time frame indicators. They usually switch time frame to see indicators. However, once the timeframe is switched, you cannot see the corresponding relationship between the price in the smaller timeframe and the indicator in the larger timeframe . For example: if your price chart is in H1 timeframe, you can see H4, D1 and W1 indicators in H1 timeframe Chart. This is more helpful for you to find t

The Display N Bars utility is a simple tool designed to help identify candles.
If a trader tries to share knowledge with a colleague but it is difficult to pinpoint exactly the desired candle, just say the corresponding candle number.
The candle count is reset every day.
Seeking to offer a good customization the inputs are:
Display type -> Display only odd, only odd, or both candles?
Direction -> Horizontal or Vertical?
Display multiples of: (display frequency) -> Displa
FREE

Dynamic Indicator --> YKL_DinDX Dynamic Indicator that creates a Band based on the distance from moving average specified by the user. The indicator considers the period entered by the user in order to calculate the average distance from moving average, creating an upper band and a lower band. This indicator is utilized by EA YKL_Scalper, version 2.0 or superior.
FREE

1. Why did I develop this series of indicators
I found that most traders need to use multiple time frame indicators. They usually switch time frame to see indicators. However, once the timeframe is switched, you cannot see the corresponding relationship between the price in the smaller timeframe and the indicator in the larger timeframe . For example: if your price chart is in H1 timeframe, you can see H4, D1 and W1 indicators in H1 timeframe Chart. This is more helpful for you to find t
FREE

1. Why did I develop this series of indicators
I found that most traders need to use multiple time frame indicators. They usually switch time frame to see indicators. However, once the timeframe is switched, you cannot see the corresponding relationship between the price in the smaller timeframe and the indicator in the larger timeframe . For example: if your price chart is in H1 timeframe, you can see H4, D1 and W1 indicators in H1 timeframe Chart. This is more helpful for you to find t



Just $10 for six months!!!. This will draw Supply & Demand zones just by clicking on a candle. It can also draw a 50% line on the zone. https://youtu.be/XeO_x7cpx8g As a drawing tool, it is not active all the time after adding it to the chart.
Activate by pressing 's' twice on the keyboard within a second. If activated but then decided not to draw, deactivate by pressing 's' once. Box color depends if candle is above or below current price.
Features: Draw the box up to the last current can

1. Why did I develop this series of indicators
I found that most traders need to use multiple time frame indicators. They usually switch time frame to see indicators. However, once the timeframe is switched, you cannot see the corresponding relationship between the price in the smaller timeframe and the indicator in the larger timeframe . For example: if your price chart is in H1 timeframe, you can see H4, D1 and W1 indicators in H1 timeframe Chart. This is more helpful for you to find t
MetaTrader 마켓은 과거 데이터를 이용한 테스트 및 최적화를 위해 무료 데모 거래 로봇을 다운로드할 수 있는 유일한 스토어입니다.
어플리케이션의 개요와 다른 고객의 리뷰를 읽어보시고 터미널에 바로 다운로드하신 다음 구매 전 트레이딩 로봇을 테스트해보시기 바랍니다. 오직 MetaTrader 마켓에서만 무료로 애플리케이션을 테스트할 수 있습니다.
트레이딩 기회를 놓치고 있어요:
- 무료 트레이딩 앱
- 복사용 8,000 이상의 시그널
- 금융 시장 개척을 위한 경제 뉴스
등록
로그인
계정이 없으시면, 가입하십시오
MQL5.com 웹사이트에 로그인을 하기 위해 쿠키를 허용하십시오.
브라우저에서 필요한 설정을 활성화하시지 않으면, 로그인할 수 없습니다.