MetaTrader 5용 새 Expert Advisor 및 지표 - 104

Индикатор iVeles_Perfect_Oscilator является опережающим и одним из самых лучших осциляторов на сегодняшний день, использует специализированный расчет текущих цен графика. Очень качественно и своевременно показывает смену направления, очень точный подход к уровням перекупленности и перепроданности, что позволяет своевременно принять решение по сделке. Работает качественно на любом ТФ и с любым инструментом. Параметры: Period - период расчетов Average - усреднение МА Method - применяемый мето

В основу алгоритма этого трендового индикатора положен анализ веера сигнальных линий универсального мувинга I . Алгоритм вычисления сигнальных линий выглядит следующим образом. В качестве исходных данных имеем входные параметры индикатора: StartLength - минимальное стартовое значение первой сигнальной линии; Step - шаг изменения периода; StepsTotal - количество изменений периода. Любое значение периода из множества сигнальных линий вычисляется по формуле арифметической прогрессии: SignalPeriod(

Zigzag Indicator For RSI, To easily identify the highs and lows of the rsi signal. It is easier to observe divergent and convergent signals. Default setting: InpRsi =14 //Rsi Period InpDepth =12; // Depth InpDeviation =5; // Deviation InpBackstep =3; // Back Step
If you want open Exness account try this link : https://one.exness-track.com/a/teg5teg5 Dev buy taphu: Ha Van Tan - hatatrata - Trader's profile - MQL5 community Email: tan.ha@outlook.com
FREE
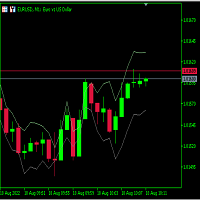
Just learning how to create an indicator from this tutorial .
its just a garbage text to fill the descriptions. Hello there. Hello there Hello there Hello there Hello there Hello there Hello there Hello there Hello there Hello there Hello there Hello there Hello there Hello there Hello there Hello there Hello there Hello there Hello there Hello there Hello there
FREE

The FX Stewards EA Signals Alert Financials Indicator works with every trading instrument(if used on synthetics, performance will not be optimum). Do not use on synthetics. Synthetics are not affected by fundamental analysis. The signals indicator assists with choosing which instrument to trade and the direction to take(follow the trend - the trend is your friend), making it easer for you to enter, re-enter or exit a trade with confidence(you're, however, still required to confirm entry before e

Wink IND is an indicator that tell you: -when MACD is saying buy or sell -when RSI is saying buy or sell -work on multi timeframes MT4 Version
by Wink IND: you don't need to have Knowledge about MACD or RSI don't need to check and compare MACD and RSI respectly don't need to check all of timeframes and compare the resaults don't lose time, save more time for your decisions in trading
Wink IND: multi timeframe indicator multi currency indicator show the positions by graphic shapes, arrows an

** All Symbols x All Timeframes scan just by pressing scanner button ** *** Contact me to send you instruction and add you in "123 scanner group" for sharing or seeing experiences with other users. After 17 years of experience in the markets and programming, Winner indicator is ready. I would like to share with you! Introduction The 123 Pattern Scanner indicator with a special enhanced algorithm is a very repetitive common pattern finder with a high success rate . Interestingly, this Winner in

The indicator very accurately determines the levels of the possible end of the trend and profit fixing. The method of determining levels is based on the ideas of W.D.Gann, using an algorithm developed by his follower Kirill Borovsky. Extremely high reliability of reaching levels (according to K. Borovsky - 80-90%) Indispensable for any trading strategy – every trader needs to determine the exit point from the market! Precisely determines targets on any timeframes and any instruments (forex, met

Circadian은 세 가지 통화 쌍 간의 가격 상관 관계를 사용하여 작동하는 삼각형 차익거래 전문 자문입니다.
전문가는 한 번에 세 쌍을 거래하며, 이들은 한 세트로 그룹화됩니다. 세트는 사용자 정의 순열 계산기를 사용하여 찾거나 기본 선택에서 선택됩니다.
동기화된 재정 거래 기회를 검색하기 위해 각 세트에 대해 1분 20초가 할당됩니다. 일단 유효한 신호가 발견되면 세트가 잠기고 3개의 거래가 열립니다.
알고리즘에는 세트의 모든 쌍을 자동으로 관리하는 동적 이익실현 및 바스켓 청산 논리가 장착되어 있습니다.
신호 및 그룹 채팅: https://www.mql5.com/en/users/conorstephenson 전문가 개념에 대한 자세한 설명과 각 입력에 대한 설명은 사용자 가이드를 확인하세요. 설정 조언과 무료 전문가 조언을 받으려면 구매 후 저에게 연락하세요! 제 제품은 MQL5에서만 판매하고 있는 제품인데, 다른 곳에서 이 제품을
Elan: MT5 및 MT4에서 거래 경험을 향상시키세요 MT5 또는 MT4에서 거래 효율성을 높이고 시간을 최대한 활용하고 싶으신가요? Elan을 확인해보세요. Elan은 거래 경험을 최적화하고 간소화하기 위해 설계된 강력한 거래 보조 도구입니다. Elan은 거래 필요를 지원하는 포괄적인 기능 세트를 제공합니다: 포지션 관리 : 시각적인 청산 옵션을 통해 포지션을 쉽게 관리하고, 현재 주문의 수익을 한눈에 확인할 수 있습니다. 수익 및 손실 통계 : 다양한 거래 기간에 걸친 수익 및 손실에 대한 상세 통계로 거래 성과를 추적합니다. 정확한 데이터에 기반하여 정보에 입각한 결정을 내리세요. 주문 관리 : 활성 및 대기 중인 주문을 모니터링하여 거래를 조직적으로 유지하고 주문이 누락되지 않도록 합니다. 시장 정보 : 다양한 금융 상품의 실시간 시장 동향 및 가격 변동에 대한 정보를 업데이트하여 더 나은 거래 결정을 내릴 수 있도록 합니다. 계좌 정보 : 계좌 데이터와 플랫폼 상태를

UR 모멘터
UR Momenter는 오실레이터로 표현되는 가격 움직임의 소진과 상관 관계에서 가격의 모멘텀을 완벽하게 계산합니다. 따라서 이는 잠재적 반전 또는 되돌림의 초기 신호를 제공합니다. 이 공식은 2018년 시장 거품이 꺼진 후 발견되었습니다.
UR Momenter 사용의 장점 :
매개변수 없음 가격 움직임을 설명하는 2개의 선이 있습니다. 흰색 선은 오실레이터로 표시되는 가격의 이동 평균 편차와 상관관계가 있는 가격의 모멘텀입니다(파란색 선). 히스토그램은 가격 모멘텀의 맥락에서 최대 편차를 시각화한 것입니다. 인터페이스는 양쪽 극단(빨간색 상단 및 녹색 하단 영역)에서 어느 한 라인의 소진을 보여줍니다. 최고의 장점: 쉽고 모든 자산에 맞게 조정됩니다. 도구 업데이트를 최신 상태로 유지하고 빠진 것이 있다고 생각되면 요청을 보낼 수 있는 특별한 텔레그램 채팅이 있습니다!
왜 UR 모멘터인가?
이 표시기는 독립 실행형, 진입 또는 종료 표시기로

숫자 시퀀스 중 하나를 "산불 시퀀스"라고 합니다. 가장 아름다운 새로운 시퀀스 중 하나로 인식되었습니다. 주요 특징은 이 시퀀스가 가장 짧은 경우에도 선형 추세를 피한다는 것입니다. 이 지표의 기초를 형성한 것은 이 속성입니다. 금융 시계열을 분석할 때 이 지표는 가능한 모든 추세 옵션을 거부하려고 합니다. 그리고 그가 실패하는 경우에만 그는 추세의 존재를 인식하고 적절한 신호를 제공합니다. 이 접근 방식을 통해 새로운 트렌드가 시작되는 순간을 정확하게 결정할 수 있습니다. 그러나 거짓 긍정도 가능합니다. 숫자를 줄이기 위해 이 표시기에 추가 필터가 추가되었습니다. 새 막대가 열리면 신호가 생성됩니다. 어떤 경우에도 다시 그리기가 발생하지 않습니다. 표시 매개변수: Applied Price - 적용된 가격 상수. Period Main - 표시기의 기본 기간, 유효한 값은 5 - 60 이내입니다. Period Additional - 추가 기간, 이 매개변수의 유효한

아치는 지표를 기반으로하며,그 수는 미래에 증가 할 것입니다. "후행 위치"및"단계 후행"과 함께"후행 정지"를 사용할 수 있습니다. 곱셈과 덧셈을 통해 손실을 내는 현재 트랜잭션의 볼륨을 증가시킬 수 있습니다. 수익성이 없는 거래보다 긍정적인 거래의 우위를 달성한 후,볼륨은 원래의 거래로 돌아갑니다.
아키베이스 설정:
매직 번호는 모든 오픈 거래의 고유 번호입니다. 주의!!! 고문은 역사와 함께 작동,그래서 당신은 이전의 것과 다른 고유 번호를 사용해야합니다
볼륨-열린 트랜잭션의 초기 볼륨
선택한 계수로 로트를 증가시키는 기호–볼륨을 증가시키는 기호
볼륨 증가 비율-볼륨이 증가 할 값
미끄러짐-거래를 열 때 가격 미끄러짐
이익을 취하십시오-포인트 단위로 원하는 이익
정지 손실-포인트의 손실에 도달 할 때 무역을 폐쇄
후행 활성제-후행 작업의 활성화
후행 정지-정지 손실이 전송되는 공개 거래에 현재 가격에서 포인트의 거리
후행 위치-정지 손

10부가 남았습니다 - 다음 가격은 $600입니다.
가격은 $2500에 도달할 때까지 인상됩니다.
선물을 받고 싶다면 구매 후 메시지를 보내주세요!
Bayraktar는 혁신적인 하룻밤 스캘핑 EA입니다.
Expert Advisor는 통화 쌍 거래를 위해 설계되었습니다.
매개변수 설명:
START_LOT - N 잔액 단위의 초기 로트(FROM_BALANCE). FROM_BALANCE = 0이면 고정 시작 로트가 사용됩니다. STOPLOSS_PCT - 최대 손실; TAKEPROFIT_PCT - 이익을 취하십시오. LOT_MULTIPLIER - 로트 승수; MAX_LOT - 최대 로트 STEP_ORDERS - 주문 사이의 거리. STEP_MULTIPLIER - 거리 승수. MAX_STEP - 최대 거리; MAX_ORDERS - 최대 주문 OVERLAP_PIPS - 중복 주문에 대한 포인트 수. MAGIC_NUMBER - 매직 넘버; ONE_AT

The Weis Wave Chart Forex for MT5 is a Price and Volume indicator. The Price and Volume reading was widely disseminated through Richard Demille Wyckoff based on the three laws created by him: Supply and Demand, Cause and Effect and Effort vs. Result. In 1900 R.Wyckoff already used the wave chart in his analyses. Many years later, around 1990, David Weis Automated R. Wyckoff's wave chart and today we bring you the evolution of David Weis' wave chart. It shows the amount of Volume and the amount o

The Weis Wave Chart for MT5 is a Price and Volume indicator. The Price and Volume reading was widely disseminated through Richard Demille Wyckoff based on the three laws created by him: Supply and Demand, Cause and Effect and Effort vs. Result. In 1900 R.Wyckoff already used the wave chart in his analyses. Many years later, around 1990, David Weis Automated R. Wyckoff's wave chart and today we bring you the evolution of David Weis' wave chart. It shows the amount of Volume and the amount of pips

** All Symbols x All Timeframes scan just by pressing scanner button ** ***Contact me to send you instruction and add you in "RSI scanner group" for sharing or seeing experiences with other users. Introduction RSI divergence is a main technique used to determine trend reversing when it’s time to sell or buy because prices are likely to drop or pick in the charts. The RSI Divergence indicator can help you locate the top and bottom of the market. This indicator finds Regular divergence for pullba

Trade any currency, crypto, cfd or stock in any timeframe depending on 2 moving averages , from scalping to position trading. All parameters and functions can be modified and de/activated in the settings, there's no hidden algorithm. The Universal Moving Average Expert Advisor ( UniMA EA ) trades a simple strategy that works well with dozens of profitable settings.
All backtest results shown in the screenshots below and tradet in the signals can be tested with the provided set files in the co

This indicator scans the 1-3 Trendline pattern . The indicator is a 100 % non repaint low risk breakout system . The patterns are formed around swing high and swing lows which make them a low risk pattern with high reward.
PATTERN BACKGROUND The 1-3 Trendline Breakout pattern is formed by four(4) points which are composed of three (3) primary points and the pattern neck. A trendline is always formed by the point 1 and the neck of the pattern . When price breaks out of the trendline formed ,
TRACKINGLEVELS (SUPPORTS AND RESISTANCES)
TrackingLevels is a useful indicator that saves considerable time when a trader starts analyzing a chart. This indicator draw on the chart all the resistances and supports that the market is creating. The resistance and support levels are very important, this levels define areas where there can be a considerable accumulation of sell or buy orders. These are a key areas that every trader must know and keep in mind all the time. This indicator helps the

The currency strength momentum has a lot of similarities with currency strength meter presented in the previous page, but the difference are much more pronounced. You can try putting both in the same chart and see the difference in results. Currency strength momentum measures strength of a currency based on (you guess it) it's momentum relative to other currencies, while currency strength meter measures the strength of a currency based on pips it has moved in a certain direction.
FREE

Drawdown Limit EA Prop Firm trading MT5
If you found this EA, it's probably because you want to get a funded account with a prop firm, but you see a rule that most of traders fear : Maximum Daily Drawdown. I've been through this problem myself as I'm a prop firm trader and I've made a bot to solve this rule, and you can get it to solve this problem too.
How does it work ?
When you first setup this EA, you need to input the initial deposit which corresponds to the size of your funded accoun

TIO Oracle - это полностью автоматизированная торговая система, основными принципами которой является анализ лишь Price Action. Торговля ведётся по уровням перекупленности и перепроданности . Торговля к возврату средней цены. Советник имеет универсальные настройки под 10 валютных пар. Это означает, что не было подгона под историю каждой пары, а работает универсальная неэффективность рынка. Кто давно занимается разработкой Торговый Систем, тот знает как легко можно подогнать каждую пару под и
Hello friends. I wrote this utility specifically for use in my profile with a large number of Expert Advisors and sets ("Joint_profiles_from_grid_sets" https://www.mql5.com/en/blogs/post/747929 ). Now, in order to limit losses on the account, there is no need to change the "Close_positions_at_percentage_of_loss" parameter on each chart. Just open one additional chart, attach this utility and set the desired percentage for closing all trades on the account. The utility has the following fu
FREE

Balance Weighted Moving Hedge System- is the trend following manual system for forex/crypto market. Indicator represents custom balance-weighted moving average indicator. The main advantagies : very stable moving with really early signals, defines current trend power, ignores market noise. The more width of indicator line - the more expressive trend is. On the other hand thin moving line shows unstable / choppy market. Indicator can be used as single b alance weighted moving or with hedge strate

LAZY TRADER MT5
LIVE SIGNAL - CLICK HERE
SETTING FILES FROM LIVE SIGNAL - CLICK HERE
PRICE WILL INCREASE EVERY 1 TO 2 WEEKS. GETTING IT EARLY GETS YOU THE BEST PRICE.
Lazy Trader was designed to do all of the complex trading for you, so you can you relax on your couch, or sleep the night away. There is no reason to learn how to trade Forex when using Lazy Trader.
YOU DO NEED TO UNDERSTAND RISK AND MONEY MANAGEMENT HOWEVER...... Ok to Be Lazy and Smart, but PLEASE not Lazy a
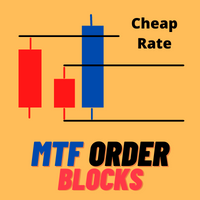
30% OFF ONLY 10 COPIES HURRY UP! 8 LEFT COPIES Very precise patterns to detect High Accurate Order Blocks: It Draw zone after market Structure Breakout with a high Accuracy, institutional orders with the potential to change the price’s direction and keep moving towards it, have been placed. Features Auto Order Blocks Draw MTF Order Blocks Double Signal One Alert Signal Second Long Wick Rejection Signal Market Structure BOS LINE How to show MTF order Block Go on indicator setting at the en

Hello;
This indicator provides input and output signals of real volume levels with some mathematical calculations. It is simple and safe to use. As a result of the intersection of real volume levels with averages, it creates buy and count signals.
Indicator parameter descriptions:
A-PERIOD: Indicates the number of bars to be calculated.
B-GAMMA: A fixed Fibonacci trend average of 0.618 is used.
Use C-VOLUME TYPE:Tick volume as a constant.
D-HIGH LEVEL 2: Represents the level of the

This product generates signals at closing bars thanks to channel scaling. It visualizes these signals with an arrow. The color of the arrow indicates the direction of the trade. The default settings are valid for the H1 period. You can backtest for each period and product. The code content of the indicator has been applied in accordance with price movements as much as possible. For this reason, it detects trend beginnings and ends well.
Parameter descriptions:
PER: Indicates the number of b
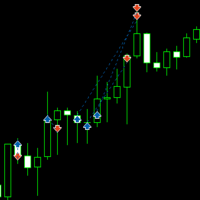
This robot is based on an MACD strategy for trending markets. The description of the strategy can be found on the attached youtube video. The video explains the strategy and shows a basic backtest and optimisation on a few symbols. It is advised to carry out a a backetst and optimisation of your own before using the robot. The video can be found at >> https://www.youtube.com/watch?v=wU_XCM_kV0Y  ;

This tool is useful for indicating resistance and support levels It bases on zone in setting to identify top/bottom of candles and and draw rectangle according to those resistance/support level Beside user can edit the zone via dialog on specific timeframe and that value will be saved and loaded automatically. User can determine what strong resistance and support and make the order reasonably.
FREE

Djin is an scalper designed for USDCHF H1/M15 (hedge account) . It doesn't use martingale. Always setup stoploss and takeprofit.
RECOMMENDATIONS :
- Recommended pair: USDCHF (hedge account)
- Recommended setting: USDCHF H1/M15 (hedge account)
- Recommended Lot: auto
- Minimum capital: 1000 USD (in this case a DD of 15/20% is possible, as the account is small)
- Minimum leverage: 1:100 or upper PARAMETERS: stoploss - stop loss in points takeprofit - take profit in points Trade

WHITE HORSE EA is a fully automated & customizable EA.
The EA's objective is to provide steady incomes with a high level of safeness .
FUNCTIONING :
The algorythm based on an auto-adaptive system, is constantly controlling the distance between orders.
The safeness is improved by 2 indicators : ADX and ATR
You can select your trading session ( Tokyo, London, New York)
You can select the news you want to trade (Low, medium or high impact)
STRATEGY:
- The curve
NEW: A Fully Automated strategy using price action and candle patterns to trade Gold (XAUUSD).
This EA can be used on any currency but recommended for XAUUSD, EURUSD and BTCUSD Safe stop loss option for FTMO and other funded accounts. REAL BACKTEST DATA - no manipulation or backtest conditioning like other EAs! 100% Modelling Quality Backtest! USE: Default settings on XAUUSD & XAUAUD on the M15 timeframe. Use ECN account for best results.
MAIN SETTINGS Setting Value Description
Automatic Expert Advisor. Night scalp system, with trend detection and pullback entry. Dynamic exit signal, for SL or TP. Every trade has fix SL. No usage of risky strategies like martingale, hedge, grid etc.
About EA Scalper strategy Technical strategy Can use with small deposits Pairs with best rezults: AUDNZD, AUDCAD, AUDCHF, EURAUD, GBPAUD, USDCHF, CADCHF, EURNZD, EURGBP, GBPCAD, GBPCHF, EURCHF Time Frame: M15 Recommendations Broker account with ECN and low spread Test it first to find out
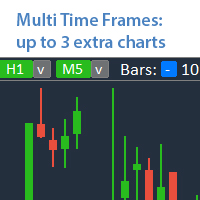
Analyze up to 3 additional charts of other timeframes , without switching the main chart. My #1 Utility : includes 65+ functions | Contact me if you have any questions The indicator opens in a separate window: The window can be moved to any place on the chart (using the [<M>] button). The window can also be minimized to save space ( [ <^>] button) In the window that appears, you can configure: The period of the 1st chart (left);
The period of the 2nd chart (center); The peri

GM Bounty Hunter MT5 is a fully automated/semi-automatic, The robot trades according to the overbought and oversold levels of the market. The EA's unique trading strategy has a high probability of winning. GM Bounty Hunter MT5 is optimized for use with low spread currency pairs. Info:
Working symbol XAUUSD, EURUSD, GBPUSD, USDJPY,.... Working Timeframe: M1, .....(The larger the timeframe, the more stable the signal) Min deposit $125 with Stop Loss settings (or equivalent in cents ) The minimu

В основе индикатора EasyBands лежит тот же принцип, что и при построении Bollinger Band. Однако, данная модификация индикатора использует вместо стандартного отклонения средний торговый диапазон (Average True Range). Соответственно, с данныи индикатором абсолютно аналогично можно использовать все стратегии, которые применяются с Bollinger Band. В данной версии индикатора используется двенадцать уровней и средняя линия (белый цвет). Индикация тренда выполнена в виде окраски свечей в зависимости
A technical Indicator Providing Price Convergence Signals along with value for experienced and professional traders. Easy to comprehend, Easy to understand.
This is a helping tool provides best signals. This indicator is designed based on the fundamentals of trade. A very good indicator you can customized its color. A best tool to find trade direction.
An adaptive indicator. It constantly adapts to the trade.

A value indicator for experienced and professional traders. It is helping tool to indicate the direction value gain. A best helping tool to trade value. This indicator is equipped with a colored line and a digital tool to indicate value numerically .
This indicator also helps to indicate value during trends. A study based on this indicator shows value of trade significantly changes during trends best tool to cash the trends.

Best helping tool for Professional and Experienced traders. A best Tool To find the trend. Instruction Manual: First Select your desired Symbol. Then attach this tool and wait till it identify the trend for you. Then it will be more feasible to trade.
Once again best tool to trade. Demo version is available you can fully test its functionality. More importantly there are always trend breaks Once Trend break is observed un-attach this tool and then re-attach to get the fresh trend. Precautions
A basic tool for traders to trade percentile of the value. It indicates both values in the for of digits appeared on the left corner of the screen.
Instructions Manual : First choose your desired symbol and then select this tool. Please be remined that this tool is just a helping tool. its upon trader what he chooses. The function of this tool is just to provide a help in trading.

OPTIMIZE For settings. SL and TP should Start with 50000 Important to get the optimization before backrest and use. I optimized on the last month option in the strategy tester. BTC Miner was build for trading BTCUSD on 1 hour time frames. About the EA and strategy: It uses ADX and Envelopes to enter trades and uses Momentum and Moving Average crossovers for exits. There is a fixed lot size and all trades have a SL and TP. The EA does not use martingale or hedging as its strategy, it is based

Две простых симметричных пробойных трендовых системы для лонгов и шортов, которые работают абсолютно независимо друг от друга. В основе алгоритма открытия позиций пробой ценой по тренду мувинга, сдвинутого по вертикали на фиксированное в настройках эксперта количество пунктов. Входные параметры эксперта разбиты на две большие группы: Для лонгов с префиксом "L";
Для шортов с префиксом "S". Поскольку в данном эксперте две торговые системы, то оптимизировать и тестировать их сперва следует отдель

Nade com os grandes ou evite-os a todo custo. Com esse indicador, a escolha é sua! Indicador por coloração de barras, com respostas simples se os "grandes" estão negociando ou não. Saiba quando agir se o mercado está calmo ou agitado, de forma simples, pelo valor de retorno do indicador ou pela aparência das barras.
Indispensável indicador para a construção do seu robô ou para seu setup. Resultado do Indicador: 0 - 5. Participantes do mercado: 0 e 1 = Big Players! 2 e 3 = Dia normal. 4 e 5 = M

EA介绍 :Stable Grid是一款中长期全自动化的交易顾问,放弃大起大落 只追求大概率稳定的细水长流。 资金门槛 :使用该EA的资金门槛稍微比较高,具体内容看配置介绍。 类型 :中长线EA策略
优点 :较为稳定、全自动
缺点 : 1.面对超大单边行情略显恐惧,若不是超大单边那也不屑一顾。 2.获利周期较长,对于短线交易者的心理造成焦虑感!
止损:每张订单都不设置止损,然而止损按照策略来执行。 止盈:按照固定点数来执行。
风险管理 :任何策略都不是最重要的,风险管理才是最重要的!本EA使用了复利模型,严格控制了仓位比例。
配置介绍 :必须严格按照推荐的配置来执行。 周期推荐:30分钟 货币推荐:美瑞
杠杆推荐:1:100-200 最低余额:$10000
要求 : 1.EA需要良好的经纪条件,平台最好是低点差低滑点,网络最好保持稳定。 注意 : 2.当使用EA 专家建立头寸之后,使用的连续性也是需要严格遵守,除了非交易日之外都应当挂上EA。举例:假设一年有365天,然而外汇市场一年的交易日仅为240天,在这240天内都应该连续使用EA!
EA测试 :

모멘텀 반전은 가격 변동 및 바 형성의 강도 분석을 기반으로 가능한 반전 포인트 및 보정의 시작을 감지하기위한 강력한 도구입니다.
_________________________________
지시자 신호를 이용하는 방법:
표시기는 새로운 가격 표시 줄이 나타난 후 신호를 생성합니다. 가격이 지정된 방향으로 임계점을 돌파한 후 생성된 신호를 사용하는 것이 좋습니다. 표시기는 신호를 다시 그리지 않습니다.
_________________________________
표시기 매개 변수는 신호 화살표의 표시 스타일을 변경하는 것이 좋습니다. 계산에 사용되는 매개 변수를 변경하는 것은 제공되지 않습니다-이 내 제품의 철학 때문이다:안정성과 객관성.
_________________________________
귀하의 질문 및 제안을 환영하며 비공개 메시지로 보낼 수 있습니다
_________________________________
시장을 정복에 관심있는 모
FREE

관성 포인트는 가격 변동의 관성을 계산하는 아이디어를 기반으로 가격 움직임의 중요한 포인트를 검출하기위한 강력한 도구입니다.
_________________________________
지시자 신호를 이용하는 방법:
표시기는 새로운 가격 표시 줄이 나타난 후 신호를 생성합니다. 가격이 지정된 방향으로 임계점을 돌파한 후 생성된 신호를 사용하는 것이 좋습니다. 표시기는 신호를 다시 그리지 않습니다.
_________________________________
표시기 매개 변수는 신호 화살표의 표시 스타일을 변경하는 것이 좋습니다. 계산에 사용되는 매개 변수를 변경하는 것은 제공되지 않습니다-이 내 제품의 철학 때문이다:안정성과 객관성.
_________________________________
귀하의 질문 및 제안을 환영하며 비공개 메시지로 보낼 수 있습니다
_________________________________
시장을 정복에 관심있는 모든
FREE

가속 포인트는 가격 변동의 가속을 계산하는 아이디어를 기반으로 가격 움직임의 중요한 포인트를 검출하기위한 강력한 도구입니다.
_________________________________
지시자 신호를 이용하는 방법:
표시기는 새로운 가격 표시 줄이 나타난 후 신호를 생성합니다. 가격이 지정된 방향으로 임계점을 돌파한 후 생성된 신호를 사용하는 것이 좋습니다. 표시기는 신호를 다시 그리지 않습니다.
_________________________________
표시기 매개 변수는 신호 화살표의 표시 스타일을 변경하는 것이 좋습니다. 계산에 사용되는 매개 변수를 변경하는 것은 제공되지 않습니다-이 내 제품의 철학 때문이다:안정성과 객관성.
_________________________________
귀하의 질문 및 제안을 환영하며 비공개 메시지로 보낼 수 있습니다
_________________________________
시장을 정복에 관심있는 모든
FREE

보정 돌파구는 가격 형성의 분석과 가격 움직임의 관성에 따라 보정 또는 거래 회랑에서 가능한 브레이크 아웃 포인트를 검출하기위한 강력한 도구입니다.
_________________________________
지시자 신호를 이용하는 방법:
표시기는 현재 가격 표시 줄 동안 신호를 생성합니다. 이 신호 화살표 위/아래 신호 막대를 닫은 후 생성 된 신호를 사용하는 것이 좋습니다. 표시기는 신호를 다시 그리지 않습니다.
_________________________________
표시기 매개 변수는 신호 화살표의 표시 스타일을 변경하는 것이 좋습니다. 계산에 사용되는 매개 변수를 변경하는 것은 제공되지 않습니다-이 내 제품의 철학 때문이다:안정성과 객관성.
_________________________________
귀하의 질문 및 제안을 환영하며 비공개 메시지로 보낼 수 있습니다
_________________________________
시장을 정
FREE

시장 팔레트는 관성 및 가격 변동의 가속을 기반으로 거래 결정을 필터링하기위한 강력한 도구입니다.
_________________________________
지시자 신호를 이용하는 방법:
표시기는 세 가지 색상의 히스토그램 신호를 생성합니다. 표준 색 구성표에서 파란색 열이 나타날 때 긴 포지션 만 유지하고 빨간색 열이 나타날 때 짧은 포지션 만 유지하고 회색 열이 나타날 때 거래 행동을 삼가하는 것이 좋습니다. 더 높은 열의 모양은 가격 움직임의 임계점의 형성을 의미합니다-열의 색상을 변경할 확률이 높습니다.
_________________________________
표시기 매개 변수는 히스토그램 표시 스타일을 변경하는 것이 좋습니다. 계산에 사용되는 매개 변수를 변경하는 것은 제공되지 않습니다-이 내 제품의 철학 때문이다:안정성과 객관성.
_________________________________
귀하의 질문 및 제안을 환영하며 비공개 메시지로 보
FREE

유로/달러 통화 쌍뿐만 아니라 거래에 대한 간단한 전문가 고문
에 의해 구동 벅스 에아 엔진 https://www.mql5.com/en/market/product/82887
선택.:1 (OPT.VER: S1)
신호 생성을위한 최적의 표시기 세트 신호에 대한 거래 열기/닫기/신호 없음,주문 보류 마틴 모드(동적 마틴 포함) 가상 후행 정지(브로커에 표시되지 않음)
전략 테스터를 사용하여 거래 전략을 테스트하고 최적화하십시오
필요한 모든 정보는 자주 묻는 질문에 있습니다. https://docs.google.com/document/d/1mIEhAeDSlmc5OtgwMSnlw7HSDK0Yvjk_1H36rMX7QZU/edit?usp=sharing
유로/달러 통화 쌍뿐만 아니라 거래에 대한 간단한 전문가 고문
벅스 솔로의 라이트 버전 https://www.mql5.com/ru/market/product/84862
에 의해 구동 벅스 에아 엔진 https://www.mql5.com/en/market/product/82887
선택.:1 (OPT.VER: S1)
신호 생성을위한 최적의 표시기 세트 신호에 대한 거래 열기/닫기/신호 없음,주문 보류 마틴 모드 가상 후행 정지(브로커에 표시되지 않음)
전략 테스터를 사용하여 거래 전략을 테스트하고 최적화하십시오
필요한 모든 정보는 자주 묻는 질문에 있습니다. https://docs.google.com/document/d/1mIEhAeDSlmc5OtgwMSnlw7HSDK0Yvjk_1H36rMX7QZU/edit?usp=sharing

현재 주요 시장 세션과 다음 시작까지 남은 시간을 표시합니다.
시장
뉴욕 런던 프랑크푸르트 도쿄 시드니 맞춤 이름, 시작 및 종료 시간이 포함된 추가 세션 1개
시계 시간
GMT/UTC 로컬(컴퓨터에서) 브로커(서버 시간) 설정의 기본 시간은 GMT입니다. 로컬 또는 브로커 시간으로 변경한 후 선택한 시간 유형에 따라 각 세션 시작 및 종료 시간을 수동으로 조정해야 합니다. 개장 및 폐장 시간을 조정할 수 있습니다
그래픽 설정 각 세션을 개별적으로 표시하거나 숨길 수 있습니다. 여기에는 다음이 포함됩니다. 오픈 바의 세션 이름 세션이 종료될 때까지 그리는 시가 라인 배경색 세션 배경색에는 2가지 모드가 있습니다
분리자로 유용한 첫 번째 막대 열린 시간부터 닫은 시간까지 전체 세션 기간
* 겹침이 있는 경우 세션 색상이 혼합됩니다. 이렇게 하면 차트에 새로운 특정 색상이 생성되며, 소원은 과거 데이터에서 쉽게 겹치는 부분을 찾는 데 유용합니다. * 차트에 함께 그려
FREE
Demo version of the Virtual SL TP Trailing product for testing all functions https://www.mql5.com/ru/market/product/75210
ВНИМАНИЕ: ТОЛЬКО ДЛЯ ДЕМО-СЧЕТОВ !!!
Make Trailing Stop, Take Profit, Breakeven, Stop Loss levels invisible to the broker!
HIDDEN MODE (STEALTH MODE) Virtual Trailing Stop (Virtual Trailing Stop) Virtual Take Profit (Virtual Take Profit) Virtual Breakeven (Virtual Breakeven) Virtual Stop Loss (Virtual Stop Loss) Виртуальный 2-уровневый Трейлинг-стоп Virtual
FREE

MartexMT5 is a moderately aggressive EA working on a martingale strategy with hedge. The EA independently monitors the risk and, if the risk is high, takes measures to exit the market with a minimum profit. In the hedging mode, the EA independently leaves the "lock" with a profit. A complete guide to the MartexMT5 EA can be found in the "Comments" section. Benefits automatic magic number, individual for each currency pair; automatic breakeven and automatic trailing stop; at high risk, reducing t
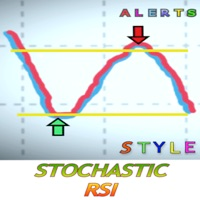
확률 적 RSI 란 무엇입니까?
확률 적 RSI ( StochRSI )은 일부 차트 플랫폼 (에서 0과 1 ) 또는 0과 100 사이의 기술 분석에 사용되는 지표이며 확률 적 발진기를 적용하여 생성됩니다 표준 가격 데이터가 아닌 상대 강도 지수 ( RSI ) 값 세트에 대한 공식. 이 버전에는 실제로 좋은 기회를 놓치지 않도록 경고가 포함되어 있습니다. 신호 구매 주문 또는 신호 판매 주문을 받으려면 매개 변수를 설정합니다. 신호를 받으려면 MetaQuotes ID를 통해 데스크탑 버전을 Metatrader 앱과 연결해야합니다. MetaQuotes ID는 MT4 / 5 앱에서 > > 채팅 및 메시지 설정에 있습니다. 바탕 화면에 도구 > > > 옵션 > > 알림이 있습니다. 바탕 화면 버전에 ID를 입력하고 활성 알림을 표시하면 바로 사용할 수 있습니다.
MT4버전을 사용해보십시오
스타일이 중요하기 때문에
촛불의 색, 배경을 밝거나 어둡게 변경하고 그리드를 넣거나

마틴게일. "Oberon iSAR MT5" 는 15개의 개별 블록(mini Expert Advisors)으로 구성되어 이익을 합산하고 시간이 지남에 따라 손실을 분배합니다.
특징: 각 문자에 대한 개별 입력 데이터입니다. 기호는 반복될 수 있습니다(15개의 동일한 기호라도 서로 별도로 거래됩니다). 하나의 거래 계정에 다른 설정으로 여러 "Oberon_iSAR_MT5"를 설치할 수 있습니다(조건: Magic[i+1]>Magic[i]+15). 하나의 차트에 설치됩니다. 소프트웨어의 성능이 낮으면 "Every_tick_based_on_real_tick" 모드(15개 기호 모두 활성화됨)에서 테스트하기 어렵거나 메모리 부족으로 인해 통화 쌍 호가 기록을 로드하는 동안 종료될 수 있습니다. 이 경우 입력 데이터("거래" 매개변수)의 문자 수를 줄이거나 테스트 기간을 단축할 수 있습니다. 그러나 가장 정확한 옵션은 더 강력한 가상 서버(VPS)를 임대하는 것입니다. 헤지 계정 유형. 4

M & W Pattern Pro is an advanced scanner for M and W patters , it uses extra filters to ensure scanned patterns are profitable.
The indicator can be used with all symbols and time frames.
The indicator is a non repaint indicator with accurate statistics calculations.
To use , simply scan the most profitable pair using the statistics dashboard accuracy , then enter trades on signal arrow and exit at the TP and SL levels.
STATISTICS : Accuracy 1 : This is the percentage of the times price hit

Flag Pattern pro is a Price Action (PA) analytical tool that scans the continuation patterns known as "Flag and Pennant Patterns" .
Flag and Pennant patterns are continuation patterns characterized by a move in a previous trend direction after a shallow retracement usually below 50% of the original move . Deep retracements can however be sometimes found at the 61.8 % levels. The original move is know as the flag pole and the retracement is called the flag.
Indicator Fun
This utility tool shows the ticker symbol, timeframe, and description information as a watermark on the chart. Text resizes automatically according to chart size. It is useful to identify the correct chart when multiple charts are shown on the screen. Want more control over text apperance? Check out our Chart Watermark MT5 Premium utility. See the demonstration video below!
Inputs: Font Size: Initial font size for the ticker symbol and timeframe text (Default; 50). Description text font siz
FREE

本指标 基于 Zigzag 基础上... 增加了: 1.增加了箭头指示,使图表更鲜明 2.增加了价格显示,使大家更清楚的看清价格. 3.增加了报警等设置,可以支持邮件发送 原指标特性: 1.基本的波段指标构型. 2.最近的2个ZIGZAG点不具有稳定性,随着行情而改变,(就是网友所说的未来函数) 3.原指标适合分析历史拐点,波段特性,对于价格波动有一定的指导性.
Zigzag的使用方法一 丈量一段行情的起点和终点 (1)用ZigZag标注的折点作为起点和终点之后,行情的走势方向就被确立了(空头趋势); (2)根据道氏理论的逻辑,行情会按照波峰浪谷的锯齿形运行,行情确立之后会走回撤行情,回撤的过程中ZigZag会再次形成折点,就是回撤点; (3)在回撤点选择机会进场,等待行情再次启动,止损可以放到回撤的高点。 一套交易系统基本的框架就建立起来了。 Zigzag的使用方法二 作为画趋势线的连接点 趋势线是很常见的技术指标,在技术分析中被广泛地使用。 但一直以来趋势线在实战中都存在一个BUG,那就是难以保证划线的一致性。 在图表上有很多的高低点,到底该连接哪一个呢?不同的书上画趋势线的方
FREE

Market Profile 3 MetaTrader 5 indicator version 4.70— is a classic Market Profile implementation that can show the price density over time, outlining the most important price levels, value area, and control value of a given trading session. This indicator can be attached to timeframes between M1 and D1 and will show the Market Profile for daily, weekly, monthly, or even intraday sessions. Lower timeframes offer higher precision. Higher timeframes are recommended for better visibility. It is als
FREE

Multicurrency Expert Advisor works on the basis of determining several candlestick patterns, which should simultaneously form on several trading instruments.
Please test the Expert Advisor with 100% quality of quotes!
Built-in hedging system allows you to increase the stability of the work, reduces the drawdown and greatly increases the probability of reaching the take profit, specified in the settings of the expert. Version for MT4: https://www.mql5.com/en/market/product/84876
Check th

Gann 9+ Indicator Introduction The "Gann Matrix Chart" is the most simple and clear technical analysis in Gann theory, which is the calculation tool that Gann has always been committed to using. It is the essence of Gann's whole life. The Gann 9+ indicator uses the matrix chart to find the future high or low points of stocks or futures. Indicator Input: The base and step size can be set as 1 by default; When the multiple is -1, the multiple will be automatically obtained, or it can be filled in
This EA is suitable for trading on the pair and else several. The EA itself uses universal strategies, but so far they are optimized for some currency pairs. Many settings can be adjusted. There are two panels on the chart, for visualization and settings. He displays his decision on the graph in the form of arrows. There are only two types of arrows. It does not use martingale. It works fine in the tester by default in the settings. It is already configured by default. You can also specify the

Of all the tasks that a trader faces when entering a market, the main task is to determine the direction of the trend. The Artificial Power indicator will help you with this task. Whatever goal the trader sets for himself, the tool to achieve it will be mainly trend indicators.
The Artificial Power indicator without delay and redrawing is used by traders in trend strategies in trading on financial markets (Forex, CFD, binary options). This indicator is designed to detect trends in price movem

This is a buyer and seller aggression indicator that analyzes the shape of each candle and project this data in a histogram form. There are 4 histograms in one. On the front we have two: Upper - Buyer force. Lower - Seller force. At the background we also have two histogram, both with same color. They measure the combined strenght of buyers and sellers. This histograms can be turned off in Input Parameters. It is also possible to have the real or tick volume to help on this force measurement. IN
FREE

Have you ever wondered which currency is the strongest at any particular time? Or which currency pair is trending the most. Well, the currency strength meter helps with just that. It compares USD , EUR , AUD , CHF , GBP , CAD and NZD depending on the timeline you have chosen in settings, and ranks them on the number of pips each has moved compared to the rest. N/B: All currency charts of the above pairs must have loaded. You can do this by highlighting all major and minor currencies in
FREE

Presentation
Another indicator that makes scalping on tick charts easier, it displays an Heiken Ashi graph in Ticks.
It allows to detect entry points and trend reversals. Recommended number of ticks in a candle : 5, 13 or 21.
Parameters Ticks in candle: Number of ticks in a candle (default 5), Displays Trend arrows : displays a trend arrow based on EMA8 and EMA20 crossing, Displays MM50, Displays MM100, Max Candle (CPU): number of candles max to manage, low value will save ressources of
FREE
트레이딩 전략과 기술 지표를 판매하기에 가장 좋은 장소가 왜 MetaTrader 마켓인지 알고 계십니까? 광고나 소프트웨어 보호가 필요 없고, 지불 문제도 없습니다. 모든 것이 MetaTrader 마켓에서 제공됩니다.
트레이딩 기회를 놓치고 있어요:
- 무료 트레이딩 앱
- 복사용 8,000 이상의 시그널
- 금융 시장 개척을 위한 경제 뉴스
등록
로그인
계정이 없으시면, 가입하십시오
MQL5.com 웹사이트에 로그인을 하기 위해 쿠키를 허용하십시오.
브라우저에서 필요한 설정을 활성화하시지 않으면, 로그인할 수 없습니다.