MetaTrader 5용 유료 기술 지표 - 36

The MultiTimeframe Volume Zones Indicator is a powerful tool designed to provide traders with comprehensive insights into market dynamics. It combines several essential features, including volume analysis, Dow Zones, buy and sell arrows, candle timer, and market movement across different time frames. This all-in-one indicator equips traders with valuable information to make informed trading decisions. Key Features: Volume Analysis: Gain a deep understanding of market sentiment and strength by an
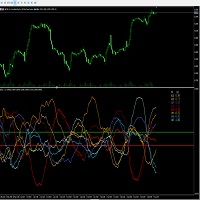
The qualitative indicator calculates the difference between USD, EUR, GBP, AUD, JPY, CHF, NZD, CAD currency pairs. The calculation is carried out online; it calculates supply and demand among themselves in various bundles. The display can be observed in two modes: general for all eight pairs and also specifically for the selected pair. An important indicator of the indicator is the zero axis, which indicates the general trend of currencies and their advantage relative to each other. The indicato
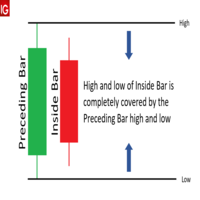
The Inside bar indicator can detect where inside bars occur in the charts and will change the color of the candle based on user inputs. Please note that the color can differ based on the current color of the candle due to supposition of the colors. Here are the characteristics of an inside bar pattern: High: The high of the bearish candle is lower than the high of the previous bullish candle. Low: The low of the bearish candle is higher than the low of the previous bullish candle. Body: The bo
Market screener: Price, Spread and Swap, for selected Symbols (Market Watch) You can customize the list: set only the Symbols (currency pairs) that are needed. The number of Symbols is unlimited. The list can be sorted in ascending or descending order (Symbol name). The panel can be moved to any place on the chart. You can also minimize the panel. There is an option to notify about the increased spread size compared to the average value. My #1 Utility : includes 65+ functions | Contact me

The indicator detects the beginning of a new trend not directly, but by comparing two forecast values based on the available history. Its action is based on the assumption that the predicted (historically normal) price and the real price differ due to the appearance of "new" force (unbalanced impact on the market), which usually leads to a significant market correction in an unstable market. The indicator does not track market stability, so it is recommended to use other methods to control vol
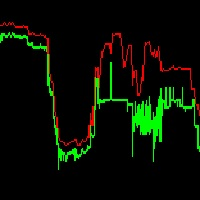
It is super imporant to know what the spread is on your charts!
This indicator displays the Ask High of the past bars, similar to that of the backtester. This allows you to see the spread of bars in real time.
The spread of the bar is the ask-bid price. The spread of a bar is the minimum spread of any ticks found within that bar. I hope this makes sense.
If you have any questions or feedback, let me know - thank you.

This is one of my preferred indicators where it plots on the chart Railroad Track candles, i.e. candles that have similar size. It is a very good indicator for trend direction. In the settings there is an option for Max candle size and Min candle size and also for the percentage for the tolerance between the Min and Max candle size. The candles values are calculated for High and Low. Have fun and enjoy trading! P.S. Please send me a message or leave a comment with any suggestions or improvements

This will find a possible reverse area and show entry signal and this strategy is using every candle and calculate them
buyer should us e with other indicators to get the best trade entry like Macd , RSI , or EMA . SMA.
Make sure try demo first it will supprise you all because how good it is
i hope you guy enjoy it but my coding is not good, so i cant code any EA for this , my own strategy
The Volatility Proper Index indicator displays the volatility index of a trading symbol in a separate window.
To calculate volatility, the calculation of price deviations from the moving average is used.
Indicator parameters:
Period - the number of recent bars for which the volatility index is calculated.
MinThreshold - the minimum price deviation from the moving average, at which this deviation is taken into account in the calculations.
AveragePeriod - moving average period,

To test the adviser, do you open a separate account for each of them? this is very inconvenient, but thanks to this indicator, this is no longer a problem!
Do not be too lazy to read the full description and do not close the page ahead of time, this indicator is needed by almost every trader, no matter if he trades with his hands or uses advisors.
Buying this indicator as a gift you will receive an adviser with not bad results.. if you have already received a gift from me from othe

Super Trend Plus is a trading system that uses four Supertrends set with different parameters. The idea behind this system is that when three Supertrends move in the same direction, there is a strong trend confirmation, but entry occurs only when the fourth Supertrend also moves in the same direction as the other three. For example, the first Supertrend could be used with a volatility multiplier of 3 and a period of 10, the second Supertrend with a volatility multiplier of 3 and a period of 12,

To get access to MT4 version please click here . This is the exact conversion from TradingView: "RedK_Supply/Demand Volume Viewer v3.0" by "RedKTrader" This is a light-load processing and non-repaint indicator. All input options are available. Buffers are available for processing in EAs. You can message in private chat for further changes you need. Thanks for downloading
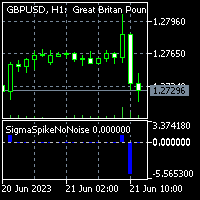
To get access to MT4 version please click here . This is the exact conversion from TradingView: "Sigma Spikes No Noise" by "irdoj75" This is a light-load processing and non-repaint indicator. All input options are available. Buffers are available for processing in EAs. You can message in private chat for further changes you need. Thanks for downloading...

Creating an Index: Importance, Customization, and Weighting Options for MT5 Trading Indicator Designing your index is crucial for efficient symbol tracking in the world of trading. With a powerful MT5 trading indicator, you gain the flexibility to construct an index that suits your preferences, whether it's an equal weighted or custom weighted one. Unlike widely-known indexes like the S&P 500, which heavily favor certain winners, this indicator empowers you to curate a basket of symbols and assi
The Scalper v2 will give you accurate guidance to trade with. It has indications with arrows and it sends notifications. This software was built based on the RSI,MACD,Martingale, Ema 50 and 200, Aligator, SMA 30,50, ADX, Volumes percent range, variable dynamics and fibonacci levels. all of these indicators have something in common, it allows analysis, support and resistance, accurate signals for buy and sell, overbought and oversold market analysis. I have combined all of these indicators into o
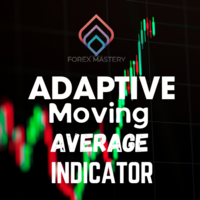
The Adaptive EMA consists of 3 lines: Yellow, Blue and Red If a yellow line appears, it means the market is entering Consolidation, Range, Contraction and no opportunities are available. If a Blue line appears, It means prices are accumulating, and now being marked up, so you are now entering a buy market with a strong Bullish trend. If a Red line appears, it means prices are now being marked down, price distribution is underway, so you are now entering a Sell market with a strong Bearish trend.

Introducing our latest innovation in MetaTrader 5 indicators, designed to dramatically improve your trading workflow with high functionality and ease-of-use. It features a robust collection of features designed to help you streamline chart analysis and make the most of your trading decisions. Here's a quick rundown of its incredible features: Fast Drawing of Objects : Save precious time with the quick draw feature. With just a click of a button, you can create various trading objects on your ch
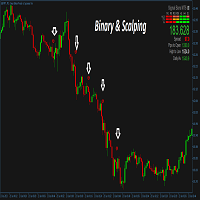
This is a trend following system for Binary options traders and forex scalpers. It is carefully crafted and recognizes periods of WATERFALL in the market and gives the trader the advantage and opportunity of riding with the momentum. It works on all timeframes and currency pairs especially high liquidity pairs. Avoid news events 15mins before and after. Always have your money management script or system in place. Tested on Deriv synthetics as well, please check screenshots. The mt4 version can b

Smart Currency Strength is a powerful yet simple indicator that measures the strength of individual currencies.
It features a graphic panel that lists the main currencies and their strength in each timeframe, ranging from 0 (most oversold) to 100 (most overbought). The strength for all currencies in the current timeframe is also shown in a separate window as a multi-line graph, where each currency is represented with a different color, this allows you to monitor the evolution of strength tre

SourcePoint是一个很好的中长线交易指示器,他能独立使用,也可以去其他趋势型指标独立使用,可以很好的指出最佳的buy和sell位置,指标不含有未来函数,不会重新绘制,不仅能够应用到自己的手动交易过程中,还能完全可以写入到自己的EA中。建议配合BS TrendLine( https://www.mql5.com/zh/market/product/96476?source=Site+Market+My+Products+Page ) 一起使用。 (如果你感觉到这个指标能够帮助你进行更准确的交易,请帮忙给个好评,希望我的作品能够帮助更多有需要的人) ===================参数列表===================== fastP: 12 slowP:26 avgP:9 =================参考使用方法=================== 此指标可以适用于任何交易品种,能够用在任何周期。 每次形成一个交点,就是一个交易机会,同时也是一个持仓平仓点位。建议配合大小周期一起使用,这样更容易让你找到更精准的入场位置和出场位置

Moving Average Crossover Indicator. Add this Easy Indicator to your charts. The indicator indicates when to buy and when to sell. When the line is orange that is a sell signal. When the line is green that is a buy signal. Easy to use and colors can be changed so suit your charts. Easy to use. Follow the indicator and enter your buy and sell signals. Work on any market and on any timeframe.

Easy to use buy and sell signals with arrows. Non Repainting indicator. Non Lagging indicator. Down Arrows indicate sell and up arrows indicate buys. Works on any market and on any time frames. Arrow colors can be changed to match chart colors. Audible alerts. Periods can be changed to phase out false signals. Please remember to follow the trend like with any indicator.

The Game-Changing Engulfing Candle Hunter - Your Guide to Profitable Trend Trading
Step into the realm of trading possibilities with our revolutionary product - The Engulfing Hunter. Designed by traders for traders, this dynamic indicator combines the potency of engulfing candlestick patterns and the versatility of proprietary trend detection system, offering a trading edge unlike any other. Engulfing candlestick patterns have always been a revered tool in the arsenal of seasoned traders. Acti
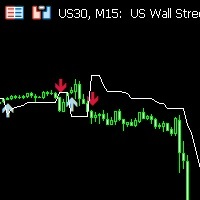
**Features:**
1. **Innovative Trend Tracking:** The UT BOT Simple Indicator leverages the power of the Average True Range (ATR), a renowned volatility measure, to calculate precise trailing stop values, providing unparalleled insights into market trends.
2. **Customizable Settings:** Flexibility is paramount in any trading strategy. With this in mind, our indicator allows you to adjust the ATR periods and other key parameters to tailor the tool to your trading style and strategy.
3. **Rea

Introducing the Kangaroo Hunter - Your Ultimate Edge in Forex Trading ATTENTION Forex Traders! Are you in constant pursuit of high-probability trade setups? Or maybe you're a novice trader struggling to pinpoint precise entry and exit points? Our solution, the Kangaroo Hunter, is about to revolutionize your trading journey. This meticulously designed indicator simplifies and refines the art of identifying the often elusive Kangaroo Tail patterns in the Forex market, pushing your trading strateg
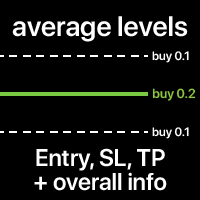
The average Entry, SL and TP levels of all trades on the Symbol. The levels can be calculated together, or separately for Buy and Sell trades. You can optionally display additional info: Level price, total Lot size, floating P/L. The styles and colors of the levels are customizable. My #1 Utility : includes 65+ functions | Contact me if you have any questions | MT4 version In the settings of the indicator, you can configure: Average Entry level: on/off; Average SL level: on/off; Average
MT5インジケータ TC-Alerts 開発経緯:
実はFXで簡単に勝てる手法があるんです。 それは。。。 主要な(4時間足以上、4時間足、日足、週足)のレジスタンスとサポートラインの反発を狙う FXは一方向には進まず90%以上で 必ず、必ずと言っていいほど、 どこかで反発します 。そこは大抵主要なレジスタンスとサポートラインまたは主要なフィボナッチラインなのです。
なのでそこに水平線を引いて ただ待つ のです。そこに到達したら、1分足や5分足に落として
長いヒゲ、ダブルボトム、ダブルヘッド、トリプルボトム、トリプルヘッド、三尊、逆三尊などの反転の形成を確認してエントリーする。 または、こちらを使用して
https://www.mql5.com/ja/market/product/53987
強弱が弱くなってきたのを確認してエントリーすればいいのです。
これだけです。シンプルです!!
うまく行くと、長期足レベルでレジスタンスとサポートライン間、つまり頭から尻尾まで取れる可能性もありますし、リスクリワードが異常にいいです。
そのためには、チャートに主要なレジスタンスと

This Indicator breaks down the movement into 3 waves: The primary wave suitable for long-term trading The intermediate wave suitable for intraday trading The minor wave for short-term trading
Supports and resistances:
Each wave is defined by major highs and minor lows. According to Dow's theory, an uptrend will be defined by minor lows higher and higher and a downtrend by major highs lower and lower.The indicator plots the next supports and resistances for each wave.
Trend channels (primary

Meet the Tweezer Hunter, an essential tool for every Forex trader looking to make accurate, trend-following trades. This powerful, intuitive indicator helps traders spot potential trend reversals before they happen, providing a significant advantage in the fast-paced world of Forex trading. The Tweezer Hunter is more than your average tweezer candle indicator; it's designed with a built-in trend identification feature that accurately detects whether the market is bearish or bullish. By integrat

This indicator uses candlesticks with large real bodies to predict possible market structure shift. Displacement is a very powerful move in price action resulting in strong selling or buying pressure. Generally speaking, displacement will appear as a single or a group of candles that are all positioned in the same direction. These candles typically have large real bodies and very short wicks, suggesting very little disagreement between buyers and sellers. Often, a displacement will occur just af

디디 지수 볼륨(Didi Index Volume)을 소개합니다. 이는 브라질 트레이더 오디르 아기아르(Odir Aguiar)이 개발한 기술적 분석 지표로, 금융 시장에서 기회를 식별하는 고급이고 강력한 접근 방식으로 주목받고 있습니다. 다양한 플랫폼에서 이용 가능한 디디 지수 볼륨은 정확한 통찰력과 가치 있는 정보를 찾는 트레이더들에게 필수적인 도구가 되었습니다.
이 지표는 오디르 아기아르가 개발한 유명한 디디 지수(Didi Index)와 거래량의 지능적인 활용을 결합합니다. 이 조합은 가격 동작과 거래량의 상호작용을 더 깊게 분석하여 자산의 움직임에 대한 독특한 시각을 제공합니다.
정교한 알고리즘과 가중 평균 계산을 통해 디디 지수 볼륨은 거래량을 기반으로 가격 변동을 예측할 수 있습니다. 이 기능은 신흥 트렌드, 시장 반전 및 적시적인 진입 및 청산 시점을 파악하는 데 매우 중요합니다.
디디 지수 볼륨을 사용하면 정확한 시장 해석을 돕고 허무맹랑한 결정을 피할 수
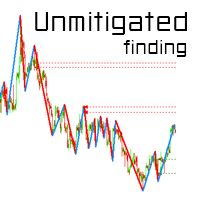
SMC Unmitigated Finding is a indicator for find unmitigated supply and demand in previous legs of price
Settings Zigzag Settings ZZDepth - by Default is 12.
ZZDeviation - by Default is 5.
ZZBackStep - by Default is 3. Horizontal Line Settings SupportColor- color for Support line.
ResistanceColor - color for Resistance line. Settings Num of Show - Number of Support & Resistance Show.

3 candel indicator in 1 !!! The 3 most important candel indicator in 1 packadge. Help trader in chart visualisation, prevent reversal !!! Doji : Gravestone Doji, Long Legged Doji, Dragonfly Doji. Engulfing : Bullish, Bearish. Hammer : red hammer, green hammer. Fully parametrable indicator icon color config and alarm. Free life time update !!! Just try our demo for free.

Crash 500 indicator Update V2 No Repaint
This indicator works with a custom build in strategy The indicator will only give a sell sign when market conditions are in place. Only for sell. Apply own risk management target profit and stoploss. When market conditions are met the sell sign will indicate you to enter a sell position and you will have to apply your risk management system accordingly. This is only for Crash 500 market and only 1min chart
NB: Please note this indicator will be fr

Presenting the uGenesys Break of Structure and Change of Character Indicator The uGenesys Market Structure Indicator is the advanced solution designed specifically for forex traders seeking a competitive edge. This innovative tool goes beyond merely identifying Break of Structure (BoS) and Change of Character (CHoC); it also illuminates optimal entry and exit points on your forex charts, transforming your trading experience.
While the uGenesys Market Structure Indicator can reveal pivotal pa

스마트 바이너리 볼륨 인디케이터는 거래량 분석과 머신 러닝을 결합한 다목적 도구입니다. 스캘핑과 같은 단기 거래를 포함하여 다양한 시장과 전략에 적용할 수 있습니다. 고급 머신 러닝 알고리즘을 사용하여 이 인디케이터는 복잡한 패턴을 인식하고 더 정확한 매수 및 매도 신호를 생성합니다.
Buffer to Create EA. Buffer Line Gold = 0. Buffer Line Red = 2 Buffer AI = 3
AI Buffer >= 0 ("SIGNAL BUY")
AI Buffer <= 0 ("SIGNAL SELL")
사용 팁:
1. 대비되는 선들에 주의하십시오: Smart Binary Volume 지표의 선들이 대비되는 움직임을 보이는 상황에 주목하십시오. 이러한 조건은 진입 신호를 나타낼 수 있습니다.
2. 상승 신호: 파란색 라인이 0.30보다 높고 빨간색 라인이 -0.30 아래에 위치하는 경우 주의하세요. 이러한 설정은 상승
Multicurrency indicator in table format. Signals appear with confirmation, no repaints. Works on the current (open) timeframe. Notifications come for an open instrument. In the indicator settings, you can choose 1 of 4 Moving Average strategies. Strategies (represented in screenshots): Classic fast and slow moving average crossover Reverse signal of classic crossing (used for flat/sideways movement) Classic crossover relative to a slower moving average (Trend MA in settings) Price touching the f
ボリンジャーバンドは、価格変動を分析するためのテクニカル分析の1つのツールになります。
ボリンジャーバンドには、中心線と2つのバンドがあります。
中心線は、一般的には移動平均線(通常は20日間の単純移動平均)として計算されます。この中心線は、一定期間の価格の平均値を表しています。 ボリンジャーバンドのバンドは、中心線の上と下に等間隔で配置されます。通常は中心線から2つの標準偏差分だけ離れた位置に設定されます。 拡大(Expansion)とは、ボリンジャーバンドが広がる状態を指します。
つまり、上下のバンドが中心線から離れ、価格の変動範囲が広がっていることを示します。拡大は、相場が活発になり、価格の大幅な変動が起こりやすいことを示すことがあります。 収縮(Contraction)とは、ボリンジャーバンドが狭くなる状態を指します。
つまり、上下のバンドが中心線に近づき、価格の変動範囲が狭まっていることを示し、相場が方向感を失い、一時的に価格変動が鈍化していることを示すことがあります。 ボリンジャーバンドの収縮と拡大は、価格変動のパターンや相場の特徴を捉えるために重要な指

MT4 Version Understanding market sentiment is a critical aspect of successful trading. Market sentiment refers to the overall feeling or attitude of traders and investors towards a particular financial instrument, such as a stock, currency pair, or cryptocurrency. It is a collective perception of market participants' emotions and beliefs about the asset's future price direction. Market sentiment can be bullish (positive), bearish (negative), or neutral (sideways). Knowing the market sentiment ca

이 도구로 시장 구조를 빠르게 분석하고 중요한 가격 수준을 활용하세요.
시장 구조 이 사용자 지정 인디케이터는 중요한 가격 수준을 표시하며, 진입점 또는 수익 목표로 사용할 수 있습니다.
트레이딩 범위 파악 시장 턴오버 포인트를 참고하여 이 지표로 스캘핑하세요.
브레이크아웃 트레이딩 기회 이 지표를 사용하여 브레이크아웃 기회를 포착하세요. 이 트레이딩 전략은 우수한 위험 대비 보상 비율을 제공합니다.
맞춤 알림 가격이 특정 거래 범위를 벗어나면 휴대폰으로 알림을 받거나 이메일로 받아보세요. 이러한 알림을 트레이딩 전략에 맞게 사용자 지정해야 한다고 생각되면 언제든지 메시지를 보내주세요.
스마트 머니 개념 이 인디케이터는 스마트 머니 개념을 따르기 위해 독점 트레이더와 협력하여 개발되었습니다.
심플한 디자인 차트에 가능한 모든 영역을 그리는 대신 따라야 할 주요 영역이라고 생각되는 레벨 만 그리기로 결정했습니다. 따라서 지표가 간단하여
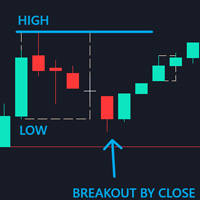
Control Candle is the candlestick which holds multiple inside bars and are in control until its high low range is broken by close of any candlestick. When control candle is broken, price may act on these control candle as support and resistance.
This indicator create rectangles on chart which will help you find control candles fast.
Control candle indicator box is customizable by color, style, width and other options in indicator settings.
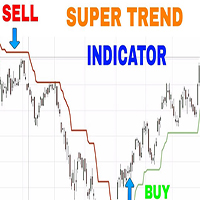
As the name suggests, it indicates the direction of the price movement in a market that is trending, that is following any particular path . It is plotted in stock price charts for investors to see marked current trend which is shown in red when prices have dipped and green when prices have risen.
Input Parameters:
CCI Indicator period ATR Indicator Period CCI Activation level Horizontal Shift of Indicator Bars
Otherwise ; You can use the Default settings

KT Triple Top-Bottom identifies the triple top/bottom pattern with a breakout signal in the opposite direction. It is used to identify potential trend reversals.
A Triple Top pattern is formed when the price reaches a high point three times, while a Triple Bottom pattern occurs when the price comes to a low point three times.
Features The indicator detects the triple top/bottom pattern with high precision and accuracy. The indicator suggests a shift in momentum, with sellers or buyers takin

KT DMA is a modified and advanced version of the classic Displaced Moving Averages with buy/sell crossover alerts and a Multi-Timeframe scanner that shows DMA's direction across each real-time time frame. A Displaced Moving Average is a simple moving average that moves ahead or backward in a time frame (either short-term or long-term). It also allows you to predict price movement more accurately.
Features Depicts the trend direction using the alignment of three moving averages. Buy/Sell signa
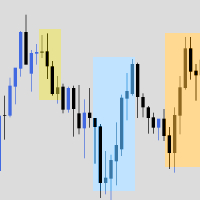
The indicator is a bundle of EIGHT different fundamental functions required for a trader: 1] Forex Session where you can determine your own timings/highlights. 2] High low marking from 1H to 1M 3] Sweetspot 4] Spread and Candle Stick Timer 5] Background logo for branding- You can place the images at any zone of the chart you want 6] Profit and Loss 7] Days names (SUN MON TUE…) on the chart 8] High/low break notification
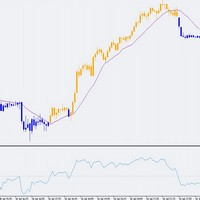
This indicator can be very important in any trading system. The Indicator colors candles above or below the 50 level of the RSI, which is a widely used indicator in technical analysis. With this indicator it is much easier to identify trends, helping with the entry and exit points of negotiations. It is a fact that in the financial market, simple things work. Este indicador pode ser muito importante em qualquer sistema de negociação. O Indicador colore as velas acima ou abaixo do nível 50 do
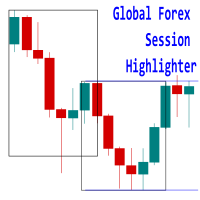
Introducing the 'Global Forex Session Highlighter' , a powerful tool designed to enhance your trading strategy by providing a visual representation of the Three major Forex trading sessions: Tokyo, London, and New York. This indicator is designed to help traders understand the dynamics of the global Forex market by highlighting the trading sessions directly on your MT5 chart. It provides a clear view of when each session starts and ends, allowing you to strategize your trades around the most act

The indicator is created using a unique algorithm that has no analogues. Based on the calculations, the contract price itself and the percentages displayed in it are calculated, which are displayed in the indicator in the form of histograms in two drawing options, as well as in six options for displaying prices on a chart in various combinations, which allows you to accurately see the interest of all trading participants in the form of drawing levels support and resistance. Trading decisions can
Candle Scanner Dashboard is an incredibly powerful tool in the financial markets. It excels at detecting market reversals, trend changes, and retracements. The dashboard displays patterns as they are identified, and with a simple click on each pattern, you can view them on their dedicated charts to precisely locate their occurrences. With its capability to detect 11 popular bullish and 11 bearish patterns, you can trust the dashboard to handle pattern identification effortlessly. It provides an

MT4 Version GaussChannelPro is a powerful and innovative trading indicator designed to enhance your trading strategy with the precision of Gaussian-based channels. Leveraging the principles of Gaussian (normal) distribution, this indicator creates a unique channel on your price chart, offering valuable insights into market trends and potential turning points. Utilizing advanced statistical analysis, GaussChannelPro calculates the optimal channel boundaries based on historical price data, present
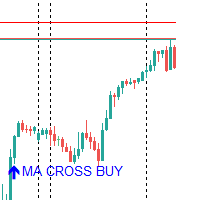
This indicator does not repaint, it is a trend indicator created to trade all financial instruments; go watch the video of the presentation on youtube https://youtu.be/OyhGcmgpzdQ you can do swin, day trading and scalping depending on the settings you will receive after your purchase, join my telegram channel @ASTBOSSA MY USERNAME FOR TELEGRAM GOOD LUCK TIMEFRAME: H1,H4,D1 (98% WIN RATE FOR ALL MARKET)
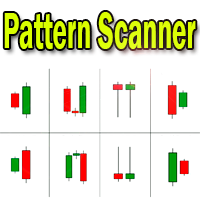
Candlestick pattern indicator - display found candlestick patterns on the chart. MT4-version: https://www.mql5.com/en/market/product/103345 Bearish patterns: Bearish Pattern Designations Pattern name SS
Shooting Star STR(S) Evening Star DJ(E) Evening Doji Star DC Dark Cloud Veil BEP Bearish Engulfing Bullish patterns: Designation of bullish patterns Pattern name HMR
Hammer pattern
STR(M) Morning Star DJ(M) Morning Doji Star PRL Piercing Line BEP Bullish Engulfing The
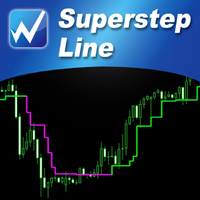
【SuperStep Line】Indicator Introduction : The color of the SuperStep line which is green and climbing up means that the price trend is going up.The color of the SuperStep line is purple and going down means that the price trend is going down.
It is very simple to use it to judge the market trend! What's even better is that the open parameters of the indicators allow investors to adjust. You can adjust 【SuperStep Line】 according to your needs. Adjust it faster to be closer to short-term market

【Super Scanner】Indicator Introduction : The color of the Super Scanner which is green and climbing up means that the price trend is going up.The color of the Super Scanner is red and going down means that the price trend is going down.
It is very simple to use it to judge the market trend! What's even better is that the open parameters of the indicators allow investors to adjust. You can adjust【Super Scanner】according to your needs. Adjust it faster to be closer to short-term market fluctuati

Indicator Type Strategy (Pullback) for all Symbols and Periodicity, Preferably from 30M periodicity. Can be used for manual trading. Its workspace corresponds to channel of 3 bars of Bill Willians. Also relies on the indicator Rsi and Atr. BUY when: There is a Green Arrow STOPLOSS to buy, below the bottom line of the channel (red line)" SELL when: There is a Red Arrow. STOPLOSS to sell, above the upper line of the channel (blue line)
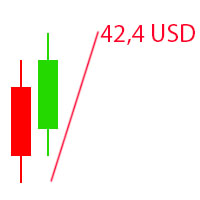
The Visual Result Calculator Indicator is a powerful tool designed to enhance your trading experience on the MetaTrader platform. This intuitive and user-friendly indicator allows you to visualize potential profits or losses on a trading chart, helping you make better-informed decisions and manage your trades with precision. The Indicator displays a dynamic line on the trading chart, representing the potential profit or loss of a trade based on the start and end of the line. Simply click and

Presenting breakout strategy indicator, influenced by the insightful Smart Money Concept. This sophisticated tool aims to assist traders in spotting potential trading opportunities characterized by breakouts in the market. The foundation of the Smart Money Concept lies in the actions of seasoned investors and astute market participants. It's important to clarify that this indicator does not guarantee profits; rather, it's designed to empower traders with valuable insights into

자동 고정 VWAPs로 거래 통찰력 해제하기: 자동 고정 VWAPs 는 거래 세계에서의 당신의 안내자입니다. 이 인디케이터들은 중요한 시장 전환점을 정확하게 찾아 VWAP 라인을 사용하여 차트에 나타냅니다. 이것은 고정 VWAP 전략을 사용하는 트레이더에게 혁명을 가져다주는 것입니다. 어떻게 작동하나요? 고점 식별: 현재 양초의 가장 높은 가격이 이전 양초의 가장 높은 가격보다 낮을 때, 그리고 이전 고점이 그보다 이전에 나온 고점보다 높을 때, 우리는 고점을 식별한 것입니다. 이 중요한 지점은 이 세 개의 양초 중간에 위치합니다. 저점 인식: 현재 양초의 최저 가격이 이전 양초의 최저 가격보다 높을 때, 그리고 이전 저점이 그보다 이전에 나온 저점보다 낮을 때, 우리는 바닥을 발견했습니다. 이 바닥의 중심이 바로 우리의 초점입니다. 고정된 VWAPs 그리기: 각 상단과 하단은 VWAP 라인에 해당합니다. 그러나 제한이 있습니다: 인디케이터의 계산 요구 사항으로 인해 차트에서 동시에
소개:
"Turning Zone"은 거래자에게 금융 시장 내에서 잠재적인 추세 반전을 감지할 수 있는 강력한 도구를 제공하도록 설계된 정교하고 혁신적인 MQL5 시장 지표입니다. 시대를 초월한 갈퀴 분석 개념을 활용함으로써 Turning Zone 지표는 시장 정서가 바뀔 가능성이 있는 주요 반전 영역을 식별하여 거래자에게 정보에 입각한 결정을 내릴 수 있는 귀중한 통찰력을 제공합니다. MT4 버전 : WH Turning Zone MT4
관련상품 : WH Trend Continuation MT5
주요 특징들:
피치포크 분석. 반전 확률. 시각적 명확성. 사용자 지정 옵션. 실시간 알림. 사용하는 방법 :
옵션 1: 가격이 터닝 존에 도달할 때까지 기다렸다가 존 위/아래에서 고유한 진입 규칙, 정류장 및 타겟을 사용합니다.
옵션 2: 내 진입 규칙이 형성될 때까지 기다리십시오(빨간색/파란색 화살표로 표시). 중지되고 대상이 차트에 나타납니다.
정확한 추

Introducing the revolutionary ICT Silver Bullet Strategy Indicator for MT5, a groundbreaking tool designed to usher in a new era of trading for beginners and experienced traders alike. This advanced indicator seamlessly translates the intricate ICT Silver Bullet strategy into a simplified visual representation on your charts, offering not just comprehension but a path to profitable trading. A Strategy Simplified: Navigating the complexities of the ICT Silver Bullet strategy has never been easie
: 단단한].
낮음 - 25% 선 너비 [기본값: 4].
현지 시장 오픈 라인 색상[기본값: DodgerBlue].
로컬 마켓 오픈 라인 스타일 [기본값: 파선].
로컬 마켓 오픈 라인 너비 [기본값: 1].
현지 시장 중간선 색상 [기본값: DarkOrchid].
현지 시장 중간 선 스타일 [기본값: 점선].
현지 시장 중간 선 너비 [기본값: 1].
현지 시장 마감 라인 색상[기본값: 빨간색].
현지 시장 종가 선 스타일 [점선].
현지 시장 마감 선폭 [1].
로컬 마켓 오픈 프라이스 컬러[화이트].
현지 시장 오픈 프라이스 스타일 [점선에 이중 점선].
현지 시장 시가 폭 [1].
이 표시기의 라인은 MQL5 개체 기능을 통해 Expert Advisor에서 호출할 수 있습니다.
이

White Light POC (WLP)
Experience precision in trading analysis with White Light POC (WLP), a meticulously designed powerful tool for traders seeking accurate Point of Control (POC) calculations. This advanced indicator has been crafted with a focus on efficiency and adaptability, ensuring seamless integration into Expert Advisors or other indicators through a convenient copybuffer interface. Features: Lightweight Efficiency: White Light POC (WLP) offers a streamlined solution that provides POC

Considerando que os preços de OHLC de períodos anteriores são regiões importantes de negociação, criei um indicador que traça linhas de Open, High, Low e Close do dia, semana ou mês anterior no gráfico atual. Além de marcar essas regiões, linhas extras foram inseridas como opção que marcam os MEIOS (50%) dessas regiões e uma linha que marca a ABERTURA do dia. O usuário pode configurar a exibição das linhas que achar mais expressivas. Configurações: PERIOD RANGE Timeframe = Período de referência
A top and bottom indicator that can intuitively identify the trend of the band. It is the best choice for manual trading, without redrawing or drifting. Price increase of $20 every 3 days, price increase process: 79--> 99 --> 119...... Up to a target price of $1000. For any novice and programming trading friend, you can write the signal into the EA to play freely. Array 3 and array 4, for example, 3>4 turns green, 3<4 turns red. If you don't understand, please contact me. ====================P

The "MA_Candles" indicator is a customizable technical tool designed for the MetaTrader 5 trading platform. It enhances price chart analysis by visually representing candlesticks with distinct colors based on a moving average (MA) calculation. This indicator helps traders identify potential trend reversals and market sentiment shifts.
The "MA_Candles" indicator enhances MetaTrader 5 charts by coloring candlesticks based on a moving average (MA) calculation. It helps traders quickly identify

Indicador tipo 2mv frequência mostra os níveis percentuais no mercado financeiro que tendem a ser zonas realmente importantes para os traders. Observem que o preço segue um fluxo e uma frequência que se enquadram em canais percentuais de movimento, tradicionalmente traçados por níveis Fibonacci. O indicador LevelsPercent traça linhas em pontos específicos de percentual configurados pelo usuário e "pode" anteceder possíveis níveis de SUPORTE e RESISTÊNCIA. A leitura do mercado e a identificação
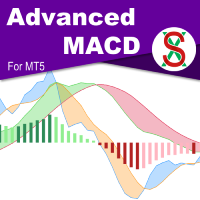
MACD ( M oving A verage C onvergence/ D ivergence) is a widely used indicator in technical analysis. What makes the MACD such a valuable tool for technical analysis is that it effectively combines two indicators into one. It can help to identify trends and measure momentum simultaneously. SX Advanced MACD for MT4 is available here . SX Advanced MACD indicator takes this concept further by plotting two distinct MACD indicators on a single chart, facilitating clear visual correlation betwe
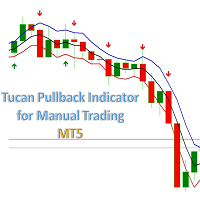
Indicator Type Strategy (Pullback) for all Symbols and Periodicity, preferably from M30. The strategy is based on criteria for the Rsi, Atr and Force indicators. The channel band corresponds to the value of the Atr indicator. The default parameters correspond to : a) Price = Median price b) Method of averaging = Simple c) Period of averaging = 3 d) Coefficient of the Atr indicator = 1.0
BUY when there is a Green Arrow. StopLoss below the bottom line of the channel. SELL when there is a Red
Introducing the MetaTrader 5 "Relative Volume Indicator" – Your Ultimate Volume Insights Solution! Unlock the Power of Market Volume with Precision and Ease! Are you ready to take your trading to the next level? Say hello to the game-changing "Relative Volume Indicator" for MetaTrader 5 – the tool every trader dreams of! Key Features High Volume Bliss: Easily identify high volume periods with the striking blue color. Pinpoint the most significant market movements and potentia

SSL 지표는 시장 트렌드를 쉽고 정확하게 식별할 수 있도록 설계된 매우 효율적이고 신뢰할 수 있는 추세 추종 도구입니다. 이동 평균을 기반으로 하는 SSL(스텝 스톱 라인) 지표는 색상을 변경하고 잠재적인 추세 반전이 있을 때 명확한 시각적 신호를 제공합니다. 이 도구는 강력한 시장 추세를 활용하면서 횡보 시장에서 흔히 발생하는 잘못된 신호를 피하고자 하는 트레이더에게 탁월합니다. 주요 특징: 정확한 추세 감지 : SSL 지표는 두 개의 이동 평균을 사용하여 매수 및 매도 신호를 계산합니다. 가격이 이 수준을 교차하면 지표가 색상을 변경하여 트레이더에게 진입 또는 종료 시점을 알립니다. 간단한 시각적 신호 : 지표는 차트에 선을 표시하며, 시장 상황이 변할 때 녹색(강세)에서 빨간색(약세)으로 색상이 변경됩니다. 이 직관적인 디자인은 의사 결정 과정을 단순화하여 초보자와 경험 많은 트레이더 모두에게 적합합니다. 사용자 정의 가능한 설정 : 이동 평균 기간을 사용자 전략에 맞게 조정
MetaTrader 플랫폼 어플리케이션 스토어에서 MetaTrader 마켓에서 트레이딩 로봇을 구매하는 방법에 대해 알아 보십시오.
MQL5.community 결제 시스템은 페이팔, 은행 카드 및 인기 결제 시스템을 통한 거래를 지원합니다. 더 나은 고객 경험을 위해 구입하시기 전에 거래 로봇을 테스트하시는 것을 권장합니다.
트레이딩 기회를 놓치고 있어요:
- 무료 트레이딩 앱
- 복사용 8,000 이상의 시그널
- 금융 시장 개척을 위한 경제 뉴스
등록
로그인
계정이 없으시면, 가입하십시오
MQL5.com 웹사이트에 로그인을 하기 위해 쿠키를 허용하십시오.
브라우저에서 필요한 설정을 활성화하시지 않으면, 로그인할 수 없습니다.