MetaTrader 5용 기술 지표 - 92

Indicators Tracking for Trader Sale on MT5 The Indicators Tracking feature in MetaTrader 5 (MT5) is an essential tool for traders looking to optimize their sales and decision-making processes. This functionality allows traders to monitor key market metrics and analyze trends effectively, enhancing the accuracy of trade executions and strategy adjustments. Key Features: Real-Time Market Monitoring :
Track live data across various markets, including forex, stocks, and commodities, with indicators
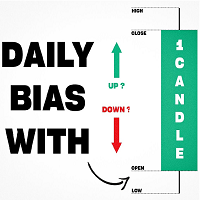
Inspired by TTrades video on daily bias, this indicator aims to develop a higher timeframe bias and collect data on its success rate. While a handful of concepts were introduced in said video, this indicator focuses on one specific method that utilizes previous highs and lows. The following description will outline how the indicator works using the daily timeframe as an example, but the weekly timeframe is also an included option that functions in the exact same manner.
On the daily timefr

The Market Heart indicator scans market entries after high volatility is noticed. Most big moves occur a short time after market volatility. Most big moves occur a short time after market volatility. The idea is to look for entries after the rectangles form and not necessarily as trade entry signals. . For example, you could use the Retracement Feeder indicator that generates arrow signals.
Market Heart MT4 Version
How to use: 1. Primary use The White Box is the first to be formed an

This Simple Smart Money Concepts indicator displays real-time market structure (internal & swing BOS / CHoCH), order blocks, premium & discount zones, equal highs & lows, and much more...allowing traders to automatically mark up their charts with widely used price action methodologies.
"Smart Money Concepts" (SMC) is used term amongst price action traders looking to more accurately navigate liquidity & find more optimal points of interest in the market. Trying to determine where institutional

EMA Cloud System is a Trading System Invented by Ripster where areas are shaded between two desired EMAs. The concept that the EMA cloud area serves as support or resistance for Intraday & Swing Trading. Can be utilized effectively on 10 Min for day trading and 1Hr/Daily for Swings. Ripster utilizes various combinations of 5-12 EMA clouds 34-50 EMA clouds among others. 8-9, 20-21 EMA clouds can be used as well. Adjust what works for you. Ideally 5-12 or 5-13 EMA cloud acts as sold fluid Trendli
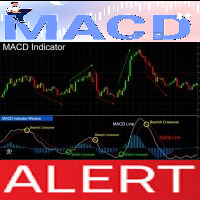
MACD Crossover with Alerts, Colored Histogram, and Zero Line Arrows Overview
The MACD Crossover Indicator is designed to help traders analyze trend direction and momentum shifts. This enhanced version of the classic MACD includes visual crossover markers, dynamic histogram coloring, and real-time alerts, offering a clear and structured approach to market analysis. Histogram color changes based on MACD position (above or below zero). Zero-line arrows for crossover points to highlight key trend

CandleSculptor: Master the Art of Candlestick Patterns and Take Your Trading to the Next Level! Unlock the power of advanced candlestick pattern recognition with CandleSculptor , the ultimate indicator for traders who want to gain a competitive edge in the markets. Whether you're a beginner or an experienced trader, CandleSculptor will help you spot key market reversal and continuation signals instantly, right on your chart. Key Features: Accurate Candlestick Pattern Detection: Automatically ide
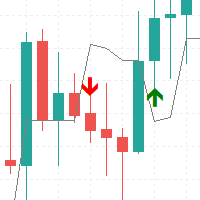
UT Bot Alert Indicator: Detailed Functionality Core Mechanism The UT Bot Alert indicator is a sophisticated trading tool designed to identify market trends and potential entry/exit points using a dynamic trailing stop method. Key Technical Components Volatility Calculation Uses Average True Range (ATR) to measure market volatility ATR period is customizable by the trader Provides adaptive tracking of price movements Trailing Stop Mechanism Creates a dynamic stop line that follows price action Ad

Multi-functional Pattern Indicator: Your Assistant for Successful Trading Looking for a tool to help you identify the most critical market patterns and improve your trading decisions? Our indicator is a versatile assistant for traders of any level. Automatic Detection and Plotting:
The indicator automatically analyzes the chart and highlights patterns, saving you from the hassle of searching for them manually.

The SuperTrend Indicator is a powerful trend-following tool that overlays directly on your price chart. Designed to help traders identify prevailing trends and potential reversals, this indicator uses Average True Range (ATR) calculations to dynamically adjust to market volatility. The intuitive color-coded display ensures clear visualization of trend changes. Key Features: Dynamic Trend Identification: Utilizes ATR-based calculations to provide responsive support/resistance levels in line with

The Mr. Anderson indicator was created based on the original indicators for searching for extremes, the indicator is well suited for determining a reversal or a large sharp jerk in one direction, thanks to it you will know when this happens, it will notify you by the appearance of a blue dot for buying, red for selling.
It uses the process of identifying the rate of change in price growth and allows you to find entry and exit points from the market.
a fundamental technical indicator that allo

With this indicator, you can predict future price behavior for a certain number of bars ahead, giving you the ability to anticipate market dynamics. The indicator draws a forecast line , which models potential future price values based on sophisticated algorithms analyzing past data. This information can be leveraged not only for market entry and exit decisions but also for setting or adjusting stop-loss levels to better manage your positions. Application of the Forecast The data provided
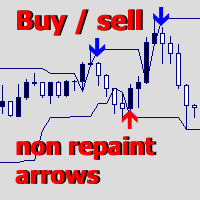
Upper and Lower Reversal - 반전 순간의 조기 예측을 위한 시스템입니다. 상한 및 하한 가격 이동 채널의 경계에서 가격 전환점을 찾을 수 있습니다.
표시기는 신호 화살표의 색상을 다시 지정하거나 위치를 변경하지 않습니다. 빨간색 화살표는 매수 신호, 파란색 화살표는 매도 신호입니다.
모든 기간 및 거래 수단에 맞게 조정됩니다. 표시기는 다시 그려지지 않으며 양초가 닫힐 때만 작동합니다. 신호에 대한 경고에는 여러 유형이 있습니다. 이 표시기는 사용하기 쉽고 2개의 외부 구성 매개변수만 있습니다.
Channel Length - 신호가 구축될 가격 채널의 길이를 조정합니다. Signal Normalization - 신호 화살표의 품질 수준을 변경합니다. 매개변수가 높을수록 잘못된 신호가 줄어듭니다(BTC, 금 및 변동성이 높은 상품의 경우 몇 배로 변경됨). Alerts play sound / Alerts display message / Alerts send n
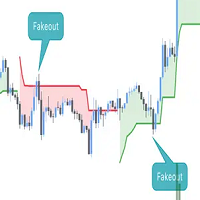
This script is an enhanced version of the classic Supertrend indicator. It incorporates an additional feature that ensures trend reversals are more reliable by introducing a Fakeout Index Limit and a Fakeout ATR Mult. This helps avoid false trend changes that could occur due to short-term price fluctuations or market noise. In smart money concept, when institute , "big-fish" want to buy, they usually sell first to take sellside liquidity and vice versal. This is why the indicator become importan

What is VWAP? The Volume Weighted Average Price (VWAP) is a trading benchmark that reflects the average price of a security, weighted by volume, over a specific time period. It helps traders identify fair value and is used widely in intraday trading to assess price action relative to institutional trading levels. Key Features of Anchored VWAP PRO Anchored Calculation : Unlike traditional VWAP that resets daily, your indicator allows users to anchor VWAP to specific time frames or key points (e.g

The Breakaway Fair Value Gap (FVG) is a typical FVG located at a point where the price is breaking new Highs or Lows.
USAGE Figure 1 In the figure 1, the price range is visualized by Donchian Channels.
In theory, the Breakaway FVGs should generally be a good indication of market participation, showing favor in the FVG's breaking direction. This is a combination of buyers or sellers pushing markets quickly while already at the highest high or lowest low in recent history. Figure 2 Whi

Hello good people this is The Rangers Fx We have released indicator for Sniper entries it gives most signals on the lows and on the highs then other signals it's for continuation This indicator it's not complicated you only follow signals that are shown on the screen which is blue arrow for buy and red arrow for sell Timeframe is M15 (15 minutes) This indicator works on currencies,indices,cryptocurrencies,stocks,volatility index,step index etc as long as it's meta trader 5 this indicator will wo
JESUS CROSS Indicator by Damion Description: The MA Crossover indicator is designed to alert traders when two moving averages cross on a 30-minute chart. It uses a Fast Moving Average (10-period) and a Slow Moving Average (21-period) to detect crossovers, which are commonly used as signals for potential trend changes. Key Features: Fast and Slow MA : The indicator employs a 10-period Fast Moving Average (FastMA) and a 21-period Slow Moving Average (SlowMA). Customizable Settings : Users can req

Are you looking for precision and reliability in your trading strategy? This non-repainting indicator is designed to elevate your trading game by providing entry signals aligned with the current trend direction, offering a powerful edge for traders of all styles. Key Features: Dual Signal Modes for Ultimate Flexibility :
1️⃣ Swing Trading Mode : Ideal for longer trades. Hold positions with confidence and target higher profit potential.
2️⃣ Scalping Mode : Designed for quick trades with minim

The ABC Indicator analyzes the market through waves, impulses, and trends, helping identify key reversal and trend-change points. It automatically detects waves A, B, and C, along with stop-loss and take-profit levels. A reliable tool to enhance the accuracy and efficiency of your trading. This product is also available for MetaTrader 4 => https://www.mql5.com/en/market/product/128179 Key Features of the Indicator:
1. Wave and Trend Identification: - Automatic detection of waves based on mov

Detailed Explanation of Using the Indicator for Bitcoin Trading 1. Understanding the Indicator The indicator uses moving averages and ATR (Average True Range) to detect trends and generate buy/sell signals. This is similar to Trade Sniper except designed for BTC 2. Setting Periods for Different Time Frames Configure the indicator with periods suitable for each time frame. Here’s a suggested table for periods and ATR-based stoploss/take profit settings: Time Frame PERIOD Stoploss Take Profit 1
The Advanced Price Level Alert is a powerful price monitoring tool designed for traders who need reliable and customizable price level alerts. This professional-grade indicator combines visual price level tracking with sophisticated alert mechanisms to keep you informed of significant price movements.
Key Features:
Customizable Alert Frequencies - Choose from 6 different alert frequencies (1-20 alerts per minute). Multi-Channel Notifications - Receive alerts through desktop, mobile push notifi

Market Interest Indicator : Your Comprehensive Edge in Trading
Key Benefits: Quantifies real-time market participant engagement and sentiment Blends pure price action and volume dynamics for a comprehensive analysis Reveals hidden market sentiment beyond traditional technical indicators Adaptable across multiple timeframes and asset classes Provides early warning signals for potential trend shifts Dual-Component Functionality: The Market Interest Indicator features two distinct components
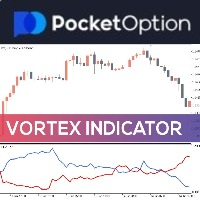
Vortex Indicator with Alert System for MT5 Overview
The Vortex Indicator with Alert System is a trend-following tool designed to help traders identify market direction and momentum shifts. This MetaTrader 5 (MT5) indicator analyzes positive and negative vortex movements (+VI and -VI) and generates buy and sell crossover signals with visual markers and customizable alerts. Directional Momentum Detection: Tracks +VI and -VI crossovers for trend confirmation. Crossover Alerts: Notifies traders of

Trend Compass: All-in-One Trend Tracking The Trend Compass indicator is a sophisticated yet user-friendly trading tool designed for both novice and experienced traders. By combining multiple technical analysis approaches into one comprehensive package, it eliminates the need for multiple indicators cluttering your charts. Key Features: Multiple analysis modes including VSA for effort/result evaluation Dynamic trailing stops using fractal levels Seven color visualization options for clear market

3D Bars Oscillator - Market Trend Visualization Indicator Brief Description 3D Bars Oscillator is an innovative MetaTrader 5 indicator that provides a unique three-dimensional view of market trend dynamics using advanced Renko and smoothing algorithms. Key Features Visualization Technology : Three-dimensional representation of market trend Adaptive Algorithm : Trend calculation based on Renko blocks Flexible Configuration : Full control over indicator parameters Technical Specifications Version

Master Support & Resistance Trading with Precision LevelGuard SmartSMA leverages the power of moving averages to help you trade confidently across markets. Designed to identify dynamic support and resistance levels, this EA delivers precise trade entries and exits, empowering traders to capitalize on market movements with ease. How It Works Core Strategy: Uses a central SMA (e.g., 50 or 200-period) as a dynamic support or resistance line.
Additional SMAs (optional) provide stronger confirmation

# ZigZag RSI with Dynamic Trendlines and Multi-Level Alerts
## Overview The ZigZag RSI indicator is an advanced technical analysis tool that combines the power of RSI (Relative Strength Index) with ZigZag pattern detection and dynamic trendline analysis. It helps traders identify potential trend reversals, support/resistance levels, and provides automated alerts for multiple trading scenarios.
## Key Features - Combined RSI and ZigZag pattern detection - Dynamic swing high/low identification

The ATR Trade System is a sophisticated trading tool designed for active traders seeking precise entry and exit points based on market volatility. This system combines adaptive trend identification with dynamic support and resistance levels, making it suitable for any trading instrument and timeframe. Key Features: Adaptive trend detection with color-coded signals Multiple volatility modes (Tight to FOMC) for different market conditions Higher timeframe trend analysis for better context Customiz
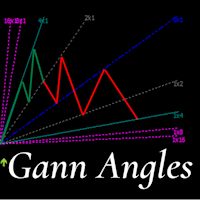
This indicator is, without a doubt, the best variation of the Gann Angles among others. It allows traders using Gann methods to automatically calculate the Gann angles for the traded instrument. The scale is automatically calculated when the indicator is attached to the chart. When switching timeframes, the indicator recalculates the scale for the current timeframe. Additionally, you can enter your own scales for the Gann angles. You can enter your own scales either for both vectors or for each

Visual EMA CrossPro - Your Ultimate Trading Companion! Are you ready to enhance your trading strategy with a powerful yet easy-to-use tool? Introducing the Visual EMA CrossPro, an intelligent indicator designed to help traders identify precise market entry and exit points based on EMA crossovers. For just $65, you get access to a reliable solution to simplify your trading journey. How It Works:
The Visual EMA CrossPro leverages two key EMAs (Exponential Moving Averages) to identify trends and p

The Visual EMA MultiFlex Indicator is designed to enhance your decision-making by combining the power of three Exponential Moving Averages (EMAs). Whether you're a beginner or an experienced trader, this tool helps identify precise market entries and exits. How It Works:
The Visual EMA MultiFlex Indicator leverages Short, Medium, and Long EMAs to analyze market momentum and confirm trend direction: Short EMA – Captures quick market shifts. Medium EMA – Smooths out short-term fluctuations. Long

A Logarithmic AO indicator has been created for fans of trading on large timeframes
The standard AO indicator takes into account the price change, not its percentage ratio. If we translate the indicator into a logarithmic scale, we will see that often the indicators of the logarithmic driving force differ from the indicators of the driving force in the usual scale. This difference is visible on large timeframes.
On small timeframes, this is still the same standard AO indicator
Update added

A Logarithmic AС indicator has been created for fans of trading on large timeframes
The standard AС indicator takes into account the price change, not its percentage ratio. If we translate the indicator into a logarithmic scale, we will see that often the indicators of the logarithmic driving force differ from the indicators of the driving force in the usual scale. This difference is visible on large timeframes.
On small timeframes, this is still the same standard AС indicator
This indica

The Visual EMA PriceSync Indicator is a cutting-edge trading tool designed to synchronize price action with EMA (Exponential Moving Average) trends. It helps you identify precise market entry and exit points, making it an essential tool for any trader. What does it do?
The indicator detects crossover signals between the price and EMA, which signify potential trend reversals or market corrections. These signals are displayed directly on your chart with clear and vibrant buy (lime green) and sell

The Visual EMA ReversalScout Indicator combines a powerful EMA crossover strategy with RSI-based divergence detection to generate reliable buy and sell signals. Its advanced logic ensures robust and actionable market insights while maintaining flexibility for optimization. Strategy Breakdown EMA Crossovers: Uses Fast EMA and Slow EMA to identify trend directions and reversals. Bullish signals arise when the Fast EMA crosses above the Slow EMA, indicating an uptrend. Bearish signals occur when t

Visual EMA SignalLine Pro – Your Ultimate Trading Companion Experience a smarter, more precise approach to trading with Visual EMA SignalLine Pro! This powerful indicator simplifies complex market analysis, allowing you to focus on what matters most: profitable trading decisions. Available now for just $65, this tool is your gateway to mastering trends, identifying entry and exit points, and managing trades like a pro. How Does It Work?
The Visual EMA SignalLine Pro combines the power of Expone

Adaptive Reversal Star is a new generation indicator with an advanced Adaptive algorithm , which additionally tracks potential reversal points and compares the values of the current market volatility when forming the main signals of the indicator.It provides accurate signals in real time without delays and redraws.Adaptive Reversal Star does not require any complex settings and additional calculations, just set it to the desired timeframe and select the parameter - Signal Filter. Why choose

VisualEMA TrendForce Indicator — Empower Your Trading with Precision Price: $65
Discover a Smarter Way to Trade with EMAs! The VisualEMA TrendForce Indicator is designed to elevate your trading with a reliable and visually intuitive trend-following system. Leveraging the power of Exponential Moving Averages (EMAs), this indicator provides actionable buy and sell signals based on dynamic market conditions, enabling traders to capture profitable trends with confidence. Core Features: Dynamic EMA

Visual CrossPulse Indicator - Revolutionize Your Trading! Take your trading to the next level with the Visual CrossPulse Indicator, a cutting-edge tool designed for precision and ease. This indicator combines powerful technical analysis with user-friendly features to identify profitable market opportunities effectively. What Makes Visual CrossPulse Special?
The Visual CrossPulse Indicator is a hybrid strategy tool that integrates the MACD (Moving Average Convergence Divergence) and an optional
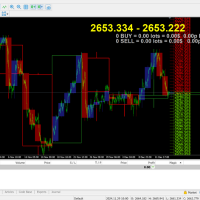
Hi Traders. The Multi Time Frame (LargeTimeFrame) Candle Indicator is a technical analysis tool used in trading that allows traders to view candlestick patterns from multiple time frames on a single chart. By combining data from different time frames, this indicator helps traders identify trends, reversals, and potential entry or exit points, offering a more comprehensive view of market activity. It aids in confirming signals by providing insights from shorter and longer time frames, helping tra

This indicator is designed to detect and display Support and Resistance levels on a chart based on pivot point calculations. The levels are drawn as horizontal lines on the chart, indicating significant price points where price may reverse or consolidate. The indicator is created by identifying pivot highs and pivot lows over a specified number of bars (candlesticks), and drawing lines for each detected level. Key Features Support and Resistance Levels : Resistance lines are drawn based on detec
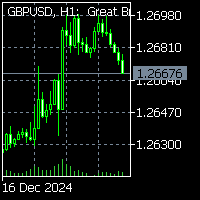
To get access to MT4 version please click here . This is the exact conversion from TradingView: "Exit-Willy Alerts" by " barrettdenning ". This is a light-load processing and non-repaint indicator. All input options are available. Buffers are available for processing in EAs. You can message in private chat for further changes you need. Thanks for downloading

The MR-Score Probability Indicator is a powerful tool designed for traders seeking an edge in identifying overbought and oversold conditions. It calculates the statistical MR-Score of price movements, providing an intuitive measure of how far the current price deviates from its historical average. Additionally, it computes the probability of price movements using the cumulative normal distribution, helping traders assess market conditions with confidence. Key Features MR-Score Calculation: Meas
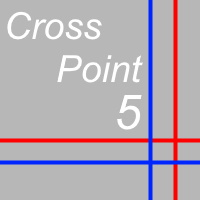
CrossPoint5 is an indicator that helps novice traders.
In addition to the standard "Crosshair" function (Ctrl + F), CrossPoint5 will show you how to set the StopLoss and TakeProfit levels correctly, taking into account the minimum allowable level, calculate the number of points between two points and convert this into the currency of the account, taking into account the expected lot of the transaction.
Sometimes, when opening a deal, a novice trader completely forgets about the spread.
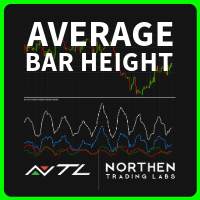
ABH - Candle Component Analysis - User Guide Overview and Features The ABH - Average Bar Height indicator is designed to help traders analyze market volatility and identify potential buy and sell signals by measuring the average size of each candlestick component over a specific period. The indicator calculates and displays four lines representing different candlestick metrics. By analyzing these values, traders can interpret market strength, volatility, and potential trend changes. Beyond

How to Add a Product Description (MetaTrader Market) To add the product description effectively in MetaTrader's Market, follow these steps: 1. Log into the MetaTrader Market: Go to your MQL5 account . Navigate to the "Seller's Dashboard" or "Products" section. Select your product, DuhokTrend . 2. Writing the Description: To enhance the product's rating, write a detailed and structured description : Template for Product Description:
DuhokTrend - Advanced Indicator for Trend Analysis Overview:

High Low Mid Daily Weekly Revolutionize Your Chart Analysis with Precision Levels! High Low Mid Daily Weekly is a powerful and intuitive indicator designed for traders seeking to elevate their technical analysis. This indispensable tool automatically plots the key price levels of the current day and week directly on your chart, ensuring you never miss crucial support and resistance zones. Key Features: Daily and Weekly Levels : Instantly displays today’s and this week’s High , Low , Mid levels

This indicator is for scalpers who want to make profit from recovery and retracements. As a scalping indicator, you won't win big but small and steady profits. How to use this? Open a stop buy order if the price close below the "Recovery" at the recovery price with a TP at the "Expected recovery". It's best to use with an EA to open orders automatically closing at the current "Expected recovery" instead of setting a TP. Doing so will ensure orders will close no matter where the price go without

오메가 지지 및 저항 저가 매수, 고가 매도 전략에 대한 고유한 지표 반전 유형 항목은 가격이 전체 길이 선까지 상승함에 따라 가격이 회전/스윙/반전할 것으로 예상합니다. 주간 설정의 경우 4시간으로 1~5분 차트를 거래할 수 있고, 장기 설정의 경우 일일로 m15 이상, 주간으로 1시간 차트를 거래할 수 있습니다. 주간, 일일, 4시간, 심지어 1시간 차트에 대한 모든 제품의 고가 또는 저가에 대한 고정밀 미래 가격 예측기 특정 수준의 진입을 피하려면 SonicR 컬러 바 표시기 또는 이와 유사한 것을 사용하는 것이 가장 좋습니다. 비디오를 시청하여 방법과 이유를 알아보세요. MT4 버전은 무료이므로 지원이 제공되지 않습니다. MT5 고객만 지원을 받을 수 있습니다. 영상과 자세한 내용은 곧 공개됩니다! 특징 고유한 지지 및 저항 가격 수준 기록의 일수 제한 선, 색상 변경을 위한 입력 용법 이 지표는 거래에만 사용하거나 다른 전략과 결합하여 사용할 수 있습니다. 예상 목표 및 전

Very easy to follow buy and sell indicator for Gold, Crypto and Forex. Just follow the signal with risk management. Good for both novice as well as expert traders. Once you get to use to using with this then you know how to use to for consistent winning. Make sure to combine proper risk management with proper position sizing. Green for buy and red for sell on the chart.
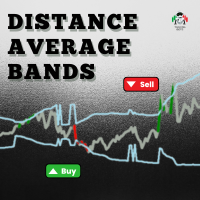
A very assertive and easy-to-view indicator, which can be used in any financial asset.
This indicator aims to show moments when the average price deviation in relation to the average deviation exceeds the configured standard deviation.
Step 1: We measure the distance between the price and the average configured in the "MAPrice" parameter;
Step 2: We calculate the average "MADistancePeriod" of the distances measured in Step 1.
Step 3: We calculate the standard deviation "Deviation" from th

Overview In the fast-paced world of forex and financial markets, quick reactions and precise decision-making are crucial. However, the standard MetaTrader 5 terminal only supports a minimum of 1-minute charts, limiting traders' sensitivity to market fluctuations. To address this issue, we introduce the Second-Level Chart Candlestick Indicator , allowing you to effortlessly view and analyze market dynamics from 1 second to 30 seconds on a sub-chart. Key Features Support for Multiple Second-Level
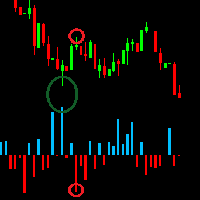
The Tick Volume Balance indicator is created based on the tick volumes of the instrument on the selected timeframe, taking into account the trading balance of supply and demand prices.
The indicator considers the nature of candle formation used in the Price Action strategy. With equal volume, a regular candle and a candle with a pattern will have a larger size and will be colored according to its pattern. I would like to note that large volume candles colored in bullish and bearish colors at t
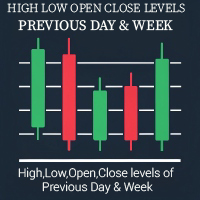
Revolutionize Your Chart Analysis with "Previous Daily Weekly HLOC Levels"! The Previous Daily Weekly HLOC Levels indicator is a must-have tool for traders who want to sharpen their technical analysis. This intuitive and powerful indicator automatically plots the High, Low, Open, and Close levels of the previous day and week on your chart, giving you a clear view of critical support and resistance zones. Key Features: Daily and Weekly Levels: Effortlessly displays the High, Low, Open, and Clos
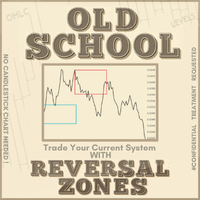
I'll keep it Short and to the point. Let Your Backtest Results Speak for Themselves. After much deliberation, we’ve decided to release the foundational logic behind our process for public use.
This isn’t about changing the way you trade—because we know that’s unique to you. The best ways to enter a position? Those have always been confidential ! What we can share is the first of three essential steps we use before entering any trade. This tool is designed to keep you on the right side of the m

Introducing to your attention the unique trading system/indicator "Scaled Vidya Trends", designed for dynamic scalp trading on trend volatility pairs hour + timeframes.
Main features of Scaled Vidya Trends:
-Multi-level market analysis: it works on H1, H2, H3 timeframes; -Uses the most popular currency pairs: EURUSD, GBPUSD, USDCAD. Brokers usually set one of the lowest spreads for these pairs; -Applies a scalping method based on local targets for signals; -Signals appears at the new open of

The Easy Trend Trading Indicator delivers quick and accurate BUY/SELL signals, ensuring that traders can make timely decisions. It works flawlessly across various timeframes and supports all symbols, making it a versatile tool for any market. Whether you're trading short-term or long-term, this indicator adapts to your needs with ease. Quick Setup: Simply "Enable" the indicator via input settings With a low memory footprint, the indicator is designed for efficiency, ensuring smooth performance e
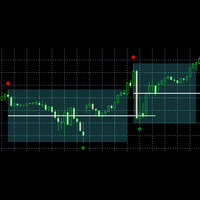
Based on concept of Zones from DTFX.
Video 2
Daves suggest using a length of 25 for optimal performance. But it's up to you to decide based on backtest/forwardtest results.
How this indicator draw zones
In bullish scenario, first it will find a swing high, then a swing low, then a break of with price closed above the swing high. But the way it find swing high and low heavily depends on structure length value. If you set structure length as 12: to find swing high it will check 13th candle high

Overview "L3 Counter Peacock Spread" is a comprehensive technical analysis indicator for MetaTrader 5, developed by Blackmill Solutions UG. It employs a sophisticated combination of multiple moving averages, K-lines, and weighted analysis to provide traders with a robust set of visual tools for market analysis. Key Features Multiple Moving Average Analysis Combines short and long-term moving averages (MA1, MA3, MA10, MA30) Utilizes both Simple Moving Averages (SMA) and Weighted Moving Averages

Volume Weighted Average Price (VWAP) is a measure that combines price and volume data to reflect the average price at which a security has traded throughout a specific period. This indicator calculates the VWAP based on your selected timeframe and plots it on the main chart. It automatically identifies new sessions for the chosen timeframe and resets the calculation accordingly, ensuring that the displayed VWAP remains current. Use VWAP MTF to observe areas where trading activity is concentrate

This indicator computes a rolling version of the STARR Ratio (Stable Tail Adjusted Return Ratio) over a specified number of bars and plots both the STARR Ratio and its Moving Average (MA). Unlike some original STARR Ratio implementations, this adaptation uses a rolling window of logarithmic returns and calculates Conditional Value-at-Risk (CVaR) at a given confidence level. By comparing the rolling average return to the magnitude of CVaR, it provides a metric for how returns stack up against wor
Introducing to your attention unique trading advisor, Squeeze roc xau points, exclusively designed for trading on the XAU/USD pair. We analyzed predominantly all objectively important timeframes and identified unique characteristics of gold movements relative to the dollar to create this product. These insights can be extremely useful in predicting market reversal points on timeframes from M30 to H8 for the XAU/USD pair. You can choose your favorite timeframe to receive signals or use multiple
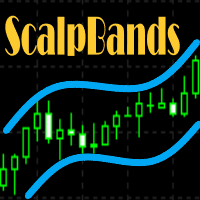
This indicator is designed for scalping Gold, BTC, US30, GBPUSD, and can also be used on any financial instrument. It does not repaint, erase past signals, and it is not lagging. The indicator is a combination of two well-known indicators: Bollinger Bands and TD Sequence. It has a relatively high win rate; however, it is not a complete system and should be used in conjunction with other indicators to filter noise, increase the win rate, and is intended for experienced scalpers. Always set reaso

Take the stress out of trading with the Buy Sell Chill Indicator —your ultimate companion for effortless trend identification. This easy-to-use tool gives you a clear visual arrow to show the direction the market is about to take, making trading decisions as simple and "chill" as possible. Why Choose the Buy Sell Chill Indicator? Relaxed and Intuitive : Designed to make trading less stressful and more enjoyable by giving you straightforward signals with no clutter. Customizable Features : ATR Pe

Four MA on OBV - 성공적인 거래를 위한 궁극의 가이드! Four MA on OBV 인디케이터로 거래의 진정한 잠재력을 발휘하세요. MetaTrader 5 플랫폼을 위해 독점적으로 설계된 이 강력한 인디케이터는 네 개의 이동 평균선과 On-Balance Volume (OBV)을 결합하여 정확하고 신뢰할 수 있는 신호를 제공합니다. 기술적 특징: 네 개의 이동 평균선: 간단한, 지수, 평활, 선형 이동 평균선의 통합으로 상세한 추세 모니터링. OBV 분석: 가격 변화 전에 거래량 변화를 감지하여 이상적인 진입 및 종료 지점 식별. 사용자 정의 설정: 거래 전략에 따라 매개변수를 조정하여 더 큰 유연성과 통제력 확보. 실시간 알림: 중요한 변화에 대한 즉각적인 알림을 받아 신속하고 정보에 입각한 조치 가능. 주요 혜택: 신호 정확도: 고급 가짜 신호 필터링으로 최고의 기회만 제공. 사용하기 쉬움: 초보자와 경험 많은 거래자 모두에게 적합한 직관적인 인터페이스. 수익

Mtf Candle – An Advanced Tool for Your Trading Strategy Analyze the market, identify trends, and enhance your strategy! Mtf Candle is an innovative indicator designed for professional traders, offering a clear and structured way to visualize market dynamics. With this tool, technical analysis becomes structured and easily accessible. What Does Mtf Candle Offer? In-depth Bar Analysis – Monitor bars across multiple timeframes and determine whether they indicate an uptrend or downtrend. Precise St
Introducing to your attention a unique trading advisor "Detrended scalper jpy points" indicator, designed for trading with major JPY crosses.
The idea is based on a modified indicator, detrended price oscillator, whose task is to eliminate the influence of the trend on price movements. This greatly simplifies the process of determining overbought/oversold cycles. The focus is on analyzing short cycles: long market cycles consist of several short ones. By analyzing the short components, we can
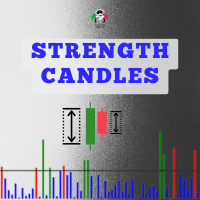
Indicator in histogram format, which is calculated using data on financial volume, tick volume and the body of the bar.
It is possible to visualize moments where there was a large entry of volume, both financial and in ticks, and that the market managed to progress and advance in one direction (up or down) due to the size of the bar body, which is where there really was a victory for one side of the negotiation (buyers and sellers).
By default, all bars in the indicator's histogram are colore
The Moving Average indicator remains one of the most popular tools in trading due to its simplicity, adaptability, and effectiveness in identifying market trends. Its role as a foundational tool for other technical indicators further cements its importance in both traditional and modern trading strategies.
The Multi MA indicator has 8 Moving Averages which can be plotted simultaneously using a unique set up of each MA.
Make Your Trading Simple dan Profit Again !
MetaTrader 마켓은 거래 로봇과 기술 지표들의 독특한 스토어입니다.
MQL5.community 사용자 메모를 읽어보셔서 트레이더들에게 제공하는 고유한 서비스(거래 시그널 복사, 프리랜서가 개발한 맞춤형 애플리케이션, 결제 시스템 및 MQL5 클라우드 네트워크를 통한 자동 결제)에 대해 자세히 알아보십시오.
트레이딩 기회를 놓치고 있어요:
- 무료 트레이딩 앱
- 복사용 8,000 이상의 시그널
- 금융 시장 개척을 위한 경제 뉴스
등록
로그인
계정이 없으시면, 가입하십시오
MQL5.com 웹사이트에 로그인을 하기 위해 쿠키를 허용하십시오.
브라우저에서 필요한 설정을 활성화하시지 않으면, 로그인할 수 없습니다.