MetaTrader 5용 기술 지표 - 51

The Trend Complete indicator is a signal indicator and has interesting properties. It should be taken into account that this indicator reflects extremes and should be used as an additional one, and another instrument should be used for the entry point. Searches for and displays pivot points on the price chart. Trend indicators are one of the main tools for analyzing trends in the Forex market. The indicator is able to transmit all types of signals to the user: messages, E-mail and Push!
The g
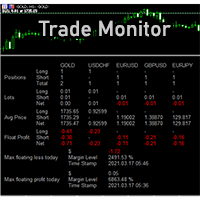
DSProFx Trade Monitor (iExposure) gives you detail information of all trades in your account including total positions, lot size, average price level (Breakeven Level), floating profit, and today's maximum profit/loss. The display is simple. Each data will be separated for every symbol/chart. This indicator will help you monitoring your trades especially if you are working with multiple symbols/charts and open many orders. Just attach DSProFx Trade Monitor in one chart, and it will show all deta

Fundamental Signals Indicator is a Non-Repaint Indicator with a powerful calculation engine that can predict market movement over 3000 pips (30000 points). The indicator does not analyze the market fundamentally, it is named fundamental because it can predict trends with large movements, no complicated inputs and low risk. Also Indicator can alert on market trend changes.
Using Indicator :
The Indicator is very simple and without complicated input parameters. (No need to optimize anythin

VR Pivot is an indicator of key pivot points. Pivot points are a special type of support and resistance levels that are used to determine the strongest price zones. Professional traders use pivot levels to determine prices at which there is a high probability of a price reversal. The levels are calculated using special mathematical formulas, which include the closing, opening, high, and low prices of the previous time period. The most effective is the daily period. It is important to note that a
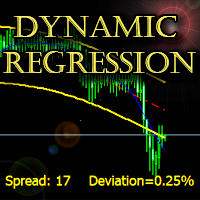
The indicator builds a dynamic regression channel with high accuracy without lagging.
Channel deviation is calculated using a unique formula and displayed on the graph.
Support: https://www.mql5.com/en/channels/TrendHunter
Can be used on any timeframe and any instrument. MT4-version: https://www.mql5.com/en/market/product/64252 Can be used as a ready-made trading system, as well as an addition to the existing one.
Settings: Fast Period - Fast smoothing period; Slow Period - Slow s

A breakout of a trend line, as well as a high or low, usually signals a change (or continuation) of the trend. This indicator displays lines at the highs and lows of the price, as well as finds and displays inclined trend lines. As soon as the price goes beyond the line and the candlestick closes, the indicator signals this with an arrow (you can also enable alerts). This indicator is easy to use, however, there are many trading strategies that are based on trendline breakouts. The number of ca
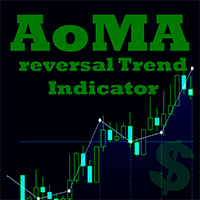
AoMA is an indicator based on analytical geometry calculations, where the average price angle of a given period is calculated.
Being a powerful indicator of reversal points and supports, supports and resistances become objective with the formation of well-defined "plateau" areas.
It can be used for trend monitoring and the anticipation of trend reversal points.
Two levels of periods are available, a short and a long one, and period crossings can be used as indicative of buying and selling

Ichimoku Map (instant look at the markets) - built on the basis of the legendary Ichimoku Kinko Hyo indicator.
The task of the Ichimoku Map is to provide information about the market strength on the selected time periods and instruments, from the point of view of the Ichimoku indicator. The indicator displays 7 degrees of buy signal strength and 7 degrees of sell signal strength.
The stronger the trend, the brighter the signal rectangle in the table. The table can be dragged with the mouse.
T
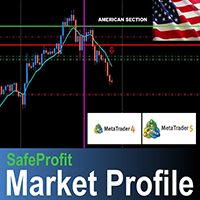
The SafeProfit Market Profile is the most advanced tracking indicator in the Forex Market. It was developed to track the market profile of each session of the day: Asian, European and American. With this indicator you will operate Intraday smiling ... knowing exactly where the Big Players are positioned and the exact moment where they are going to. The indicator is simple, fast and objective, tracking every movement of the Big Players in price. Get out of the 95% statistic that only loses and us

Setup 9.1 strategy created by the North American trader Larry Williams . SIMPLE setup, effective, with a good level of accuracy and excellent return. Attention : The Demo version only works on the tester, if you are interested in running it in real time, please contact me and I will provide another version. Buy Signal:
Exponential moving average of 9 (MME9) is falling, wait it to TURN UP (in closed candle). Place a buy stop order 1 tick above the HIGH of the candle that caused the turn to occur

Trend and Signals MT5 indicator scans 30 trading Instruments (Forex, Metals and Indices). It uses special algorithm on the current market based on Pure Price Action and display the overall trend and signal on the dashboard. When signals are produced the indicator sends alert and notification. Strategy for Signals This indicator uses the daily timeframe to determine the direction of the trend. The hourly timeframe is used to identify possible entries. Main trend and is determined by
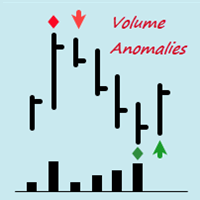
Индикатор VolumeAnomalies показывает аномальное поведение цены при увеличении объема. Эти аномалии могут привести, как минимум, к торможению и, как максимум, к развороту Рынка. Индикатор VolumeAnomalies включает в себя 3 варианта аномалий: 1. Support and Resistance - Поддержка и Сопротивление. При увеличении объема (усилия) уменьшается результат (расстояние между закрытиями баров/свечей). 2. Attenuation UP and DOWN - Затухание вверх и вниз. При увеличении объема (усилия) результат не соразмере
----< High Accuracy Entry Signals and Trend Indicator >----
TrendEntry could tell you the trend direction, resistance and support, when to open orders and where to set stoploss & takeprofit. this is a multifunctional indicator, can work well on all symbols and timeframes.
Features:
real-time analysis of trend direction filter out all the minor waves show resistance and support along as price goes give highly accurate entry signals frequently send alert in popup, email, notification way a
Statistical Spread Indicator.
An indispensable tool for every trader. Suitable for both manual and algorithmic trading.
Key indicators:
maximum - the maximum value of the spread for the specified period medium - average value of the spread for the specified period minimum - minimum spread value for the specified period current - the current value of the spread It can be used on absolutely any trading instrument. This indicator shows the spread limits for a specified period.
You ca
Fractal 358 + Caixote
This 'two in one' indicator combines Caixote , a graphic pattern that defines entries, and Fractal 358 , a new way to read and forecast price movements on chart, that shows both exits and threats to operations in the mini-index (WIN) and B3 shares.
Operational Strategy
This indicator can be used with almost any asset and period, but it is more assertive with some than others. By default, it is configured for the Brazilian B3 mini-index (WIN). User can adjust only one p

Se você já ouviu falar do Método de Wyckoff, Análise de dispersão de volume, etc., com certeza chegou até aqui para buscar o indicador que lhe faltava!! Nosso indicador é capaz de lhe mostrar a dispersão de volume negociado pelos grandes players durante todo o período de negociação!
E o grande diferencial deste tipo de abordagem é a capacidade que este indicador possui de lhe mostrar onde está armado o "ACAMPAMENTO" dos BigPlayers e, assim, tirar o melhor proveito em seus trades, entrando jun

"2nd To NoneFX Scalper" is one powerful indicator which you can use on any timeframe. The accuracy is in between 90% - 95% can be more. The indicator is 100% non repaint so it doesn't repaint at all. When the arrow comes out wait for the candlestick to close the arrow won't repaint/recalculate or move. The indicator works with all volatility indices,step index, Boom & Crash(500 & 1000) and all currency pairs. You can change settings of the indicator. For great results find the trend of the pair,
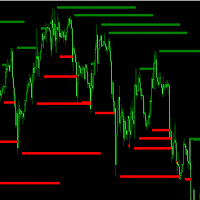
Previous High and Previous Low in the charts usually forms an area of interest for trading on the chart. Price usually move quickly then stall around these areas. This indicator identify Bars which are highest or lowest of the surrounding bars and extend a line out to visualize it. Extend line for how many bars: Define how many bars to extend the bars to the right of the extreme bar. Width of Extreme: Define how many bars it should be the highest/lowest to the left and right of the bar Keep line
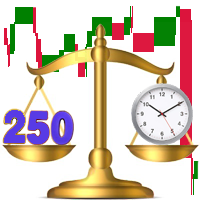
The indicator displays a stock chart of a non-standard type, in which the price and time have the same value.
The usual chart of Japanese candlesticks does not take into account all the information that the time analysis can give. Renko charts do not use all the information that price can give in relation to time. The "Chart Price and Time" indicator takes into account price and time equally and shows the predominance of price or time.
Taking into account price and time equally gives an i

Speed indicator. Determines the speed of price movement. An indispensable tool for scalpers. Thanks to its high-speed qualities, we now have the opportunity to assess the current situation in the market and manage to enter a deal at the exact time. This indicator can be used absolutely on any timeframe, on any trading instrument and on absolutely any securities market. They can determine the rate of price movement for a specific period. Its settings also include an additional filter that dete

----< High Accuracy Trend Channel and Entry Signals >----
RSChannel could tell you the trend direction, resistance and support, when to open orders and where to set stoploss & takeprofit. this is a multifunctional indicator, can work well on all symbols and timeframes.
Features:
real-time analysis of trend direction filter out all the minor waves show resistance and support along as price goes give highly accurate entry signals frequently send alert in popup, email, notification way at e

----< High Accuracy Ichimoku Cloud Entry Signals >----
CloudEntry could tell you the trend direction, resistance and support, when to open orders and where to set stoploss & takeprofit. this is a multifunctional indicator, can work well on all symbols and timeframes.
Features: real-time analysis of trend direction filter out all the minor waves show resistance and support along as price goes give highly accurate entry signals frequently send alert in popup, email, notification way at every

The MaxMinTrend indicator displays the highs and lows of the price on the chart. This indicator was created to simplify the determination of trend directions, as well as to support open positions, by transferring Stoploss to the current highs and lows of the price, thereby making a large profit. This indicator is not redrawn.
Input parameters:
BarsCount - 1000 - Number of bars to draw the indicator
maxmin - true - Enabled display of Highs and Lows
line - true - Enabled display of the co
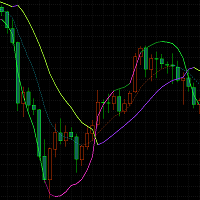
A cross - track indicator that visually shows the current bullish/bearish trend of the market through the midline (mid track), main line (upper track), and sub-lines (lower track). Intersections or upper rail turns can be used as buying and selling positions.
Parameter description: period:10 price: WEIGHTED //HIGH //LOW //OPEN //CLOSE //MEDIAN //TYPICAL //AVERAGE //WEIGHTED method:Linear weighted //Simple //Exponential //Smoothed // Linear weighted main offset:1.5 sub offset:1 base:2 counts ad

The Flat Horizontal Channel Range Price indicator automatically draws a horizontal channel (range) of prices on a higher or current timeframe. This indicator was developed to simplify the determination of sideways movements of the market, as well as to search for entry signals for a pullback from the boundaries of a channel (range) or for its breakdown.
Input parameters:
BarsCount - 1000 - Number of bars to search for a horizontal channel AutoPeriodDraw - true - Enabled automatic drawing of
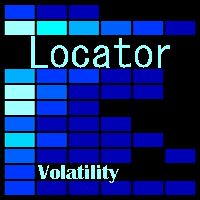
The indicator tracks sharp volatility (moments when the market has shown increased activity and movement may occur), on the selected instruments and time periods.
The information is displayed as colored rectangles. Thus, it is possible to assess at a glance which tool should be given priority attention.
The indicator will be useful for scalpers when they need a quick reaction or for traders working with a large number of instruments. The indicator does not redraw. The indicator displays 8 degr
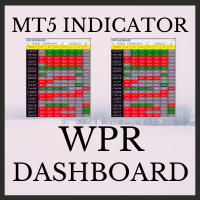
WPR Dashboard uses the value of William's Percent Range indicator. The parameters can be adjusted via the Edit boxes of this dashboard. The monitoring pairs will be selected by adding to the Market Watch (no need to set prefixes or suffixes) , you can monitor many pairs as you like. This dashboard will check almost popular time frame (M1,M5,M15,M30,H1,H4 and D1). The colors can be customized. We can have a look at many pairs and many time frames without opening the chart. In addition, we can

It is an indicator for high quality scalper signals that can be used in any timeframe.
The indicator has an alarm that can alert the trader to the trading starts, and has a proactive system that can be used to improve risk management and also to alert the trader in the trading starts.
The indicator suggests only entry point and take profit, leaving the stop loss to the trader's discretion, its recommended at the last top or bottom, or at a point in accordance with the risk management.
I
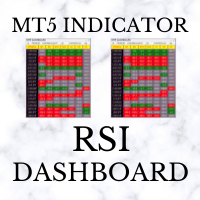
RSI Dashboard uses the value of Relative Strength Index indicator. The parameters can be adjusted via the Edit boxes of this dashboard. The monitoring pairs will be selected by adding to the Market Watch (no need to set prefixes or suffixes) , you can monitor many pairs as you like. This dashboard will check almost popular time frame (M1,M5,M15,M30,H1,H4 and D1). The colors can be customized. We can have a look at many pairs and many time frames without opening the chart. In addition, we can

One of the simplest Pivot Point indicator, easy to operate, and most complete for a single chart in determining Resistance and Support level lines.
In single chart, it will show R&S Level Line with 5 popular types of Pivot Point, Highest&Lowest of closing price Include the Trend and up to 3 Time Frames.
Five types (Floor, Woodie, Camarilla, DeMark, & Fibonacci) of popular Pivot Points in determining Resistance and Support levels. With just using simple button on th

Indicator shows buy/sell arrows depending on volatility factor. Indicator does not repaint! It works on any pair and any timeframe. It is well tested through strategy builders and shows quite interesting results as a good filter indicator and as independent signaler as well (check the screenshots). It is possible to search for a lot of interesting parameters for profitable trading, some of which are shown on the screenshots. There are next inputs in indicator settings: N-volatility period; Level

For those who need a Volume Profile / Market Profile indicator, here is the solution!
It contains the essential information:
Control Point (POC); Higher Value Area (VAH); Lower Value Area (VAL); You can choose to SHOW or NOT SHOW the volume Histogram, according to your wish. If you choose to show the histogram, note that according to the type of asset, it is necessary to adjust the scale of the indicator (last parameter of the indicator).
You can also choose from the data source of your h

6-BAND VWAP (Volume Weighted Average Price)
Fully customized and EA-friendly VWAP Bands Indicator.
Main Features:
Choose the period of VWAP calculation reset (Daily, Weekly or Monthly): For day trading use the Daily VWAP, and for longer term analysis use the Weekly or Monthly calculations. Choose how many bands (deviations) you want to show, up to 6. Choose zero to display only the main VWAP line. Fine adjustment of the deviation of the bands: Find the best band’s deviation for the in
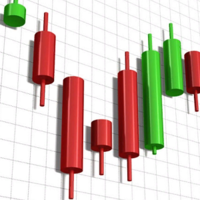
The indicator is designed to display candles (bars) of a higher timeframe on the current one. The indicator has many settings for the displayed candles, as well as a sound signal that will sound a few minutes (seconds) before the bar closes. Input parameters: BarsCount = 50 - the number of displayed bars of the higher timeframe Auto_Candle_UP_TF = false - Automatic selection of a higher timeframe Candle_UP_TF = PERIOD_H1 - Higher timeframe, if Auto_Candle_UP_TF = false Signal_Close_Candle_UP_TF

I am placing the indicator obtained as a result of market analysis, it may be useful to someone. The indicator shows how quickly the price changes (where there is a trend), and where there is no obvious trend. With the right settings, you can know the beginning of the trend in advance.
The indicator measures the slope / rate of change / ratio of the moving average on the current bar relative to the previous bar.
The settings specify the ratio limit for a downtrend and a ratio limit for an u

I present an indicator for professionals. Prof MACD is very similar to classic MACD in appearance and its functions . However, Prof MACD is based on completely new algorithms (for example, it has only one averaging period) and is more robust, especially on small timeframes, since it filters random price walks. The classic MACD indicator (Moving Average Convergence / Divergence) is a very good indicator following the trend, based on the ratio between two moving averages, namely the EMA

Automatic Support and Resistance Osw MT5
This Indicator graphs lines at the possible support and resistance points of the selected asset.
it works in multiple temporalities.
allows you to configure:
Color of the lines. Width of the lines. Type of lines. When the indicator begins its operation, it analyzes the supports and resistances of higher levels for the temporality in which it is working.
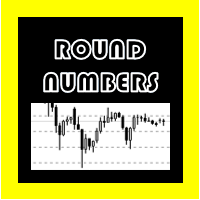
ROUND NUMBERS (For Metatrader 5)
This indicator allows you to add horizontal lines according to the round numbers that the asset contains.
Unlike other indicators, this one calculates the closest levels dynamically and automatically as the price moves.
works on currency pairs, indices, metals, stocks, etc.
Round with 5 digits, 3 digits and integers of 10 100 or 1000.
lines can be adjusted in parameters like:
Hide the line or round number that you do not want to display. line col
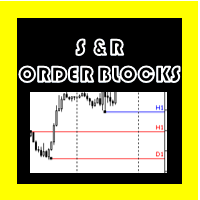
SUPPORT LINES AND RESISTORS + COMMAND BLOCKS for METATRADER 5
A much more pleasant visual way to locate supports and resistance, unlike normal horizontal lines, these can be located from a specific point, without extending backwards, making the graph not look good, it also shows the name of the temporality in which it was created so that when you are operating, you can know to which temporality it belongs.
You can also create order blocks in a comfortable and visual way, where you can also
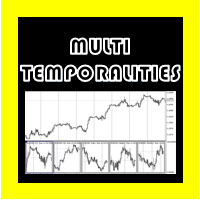
MULTI-TIMES FOR METATRADER 5
This indicator, in a lower window, shows the current chart in different timeframes, this can help you better decipher the market, taking into account the higher timeframes.
Among the settings that you can modify are:
view of prices in charts view of the temporalities in the graphs enable each of the graphics in the different temporalities (M1, M5, M15, H1, H4, D1, W1, MN1).
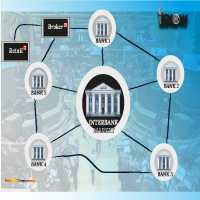
IPDA AND PD RANGES. Interbank Price Delivery Algorithm (IPDA) Range Liquidity and trades in the FX market take place in a decentralized manner as banks, brokers and electronic communication networks (ECNs) interact with one another to set prices. In FX, and ECN is a trading platform or electronic broker that hosts bids and offers and transmit them to users worldwide. ECN broadcasts a price around the world as various participants leave orders to buy and sell. Banks provide streaming prices base

The second indicator from the set for market analysis. The first one is here: https://www.mql5.com/ru/market/product/65258
The indicator draws a line by levels where the price reaches a aliquot of the value in the Step parameter. You can specify the spread of + - points from the required level.
All color settings, line types are customizable.
Example: Step - 500 Deviation - 20 If the symbol reaches the price for example 1.73500 + - 20, i.e. from 1.73480 to 1.73520, lines are being built.

The third indicator from the set for market analysis. The first one is here: https://www.mql5.com/ru/market/product/65258 The second one is here: https://www.mql5.com/ru/market/product/65347
The indicator builds a channel of maximum price fluctuations for a specified period. Additionally, the middle of the channel is drawn.
All color settings, line types are customizable.
The indicator allows you to see the picture of price movement from a slightly different angle. You can use several in

This indicator is based on a mathematical formula and an ANN combined, designed to make a model(using previous prices) of the most recent market condition (any chart*) in order to use the model as a forecasting tool. *This indicator can operate on any chart/timeframe, but it's suggested you use multiple timeframes for each trade because this method relies solely on the time factor, you can not use this indicator to predict price volatility, but if it's fit correctly it will show you when the nex
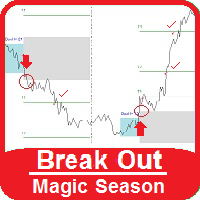
<< See how it works on YouTube >>
Possibilities:
Arrow signal to buy, sell and hit the targets Alert signal send mail Execute custom audio file The Break Out Magic indicator monitors price fluctuations over a set period of time (adjustable rectangle). Then, according to the maximum and minimum price, in the second rectangle, it determines the outline break lines. And sets 3 goals to exit from each side. In the settings we have:
Start Time: Start time of range
End Time: The end of range tim
Volume Levels is a very important indicator for exchange trading . At such levels, the majority of transactions were made. In the future, the price often bounces off such levels, and this can be successfully applied in trading. This indicator is able to determine the levels at which there was the most volume over the specified period of history. These levels are shown as lines, and the parameters for determining the levels are configurable. In addition to displaying, this indicator can inform th
Peanut Indicator This indicator indicates trend with thick blue and red LINE based on Golden cross, Dead cross, and MACD. You can adjust the number freely in parameter settings(MA Period, MACD Value). Thus, you can adjust this indicator to your trading currency type, period, and so on. This indicator's default number is suited for USD/JPY M30 or H1 trade. HOW TO USE GREEN LINE:RISE, BUY RED LINE:FALL, SELL Parameters(Customizable) MAPeriod1 (Short term) MAPeriod2 (Long term) MAC
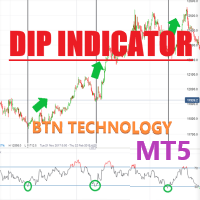
DIP Indicator Oshime DIP Indicator Oshime This indicator is based on Oshimegai(buying on the dips). This is based on Moving Average line so this indicator indicates the lines based on long term trend and short term trend. So this indicator is helpful when you trade with a short time flames. Therefore, you can find easily in M5 or M15 and M30 flame when you should get the positions of sell or buy. HOW TO USE Blue UP Arrow--Price will go up(You should get the position of BUY.) Pa
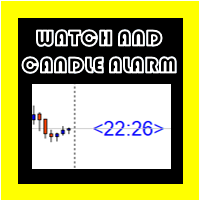
Osw Watch for METATRADER 5
This is an indicator that shows the remaining time for the current candle to expire on a watch, this is always located next to the last candle following the price, the numbers are shown the same as in the images, and can be modified both in size and color.
between your settings you can set:
the size of the numbers showing the time.
the color of the numbers showing the time.
Also within the configuration you can activate and deactivate so that an alarm sounds
Developed to assist in binary options retraction operations, this indicator will show the best assets to operate retractions!
How it works: The indicator will calculate the total length of each candle from low to high, the total of the body and total of shadows (up and down) and calculate a total shadows percentage of various configurable assets. The counter is updated with each new candle.
ATENTION: Demo on the estrategy tester is not functional to show other assets, but still can show how
Developed to assist in binary options retracement operations, this indicator will show the assets with the best retracement percentages!
How it works: The indicator will calculate the total length of each candle from low to high, the total of the body and total of shadows (up and down) and calculate a total shadows percentage of various configurable assets. The counter is updated with each new candle.
ATENTION: Demo on the estrategy tester is not functional to show multiple assets.

This indicator uses support and resistance, volume and some special formula to calculate the volume to filter the candles. If the volume reaches a specific value, And at the same time, Candle breaks the support/resistance line, There would be a signal and we can enter the market. Signals appear when the current candle closes. then you can enter the trade when a new candle appears. Please don't forget to follow your money management plan.
MT4 Version Support/Resistance Breakout MT4 : https

The Fúria indicator was developed to work when the market is in trend, that is, you will rarely see any signs in consolidation zones. It can be used for both Forex and Binary Options.
The signs plotted on the graph do not repaint or recalculate, even if you close and reopen your MT4 / MT5 they will be there.
Wait for the signal to set on the candle before you can enter the next candle.
==================================================
* BUFFERS: 0 (CALL) and 1 (PUT); * TYPE OF ENTRY: n

Looking for reliable levels on a price chart? Already tired of searching for similar indicators? Are the levels not working out as they should? Then this is the indicator for you.
Volume Prices Universal is a reliable indicator of horizontal volumes. What does it show? First of all, the main idea of the indicator is to display at which price mark the price has been for the longest time. Thus, the display of price volumes on the price chart is formed. With the help of which you can very simp

간단하면서도 효과적인 포지션 트레이딩 전략인 Order Blocks의 개인적인 구현. 가격 범위가 브레이크 아웃의 반대 방향으로 위반되지 않은 경우 거래자는 시장에 진입하거나 마지막 주문 블록 방향으로 거래를 찾아야 합니다. 명확성을 위해 열린 블록은 그려지지 않습니다.
[ 설치 가이드 | 업데이트 가이드 | 문제 해결 | 자주하는 질문 | 모든 제품 ] 강세 오픈 블록은 신시장 저점 이후의 첫 번째 강세 막대입니다. 약세 오픈 블록은 신시장 고점 이후 첫 번째 약세 막대입니다. 오픈 블록이 깨졌을 때 시그널이 나타나 오더 블록이 됨 오더블록이 반대편으로 깨지면 반전블록이 된다 표시기는 모든 종류의 경고를 구현합니다. 다시 칠하거나 다시 칠하지 않습니다.
입력 매개변수 기간: 새로운 고가 또는 저가를 생성하는 데 필요한 막대의 양입니다. 값이 작을수록 더 많은 신호가 발생합니다.
최소 ATR 필터: ATR의 승수로 표시되는 주문 블록 막대의 최소 본체 크기입니다. 최대 A

Mr Crypto Magic Lines is an indicator that draws very strong support and resistance lines, in which the price respects and changes its direction of movement. The generated signals can be used for trend or scalper operations. The indicator adapts to any financial asset and the desired graphic time as it considers the ATR indicator to measure volatility and identify trading signals.
It is possible to trade Forex, stocks, crypto, indices and any other assets on the metatrader
The configurati

VR Cub 은 고품질 진입점을 얻는 지표입니다. 이 지표는 수학적 계산을 용이하게 하고 포지션 진입점 검색을 단순화하기 위해 개발되었습니다. 지표가 작성된 거래 전략은 수년 동안 그 효율성을 입증해 왔습니다. 거래 전략의 단순성은 초보 거래자라도 성공적으로 거래할 수 있다는 큰 장점입니다. VR Cub은 포지션 개시 지점과 이익 실현 및 손절매 목표 수준을 계산하여 효율성과 사용 편의성을 크게 높입니다. 간단한 거래 규칙을 이해하려면 아래 전략을 사용한 거래 스크린샷을 살펴보세요. 설정, 세트 파일, 데모 버전, 지침, 문제 해결 등은 다음에서 얻을 수 있습니다. [블로그]
다음에서 리뷰를 읽거나 작성할 수 있습니다. [링크]
버전 [MetaTrader 4] 진입점 계산 규칙 포지션 개설 진입점을 계산하려면 VR Cub 도구를 마지막 최고점에서 마지막 최저점까지 늘려야 합니다. 첫 번째 지점이 두 번째 지점보다 빠른 경우, 거래자는 막대가 중간선 위에서 마감될 때까지 기다립
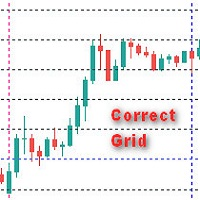
Общие сведения Индикатор отображает правильную сетку с задаваемым в параметрах шага в пунктах , что позволяет более точно визуально оценить масштаб и размер ценовых движений. Параметры индикатора
Step - шаг сетки в пунктах по вертикали Figure - шаг фигуры MaxBars - ограничение истории (0 - вся история)
Цвет вертикальных лини color new_day - Цвет новый день new_week - Цвет новая неделя new_mon - Цвет новый месяц
Цвет горизонтальных линий new_Hfigure - Цвет

Looking for reliable levels on a price chart? Already tired of searching for similar indicators? Are the levels NOT working out as they should? Then this is the indicator for you.
VPU Levels is a more advanced version of the Volume Prices Universal indicator. In this indicator, in addition to the histogram of horizontal volumes, the indicator itself determines the levels from which the user can work. The PeakLevel and Diffraction fields help to adjust the depth of reaction to the histogram an

SupportResistance is a dynamic support and resistance indicator based on the high and low of the previous candles.
The calculation parameters are configurable. You can use the maximum and minimum values of the previous candle as a reference, or you can use the maximum and minimum of a group of previous candles.
The indicator uses a red line to indicate resistance and a green line to indicate support.
When a support or resistance is broken, its line is dotted, being restored only when it b
This indicator show several candle patterns. Very useful to learn and to trading some stocks or forex.
The supported patterns are: bullish spinning top, bearish spinning top, bullish marubozu, bullish force, bearish marubozu, bearish force, bullish kicker, bearish kicker, bullish engulfing, bearish engulfing, bullish harami, bearish harami, piercing line, dark cloud cover, morningstar, evening star, bearish abandoned baby, bullish abandoned baby, three white soldiers, three black soldiers, mo

This indicator marks the relevant volume levels among the day. The two relevant levels are the candle with more volume and the period with more volume of lots transacted.
The filled red background is the range of price with the most relevant volume of the day (probably the big player that is command the game). The purple lines shows the range of price with most volume (probably a area where some big player is accumulating before force a market direction). There is also the dot lines that mark
Big promotion! , prices are now on discount , get your copy now The Rubdfx Price Tracker that is used to show price price bound , the price almost never goes out of the channel and most of the time price will react when it touches the channel limits .It determines the best highest and lowest prices at which you can sell and buy respectively Suitable for scalping & swing trading It Draws arrows that appear after a candle close , The arrows indicate bullish or bearish pressure For bearish an
This indicator shows the candles with the highest volume in the market, based on a period and above-average growth percentage. It is also possible to activate the "Show in-depth analysis" functionality that uses algorithms to paint the candles with the probably market direction instead of painting based on the opening and closing positions.
EA programmers: This indicator does not redraw.
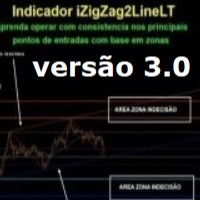
- iZigZag2LineLT
New version 3.0 of the iZigZag2LineLT indicator where it is possible to search for possible exhaustion regions of the market looking for small or large reversals, it follows the same characteristics contained in the indicator of the LTB and LTA lines, Fibonacci, Supports and Resistances with the application of Market Undecided zones (improved version of Stop or Move by Sato´s), in these areas suggestions (through the dotted lines) appear to include pending orders always looki
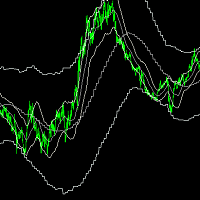
inp_timeframe: Set Timeframe of indicator MA Parameters: (Same as standard moving average indicator) inp_MA_period, inp_MA_shift, inp_MA_method, inp_MA_price: Moving Average Period, Moving Average Shift, Moving Average Method, Moving Average Price Please take note that using a MA_shift of 0 will result in a different result when the indicator is reloaded for higher time frame This indicator only accepts shift>0 This is due to the indicator showing the current time moving average and atr at the c
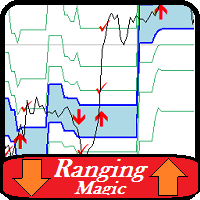
This is a powerful indicator that is very easy to work with. Its default setting is for the euro-dollar pair, but with the right settings it can be used in all markets and all time frames less than daily. The basis of the work of the Ranging indicator is to find areas of price range and get signals from it. You can specify the duration of the valid sufferings and the minimum and maximum price in it. It is also possible to determine the number of reliable signals received from each range.
Othe
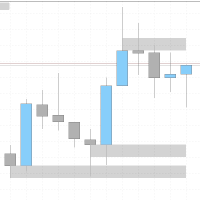
I created an indicator inspired by the "Wicks don´t lie" community on Youtube. It let's you see zones from other timeframes, and lets you keep a zone from a higher timeframe when you go to lower time frames. It operates by creating zones wherever the price has previously turned and not been retested again. This makes it easier to know where to expect a possible hick-up while going with a breakout, or where the price might make a reversal. The indicator also continues to add zones out from the cu
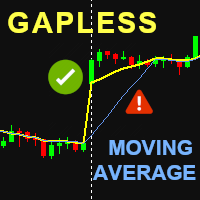
Gapless Moving Average (GMA)
Improved version of standard Moving Average (MA) from MetaTrader library which provides the possibility to eliminate the 'gaps' between candle sticks which distort the average values mainly during the N ('period') initial candles after market opens due to the spread ('gap') between closing price from previous day and opening price from the next day. The greater these 'gaps' are, the more divergent the standard MA is in order to indicate the current price trend

Complete indicator that collects all results from your MT5 trading account. It a ggregates your past trading performance , displays historical price ranges. It also shows key market information, like swaps, current market spread on chosen instrument, floating P&L, number of trades, drowdown etc. Check out the below video presentation.
If you are interested in more of my products, do not hesitate to PM me.
MetaTrader 마켓은 개발자들이 거래 애플리케이션을 판매할 수 있는 간단하고 편리한 사이트이다.
제품을 게시하고 마켓용 제품 설명을 어떻게 준비하는가를 설명하는 데 도움이 됩니다. 마켓의 모든 애플리케이션은 암호화로 보호되며 구매자의 컴퓨터에서만 실행할 수 있습니다. 불법 복제는 불가능합니다.
트레이딩 기회를 놓치고 있어요:
- 무료 트레이딩 앱
- 복사용 8,000 이상의 시그널
- 금융 시장 개척을 위한 경제 뉴스
등록
로그인
계정이 없으시면, 가입하십시오
MQL5.com 웹사이트에 로그인을 하기 위해 쿠키를 허용하십시오.
브라우저에서 필요한 설정을 활성화하시지 않으면, 로그인할 수 없습니다.