MetaTrader 5용 기술 지표 - 45
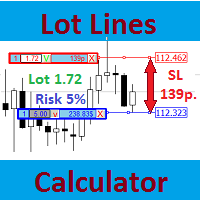
Большинство профессиональных трейдеров декларируют строгое соблюдение управления рисками. Этот простой инструмент разработан для быстрого расчета размера лота, чтобы торговать в соответствии со следующими базовыми правилами риск-менеджмента: Максимально допустимый риск устанавливается как фиксированный процент от общего количества средств на счете (например, 1-2%). Риск измеряется расстоянием в пунктах между открытием ордера и установленным стоп-лоссом. Так как для новичков всегда затруднительно
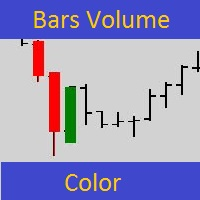
Все знают какую большую роль играют объемы в трейдинге. Основной индикатор объемов чаще всего находится в дополнительном окне и визуально плохо воспринимается. Этот простой инструмент разработан для быстрого и наглядного представления заданного объема непосредственно на графике с котировками для лучшей наглядности. Можно сразу оценить в каких местах на графике сконцентрировались большие объемы. Индикатор подкрашивает свечи по заданному объему от хая или лоу свечи до цены закрытия свечи. Если све

The QRSI indicator is one of the most important and well-known indicators used by traders around the world. All signals are generated at the opening of the bar. Any closing price or zero bar prices are replaced with the corresponding price of the previous bar in order to avoid false results. This indicator is suitable for those who are interested in the classic calculation method but with improved functionality. There is a version for both MT4 and MT5.
By its nature, the QRSI indicator is an
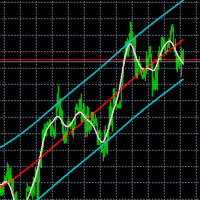
Flex channel - indicator plots channel using Hodrick-Prescott filter. Hodrick-Prescott filter is the method of avreaging time series to remove its cycling componets and shows trend. Settings HP Fast Period - number of bars to calculate fast moving average
HP Slow Period - number of bars to calculate slow moving average
Additional information in the indicator Channel width - channel width in pips at first bar MA position - fast moving average position in the channel in persentage
Close positio
Binary Options Assistant (BOA) KAM Signals Indicator provides signals based on gkNextLevel Binary Options Strategy. Indicators: 3 Moving Averages & Stochastic
Stop missing trades, stop jumping from chart to chart looking for trade set-ups and get all the signals on 1 chart! U se any of the BOA Signals Indicator with the Binary Options Assistant (BOA) Multi Currency Dashboard . All BOA Signal Indicator settings are adjustable to give you more strategy combinations. The signals can be seen v

Melhor regra de coloração pra RENKO no MT5. Lucre de forma simples no mercado Brasileiro e também no Forex. Gatilhos precisos, indicando ótimos pontos de compra e venda no mercado.
Pode ser utilizado no Mini Dólar e Mini índice Pode ser utilizado no mercado Forex.
O indicador contém a regra de coloração aplicada ao RENKO.
O indicador permite a alteração dos parâmetros: período e tamanho do renko
O indicador permite a alteração das cores dos renkos.

MQL4 has also been converted to MQL5 exposure info for friends using iexposure. It shows the total number of positions that have been opened, how many buy or sell positions there are, the net amount of position numbers and their order prices, the profit and loss status of all total positions. I didn't write their code, it's open source, but I wanted to share it with everyone because it's an indicator I like!
https://www.mql5.com/en/charts/14801856/usdjpy-fix-d1-idealfx-llc

This is an indicator for MT5 providing accurate signals to enter a trade without repainting.
It can be applied to any financial assets: Forex Cryptocurrencies Metals Stocks Indices It will provide pretty accurate trading signals and tell you when it's best to open a trade and close it. How do I trade with the Entry Points Pro indicator? Buy and install the indicator in your terminal Start trading by receiving signals from the indicator telling you about the ideal moment to enter a trade.

MT5에 대한 표시기 "HLC_bar_MT5 Wyckoff"는 거래 시 분석을 용이하게 하기 위해 생성되었습니다. HLC Bar는 Richard Wyckoff가 사용했으며 현재 "VSA" 작업에서 널리 사용됩니다. Wyckoff는 High, Low 및 Close를 사용하면 그래프가 훨씬 더 명확하고 분석하기 쉽다는 것을 발견했습니다. 표시기 "HLC_bar_MT5 Wyckoff"는 다음을 허용합니다. # 막대 너비를 변경합니다. # 막대를 같은 색으로 둡니다. # 그리고 같은 가격으로 열리고 닫힌 바를 강조 표시합니다. 색상과 너비는 설정에서 쉽게 수정할 수 있습니다. 지표를 사용하려면 차트로 끌어다 놓기만 하면 됩니다. Wyckoff는 볼륨과 함께 사용할 때 HLC 차트를 막대 그래프라고 불렀습니다.
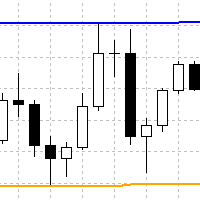
Indicator finds swing highs and lows, which are located between x bars to the left and y bars to the right. It plots such high and lows in form of continuous lines. Here is description of inputs. High Left Length - count of bars to the left for finding of swing high High Right Length - count of bars to the right for finding of swing high Low Left Length - count of bars to the left for finding of swing low Low Right Length - count of bars to the right for finding of swing low

MT5 세그먼트 거래량 표시기는 가격 및 거래량 분석, VSA, VPA, Wyckoff Method 및 Smart Money System을 사용하여 거래하는 사람들을 용이하게 하기 위해 만들어졌습니다. 분할된 거래량은 모든 시장(Crypto, CFD, Forex, Futures, Stock...)에서 작동하며 모든 차트 시간에서 작동합니다. 당신의 해석이 얼마나 쉬운지 보십시오: #녹색: 시장 평균보다 훨씬 높은 거래량 #다크핑크 : 평균보다 큰 볼륨 #파란색: 양의 정상 볼륨 #빨간색: 음의 정상 볼륨 #핑크: 낮은 볼륨 #노란색: 초저용량 MT5 분할 볼륨 표시기는 틱 볼륨 또는 실제 볼륨에서 사용할 수 있습니다. 스마트 머니의 움직임을 읽는 데 도움이 되어 의사 결정을 용이하게 합니다.

VZO Plus is an indicator that shows overbought and oversold regions based on traded volume. #When the indicator line is between -40 and -60 it is oversold #When the indicator line is between 40 and 60 it is overbought.
Outside these regions, the market is following its natural path by inertia. Above the green line, it means that the market is positive, Another way to analyze the indicator is through divergence regions. When we have the bottom higher than the other in a downtrend or One botto

The VSA Smart Money indicator tracks the movement of professional traders, institutional trades and all compound man movements. The VSA Smart money Indicator reads bar by bar, being an excellent tool for those who use VSA, Wyckoff, PVA and Any other analysis that uses price and volume. There are 10 indications that you will find in your Chart: *On Demand *Climax *UT Thrust *Top Reversal bar *Stop Volume *No Supply *Spring *Reversal Bottom *Shakeout *Bag Holding Using this indicator you will be o

Infinity Indicator MT5 1.0 Panel Asset Rate % EURUSD 96.0% GBPUSD 94.1% AUDCAD 90.5% USDCHF 87.8% BTCUSD 78.4% Panel Win Rate based on CandleMT4 Exit Button Calculates the StdDev standard deviation indicator on the RSI data, stored in the matrix similar to the keltner. input int HourCalculate = 12; RsiLength = 5; RsiPrice = PRICE_CLOSE; HalfLength = 4; DevPeriod = 100; Deviations = 0.9; UseAlert = true; DrawArrows = true; TimerWork=300; LevelUp = 80; LevelDown = 20; MoreS

Bollinger Prophecy is a multicurrency trending tool for technical analysis of financial markets. Draws 3 lines on the chart that show the current price deviations of the currency pair. The indicator is calculated based on the standard deviation from a simple moving average. The parameters for the calculation are the standard double deviation and the period of the moving average, which depends on the settings of the trader himself. A trading signal is considered when the price exits the trading c

The JAC Trend Indicator for MT5 was created to facilitate the identification of the market trend in an easy and agile way. # When JAC Trend indicator is green , we have a pre-trend to uptrend market. # When JAC Trend indicator is Red we have a pre-trend to downtrend market. # When JAC Trend indicator is gray , we have a sideways market without strength. That way you have all the sides that the Market can go to in a clear and objective way.

TB5 Channel is a multi- timeframe channel indicator. It generates input points on different timeframes. There are 2 methods for constructing an indicator. The first method is to install the indicator on the current timeframe. In this case you will have a channel on that timeframe that you have at MT5. The second method to install an indicator is to multiply it by the timeframe index. The point of the second method is to construct a higher timeframe channel on the current chart. For example, i

In finance, Z Scores are measures of the variability of an observation and can be used by traders to help determine market volatility. Z scores tell Traders whether a score is typical for a specified dataset or is atypical. Z scores also enable analysts to adapt scores from multiple datasets to make scores that can be more accurately compared to each other. # In practice, we have the ZScore with zero point and oscillations between 2 and 3 for ultra high high points and oscillations between -2 an

BetterVolumeTick it is a volume indicator. It marks the volume regions where there was a great aggression, also shows the volume intensity. Yellow means low volume, normal activity. Orange means activity with a pretty amount of volume. Red means ultra high volume. This indicator combined with the price chart will give you another view of the market context.

Descriptions
A point point is a technical analysis indicator, or calculations, used to determine the overall trend of market over different time frames. This indicator calculate the highest or lowest pivots among left x and right y bars and show the high/low level during that period. From that, you could clearly see the top resistance & bottom support level and how market goes break out.
Instructions
pivotLeft - pivot left bar count pivotRight - pivot right bar count pivotHighColor - c

Market Fractal Analysis, Fractal Swing, Market Flow Fractal Cycles looks for Similar Patterns in the Market that repeat themselves because of the Market Fractal Nature. These patterns are displayed with help of Graphical Objects and Alerts can be received on their arrival. Read the Blog for full information. Features:- Auto Detection of Patterns Customization for Color and Line Styles Alerts, Emails & Push Notifications

After forming a New Structure High the market will retrace creating a higher low. When this movement occurs, that NSH's now become an area of structure called resistance . As price action pushes up from the newly created higher lows, that resistance level becomes the last stand for sellers to stop the buyers from rallying.
IF the resistance level cannot be penetrated, THEN it's likely that we'll see either a period of consolidation or a reversal in trend. IF price action breaks through

볼륨 방향 MT5
일반적으로 현재 볼륨이 이전 볼륨보다 높을 때 볼륨 표시기의 기본 색상 변경이 있습니다. 중요하지만 그다지 유용하지는 않습니다.
이러한 이유로 이 지표는 정상적인 볼륨 외에도 양초가 강세 또는 약세일 때 다른 색상으로 칠하도록 만들어졌습니다. 기본적으로 강세는 파란색이고 약세는 빨간색이지만 이러한 색상은 사용자 정의할 수 있습니다. 상인의 취향.
귀하의 거래를 개선하는 데 도움이 될 다른 지표를 확인하는 것을 잊지 마십시오. 볼륨 방향 MT5
일반적으로 현재 볼륨이 이전 볼륨보다 높을 때 볼륨 표시기의 기본 색상 변경이 있습니다. 중요하지만 그다지 유용하지는 않습니다.
이러한 이유로 이 지표는 정상적인 볼륨 외에도 양초가 강세 또는 약세일 때 다른 색상으로 칠하도록 만들어졌습니다. 기본적으로 강세는 파란색이고 약세는 빨간색이지만 이러한 색상은 사용자 정의할 수 있습니다. 상인의 취향.
귀하의 거래를 개선하는 데 도움이 될 다른

A powerful oscillator that provide Buy and Sell signals by calculating the investor liquidity. The more liquidity the more buy possibilities. The less liquidity the more sell possibilities. Please download the demo and run a backtest!
HOW IT WORKS: The oscillator will put buy and sell arrow on the chart in runtime only . Top value is 95 to 100 -> Investors are ready to buy and you should follow. Bottom value is 5 to 0 -> Investors are ready to sell and you should follow. Alert + sound will app
MT5용 통화 강도 지표 는 초보자 또는 전문가 트레이더를 위한 혁신적인 솔루션입니다! 8개 주요 통화의 일반적인 28개 조합을 제외하고 가격 조치와 결합하고 모든 기호/쌍에 적용할 수 있기 때문에 통화 강도 개념을 완전히 새로운 수준으로 끌어 올렸습니다. 즉, 모든 통화, 주요 통화, 마이너 통화 및 외래 통화, 상품 및 암호화폐(인덱스 제외)를 포함하여 모든 통화 쌍의 장단점을 거래할 수 있습니다. 복잡한 스트렝스 라인을 해독하거나 복잡한 스트렝스 라인을 해독할 필요 없이, 어떤 쌍의 2개 부분의 강약 균형을 시각적으로 알려주는 컬러 막대를 사용하여 한 번에 32개의 기호에 대한 명확한 통찰력을 제공하는 진정한 획기적인 제품입니다. 다른 전통적인 통화 강도 솔루션에서와 같이 히스토그램.
MT5용 통화 강도 표 시기는 가장 관심을 갖고 가장 거래하고 싶은 쌍을 추가하여 32개의 기호 버튼을 개인 취향에 맞게 구성할 수 있는 옵션을 제공합니다. 이렇게 하면 한 번의 보기로 차트
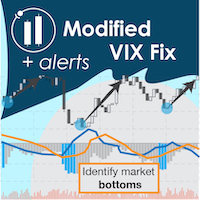
"The VIX Fix is a powerful indicator that detects market bottoms for any asset " The VIX (volatility index) is a ticker symbol of implied volatility of the S&P 500, calculated by the Chicago Board Options Exchange. VIX is a popular measure of market risk, and is one of the best measures of market bottoms that currently exists. Unfortunately, it only exists for the S&P 500... The VIX Fix was published by Larry Williams in 2007, and it synthesizes a VIX volatility index for any asset (not j
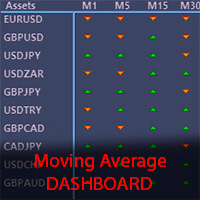
The Moving Average Dashboard indicator allows you to see the relationship between a fast and a slow moving average.
This indicator is working on multiple symbols and up to 21 timeframes. It's allows you to configure the fast and slow moving averages to whatever period, method or price is appropriate
The Moving Average Dashboard saves you time as you can use the indicator to scan multiple currency pairs or other symbols in just one window.
Installation Download the Indicator in your MT5 te

50+ Candlestick Patterns, Simulated Trading Results, Top Five Performers Candle Analysis extends Candlesticks Pattern Analysis by not only identifying Patterns but also recording the Past Performance of the Patterns. What it Does:- Identifies and plots results on chart Displays Top Patterns for both Bullish and Bearish type. Log can be printed in experts tab to see Simulated Trading results Displays All or Selected Patterns Alerts on Pattern formation More detailed information in Blog
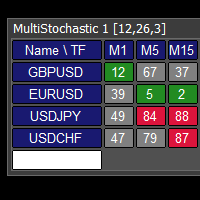
This tool monitors Stochastic indicators on all time frames in the selected markets. Displays a table with signals to open a BUY trade (green) or SELL trade (red). You can set the conditions for the signal. You can easily add or delete market names / symbols. If the conditions for opening a trade on multiple time frames are met, you can be notified by e-mail or phone message (according to the settings in MT5 menu Tools - Options…) You can also set the conditions for sending notifications. The li

This tool monitors MACD indicators on all time frames in the selected markets. Displays a table with signals to open a BUY trade (green) or SELL trade (red). You can set the conditions for the signal. You can easily add or delete market names / symbols. If the conditions for opening a trade on multiple time frames are met, you can be notified by e-mail or phone message (according to the settings in MT5 menu Tools - Options…) You can also set the conditions for sending notifications. The list of
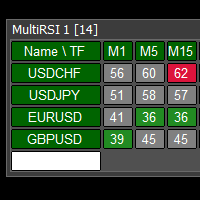
This tool monitors RSI indicators on all time frames in the selected markets. Displays a table with signals to open a BUY trade (green) or SELL trade (red). You can set the conditions for the signal. You can easily add or delete market names / symbols. If the conditions for opening a trade on multiple time frames are met, you can be notified by e-mail or phone message (according to the settings in MT5 menu Tools - Options…) You can also set the conditions for sending notifications. The list of s
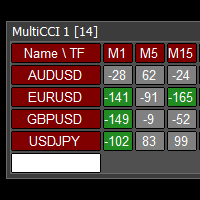
This tool monitors CCI indicators on all time frames in the selected markets. Displays a table with signals to open a BUY trade (green) or SELL trade (red). You can set the conditions for the signal. You can easily add or delete market names / symbols. If the conditions for opening a trade on multiple time frames are met, you can be notified by e-mail or phone message (according to the settings in MT5 menu Tools - Options…) You can also set the conditions for sending notifications. The list of s
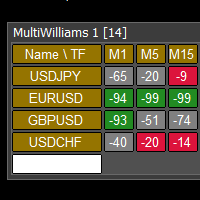
This tool monitors WilliamsPR indicators on all time frames in the selected markets. Displays a table with signals to open a BUY trade (green) or SELL trade (red). You can set the conditions for the signal. You can easily add or delete market names / symbols. If the conditions for opening a trade on multiple time frames are met, you can be notified by e-mail or phone message (according to the settings in MT5 menu Tools - Options…) You can also set the conditions for sending notifications. The li
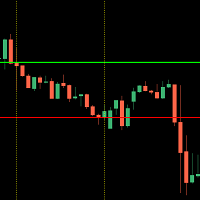
This indicator shows you the higher high and lower low of a certain period of time.
It is easy to use - select your desired time frame (current, 15Min, 1H, 1D) and the corresponding number of candles.
The indicator measures the highest and lowest point within the specified range and automatically draws the two corresponding lines.
The design of the lines is up to you!
Should the trend break one of the drawn lines with a closed candle, a message will be sent to you by the built-in alarm f

Trend Everest MT5 indicator is a trend following indicator that aids in decision making. It is based on the calculation of ATR that assist and the average hull. A key issue is that the Trend Everest MT5 nominee does not repaint, so you can backtest with greater confidence. When it is Green, UpTrend When it is a Red downtrend. Not that the Market is fractal, so the longer the graphic time, the greater its degree of assertiveness.

Looking for a quality pivot point indicator? So Prosecution is what you need! To identify pivot points, the Prosecution indicator analyzes many conditions, as the aggregate analysis provides a more accurate picture of the market situation.
What are pivot points? Pivot point analysis is often used in conjunction with the calculation of support and resistance levels, as is the case with trend line analysis. When analyzing pivot points, the first support and resistance levels are calculated
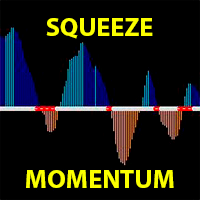
TTM Squeeze Momentum is a volatility and momentum indicator introduced by John Carter of Trade the Markets (now Simpler Trading), which capitalizes on the tendency for price to break out strongly after consolidating in a tight trading range.
This derivative Squeeze Momentum indicator attempts to identify periods of consolidation in a market. In general, the market is either in a period of quiet consolidation or vertical price discovery. By identifying these calm periods, one has a better oppo

Price reach indicator. It also serves as the perfect term for supports and resistance. I use it in two experts. The basic tool for professional trading. The indicator analyzes the last 500 bar and uses this to determine the levels ( but it doesn't predict the future ) . Personally, I use it on TF H1. It is very simple. Four lines on chart and that's all. Only two input parameters. Thousands of indicators. Why this? Is good ? No! Is very good. Please test the indicator prior to purchasing. You

가격 채널은 현재 시장 상황을 분석하기 위한 트레이더의 주요 도구입니다. 그것의 도움으로 미래의 가격 행동을 성공적으로 예측할 수 있지만 이익을 내는 주요 요소는 시기 적절한 결정입니다. 모니터를 지속적으로 보는 것이 불가능하기 때문에 이것은 종종 문제입니다. 이 표시기는 서로 다른 기간(빠른 것과 느린 것)으로 두 개의 추세 채널을 자동으로 구축하고 업데이트합니다. 추세는 선형 회귀를 사용하여 결정됩니다. 직접 구축할 수 있는 1개의 맞춤 채널을 사용하는 것도 가능합니다. 표시기는 채널을 백분율 영역으로 나눕니다. 관심 영역을 백분율로 지정할 수 있습니다. 가격이 이 영역에 도달하면 알림을 받게 됩니다. 이 표시기의 흥미로운 기능은 다이버전스 신호를 수신한다는 것입니다. 이는 가격이 기간이 다른 반대 채널 영역에 있을 때입니다. 이것은 강력한 신호입니다. "shift" 매개변수는 채널을 구축할 때 스몰 포워드를 정의합니다. 다음 유형의 알림을 사용할 수 있습니다. 이메일, 푸시 알

Это классический вариант реализации экспоненциальной скользящей средней с коррекций ошибки, какой используется в индикаторах DEMA и TEMA. Соответственно названию, глубина коррекции ошибки увеличена до 33. Индикатор оптимизирован. Потребляет минимально возможные ресурсы. Достаточно быстр, учитывая объёмность вычислений. Может накладываться на другие индикаторы. Как и обычные скользящие средние, nEma_33 не перерисовывается (за исключением нулевого бара). Требуется история > Период*33*33. Согласно
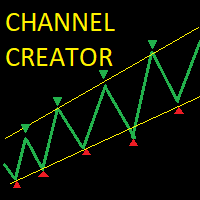
The auto-channel indicator creates a top line and bottom line that encloses a channel within which the symbol has been trading. The channel is created by finding high points for the top line and low points for the bottom line, these points are shown with arrows. A line of best fit is then plotted through these points and extended until the end of the chart. This indicator is useful for trading both within the channel and for breakouts. Inputs: MAPeriod - The moving average period over which the
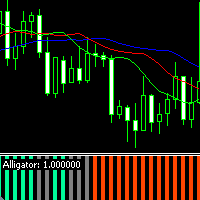
The modified Alligator indicator is designed as an oscillator. Facilitates the analysis of the Alligator indicator values by signaling the trader about market changes using a colored histogram. Histogram color values
Medium Spring Green - uptrend Orange Red - downtrend Gray - lateral movement (flat) Parameter values jaw_period - jaw period teeth_period - teeth period lips_period - lips period jaw_shift - jaw shift teeth_shift - teeth shift lips_shift - lips shift ma_method - method for calcula

The indicator connects the price in a cyclical-wave relationship. Thus, all intersection points will be optimal points at which the movement changes taking into account the indicator period. Crossing points can be used as potential market reversal points. But do not forget that the approach must be complex, the indicator signals require additional information to enter the market.
Suitable for forex, futures and binary options without redrawing. It gives a lot of signals, which requires additi
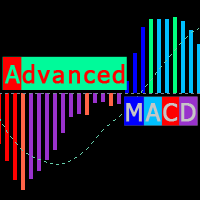
Modified MACD, for technical analysis of charts, with color backlight of histogram signals. The indicator highlights, the direction of the histogram movement, the change in the direction of the histogram movement, the histogram peaks, the interaction of the histogram and the signal curve. Also, the indicator makes it easier to find convergences / divergences between bars and the histogram (which serve as a powerful signal in some trading systems using the MACD indicator). Color designation of Ad

Clear Dom
This Indicator shows a pressure color box based on depth of market of the current symbol. Notice that it only works when book information is received.
You decide weather you want or not to display higher (ask) and lower (bid) levels of book.
The proportion ratio is calculated using volumes read from the book. You can read the actual pressure in the market any time.
Indicator parameters: color_Ask -> ASK box color and ASK value line color color_Bid -> BID box color and BID valu

This indicator shows supports and resistences calculated form historical data when market was swing. When market was swing ? When ADX was below 25 for some bars. In fact market can be considered without a trend. I mean and suggest timeframes H4 and Daily. Using that lines in the present you see resistance and support. More lines are distant and best is possible profit. Every ADX parameters can be set, so colors, swing market bars number.
I am available to get feedback or modify code. Thanks Al

이 표시기는 현재 기간에서 더 높은 기간의 투영을 구축합니다. 유색 양초 형태의 시각화. 시장 내 프로세스와 규모 및 역학을 더 잘 이해하는 데 도움이 됩니다. 이 모든 것이 영감의 원천이 될 수 있으며 성공적인 거래 전략을 찾는 올바른 길로 이어질 수 있습니다. 표시기는 촛대 패턴 검색을 단순화합니다. 매개변수가 다른 여러 지표를 활성화하고 동시에 많은 기간을 볼 수 있습니다. 설정에서 양초의 각 방향과 너비의 색상을 변경할 수 있습니다. 지표는 거래 고문과 함께 도구로 사용할 수 있습니다. 시간 프레임 옵션 - 현재 시간 프레임보다 커야 합니다. 그렇지 않으면 표시기가 시작되지 않고 오류가 보고됩니다. 아래는 다양한 모드와 테스터에서 작동하는 방법을 보여주는 비디오입니다. 중요한! 표시기가 아무 것도 그리지 않으면 시간대 매개변수가 잘못 선택되었거나(현재 매개변수보다 커야 함) 터미널에 선택한 시간대의 기록이 없는 것입니다. 그것을 로드하려면 이 기간의 차트를 열고 모든 것이

1. What is this Rising volatility and falling volatility are not the same, whether it is academic research or actual testing has shown this point. The original ATR indicator is calculated by putting up and down fluctuations together. This indicator is to calculate separately the upward volatility and the downward volatility, which can better help you study the market.
2. Indicator description There are two modes for the calculation of this indicator, as shown in the f
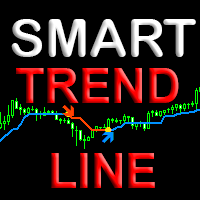
Индикатор с уникальным авторским алгоритмом определения направления тренда. Показывает лучшие результаты определения тренда на любых валютных парах, акциях, криптовалюте без перерисовки результата. Имеет встроенную статистику, что поможет сразу определить прибыльность текущей пары и таймфрейма. Использует паттерны Price action в связке с уникальным алгоритмом фильтрации. Подходит как новичкам так и профессионалам для всех видов торговли. Как выбрать прибыльный таймфрейм и оптимизировать индикато

Stochastic Cross Arrow is an indicator that automatically places arrow when stochastic K and D line crosses each other on a certain level.
Buffer Guide For Developers: Buffer 0 =Buy Arrow Buffer 1 =Sell Arrow Inputs: ---Stochastic Settings--- %K - %K value. %D - %D value. Slowing - Slowing value . Stochistic Method - Moving Average method. It can be any of enumeration values. Newbar - arrow only appear on new bar. Buy_Msgs - type info message when buy arrow appears. Sell Msgs - type inf
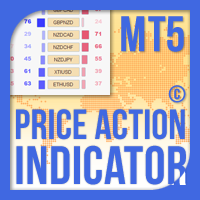
가격 조치 표시기 MT5는 지정된(기본적으로 8개) 과거 양초의 순수한 가격 조치 데이터를 기반으로 모든 기호/상품의 구매/판매력 수준 균형을 계산합니다. 이는 지표 패널에서 사용할 수 있는 32개 기호/상품의 가격 움직임을 모니터링하여 가장 가까운 시장 심리를 제공합니다. 60% 이상의 매수/매도 수준은 특정 기호(기본 설정 사용)를 매수/매도할 수 있는 매우 견고한 수준을 제공합니다. 가격 행동 표시기 MT5에는 가격 행동에 대한 표준, 빠르거나 느린 근접에 사용할 수 있는 3가지 계산 모드가 있으며 실시간 움직임에 더 날카롭거나 부드러운 적응을 위해 조정 가능한 가격 행동 초를 제공합니다.
가격 조치 표시기 MT5는 가장 눈여겨보고 거래하고 싶은 쌍을 추가하여 32개의 기호 버튼을 개인 취향에 맞게 구성할 수 있는 옵션을 제공합니다. 이렇게 하면 한 번의 보기로 차트의 현재 시장 심리를 전체적으로 볼 수 있기 때문에 기회를 절대 놓치지 않을 것입니다. 또한 현재 시간 프레

The Pirates MACD is a Momentum Indicator that shows us not just the Classical MACD, it also shows us high priority trades. the user has an option of selecting among several options the best settings that suits their trading style, even if one has no trading style, Pirates always find a way to survive hence the Pirates MACD is equipped with easy to understand tools. that reduce the strain on ones analysis giving them visual advantages over classical MACD techniques.
This product is made as an
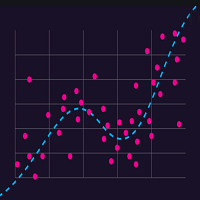
The Regression Channel consists of two lines equidistant above and below the regression trend line. The distance between the channel boundaries and the regression line is equal to the deviation of the maximum closing price from the regression line, only this definition corresponds to the most recent regression points.
The term regression refers to the field of statistics. The center line of the channel is the trend line. To calculate it, the method of least squares is used. The line above the

The utility helps to locate in the lower time frames the maximum and minimum of the upper time frame. The length of time frame level line represents the temporal length of the upper time frame. It's possible to OnOff the levels with a button or keys
The indicator draws lines that delimit the upper time frames candle and highlights his high-low price and the pips candle range. How it works:
Firstly . Choose which time frames levels to represent in the lower ones : monthly, weekly, da
Unlike a standard moving average, trendy traders unique algorithm will show you a less choppy signal resulting in a smoother and easier trend to follow thereby making your trading decisions more confident. Put simply when price moves above the average it signals a bullish trend and when price moves below the average it signals a bearish trend. The trader is then given 2 levels of take profit and a stop loss on each new signal. It can also be added to other trend-following systems for better pe

속도로 백테스트 및 최적화
Impulse Pro 표시기는 단일 차트에 여러 시간대 피보나치 분석을 표시하도록 설계된 강력한 피보나치 표시기입니다.
경고 기능으로
코드는 MT4 및 MT5 모두에서 더 빠른 백테스팅 및 최적화를 위해 최적화되었습니다. 양방향 거래 또는 분석이 가능합니다.
매수 신호 Impulse는 매도와 마찬가지로 반대 방향으로 거래될 수 있습니다.
매도 신호 임펄스는 반대 방향으로 거래되거나 분석될 수 있습니다. MT4 버전:- 곧 출시됩니다!!
계속 지켜봐 주세요,
Impulse Expert Advisor 출시 예정!!!!!
입력 섹션 1:- 시간 프레임 제어, 특정 시간 프레임을 비활성화하거나 활성화합니다.
입력 섹션 2: 모든 시간 프레임에 영향을 주는 공통 매개변수.
입력 섹션 3:- 선 모양 및 색상.
입력 섹션 4:- 임펄스 감지 속성.
입력 섹션 5:- 경고 속성.
Impulse Expert Advisor

the indicator will show signal arrows on the graph at the crossing of Awesome Oscillator base level it has push and audible alerts and Email alert. By crossing above base level , a blue arrow will come out for the BUY, at the same time an audible signal will sound. By crossing Below base level, a red arrow will come out for the SELL, at the same time an audible signal will sound. Possibility to deactivate push and audible alerts.
MT4 version : Buy the 'Awesome cross' Technical Indicator for

Индикатор "Tiger" показывает развороты рынка. Основан на индексе относительной бодрости (RVI).
Представлен в виде осциллятора, который показывает энергию текущего ценового движения и отражает уверенность ценового движения от цены открытия к цене закрытия в диапазоне максимальных и минимальных цен за данный период. Это, в свою очередь, даёт трейдеру возможность находить точки разворота с большой вероятностью.
Не перерисовывает!
Хорошо показывает себя на боковом движении рынка, которое п

Brief description The ContiStat indicator calculate statistic frequency of green (up) and red (down) movement in the chart and determine movement dynamics (silver curve). There are two key parameters to understand the ContiStat principle: Block height and Block count . The ContiStat engine convert instrument price chart move to Blocks of constant height (price) regardles of how much time it take. Example 1: Block height is set to 50. DE30 index price make move from 15230 to 15443 in an hour. 4 g
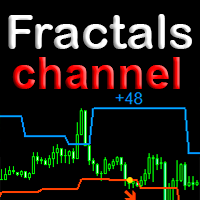
Trend indicator with a unique algorithm for detecting trend reversals. It uses Price Action and its own filtering algorithm to determine the trend. The algorithm is based on a price channel based on chart fractals. This approach helps to accurately determine the entry points and the current trend on any timeframe. Recognize a new emerging trend with fewer false positives without delay. Peculiarities
The advantage of the indicator is that its period is dynamic. Since it is tied not to the number

Info: marcobarbosabots
Pivot lines are an easy way to see market trend. The indicator provides the pivot line and three first support and Resistance lines.
Calculations used was:
Resistance 3 = High + 2*(Pivot - Low) Resistance 2 = Pivot + (R1 - S1) Resistance 1 = 2 * Pivot - Low Pivot point = ( High + Close + Low )/3 Suport 1 = 2 * Pivot - High Suport 2 = Pivot - (R1 - S1) Suport 3 = Low - 2*(High - Pivot)
You can use the calculated values on an EA too, just make sure the indicator
The Qv² Trend is an indicator that aims to identify trends.
Buying trend signals are indicated by arrows pointing up.
Selling trend signals are indicated by arrows pointing down.
It can be used in all deadlines.
It can be used in all pairs.
I use it on the H1 with a period of 24. Important Recommendation: Make sure you trade in trend market. Good Trades, in trend market
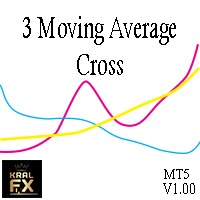
KF CROSS 3MA
This indicator show the collision points of moving averages in a separate window. so we will have a solitude chart. Features indicator: Show alert in Meta Trade Send notification to mobile Adjustable 3 MA (Fast-Middle-Slow) Can be used on all symbols Can be used in all time frames
Attention, the application does not work in the strategy tester
You can download the Demo version on the comments page : https://www.mql5.com/en/market/product/81152?source=Site
or cotact us : ht

Indicator basic idea is buy strong currency and sell weak currency. If A/B currency pair is in an uptrend, it shows if it is due to A strength or B weakness.On these signals one can choose the most optimal pair to trade. You can use Currency Power System for pattern trading as well, among basic patterns which can be used are: cross trend break divergencies So much for theory. I searched for a ready-made indicator (Currency Strength) to support my trade but did not find one. Well. I have to wr


An customize Indicator by which you can have Triple moving averages at close prices and send push notification on each crossing. This indicator is especially useful when you are doing manual trading. Notes: Cation: forex trading is a very risky business,... don't invest the money you cannot bear to lose. the probability of losing is high ... more high aaaand exponentially high.... something like EMA enjoy losing with us...

This is a multi-symbol and multi-timeframe table-based indicator designed for a candlestick patterns detection with 46 patterns for META TRADER 5. Each formation has own image for easier recognition. Here you find most popular formations such as "Engulfing", "Hammer", "Three Line Strike", "Piercing" or Doji - like candles. Check my full list of patterns on my screenshots below. Also you can not only switch all bearish or bullish patterns from input, but also select formation for a specified symb
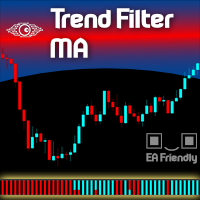
One of the best tools category for an Expert Advisor is the Filtering System . Using a filter on your entries will take your metrics to the good side. And even when you trade manually a filtering system is more than welcome. Let us present a commonly used filtering system based on Exponential Moving Averages - in fact, you can choose the type of the MAs as you wish and also mix them all up - we called this indicator Filter Trend MA . We present this indicator as a colored strip you can use at th

It will perfectly complement your working Expert Advisor or manual trading with up-to-date information.
There is a sound notification of exceeding the established profit and loss limits of open SELL and BUY orders.
Moreover, for each currency pair EURUSD, GBPUSD, XAUUSD, and others, various sound alerts are activated in English.
Indicators are displayed on a special panel on the chart from the moment the indicator is activated: Elapsed time
Fixed profit
Current profit Maximum drawdown Curr

The Bridge indicator displays potential entry points on the chart as signals (points of absolute trend reversal).
The Bridge forex indicator algorithm was created on the basis of the original indicators for searching for extremes, the indicator is well suited for determining a reversal or a large sharp jerk to one side, thanks to it you will know when this happens, it will notify you with the appearance of a blue dot to buy red to sell. The indicator, according to a certain algorithm, qualifi
MetaTrader 마켓 - 거래자를 위한 로봇 및 기술 지표는 거래 터미널에서 바로 사용할 수 있습니다.
The MQL5.community 결제 시스템은 MQL5.com 사이트의 모든 등록된 사용자가 MetaTrader 서비스에서 트랜잭션을 수행할 수 있습니다. 여러분께서는 WebMoney, 페이팔, 또는 은행 카드를 통해 자금을 예치하거나 인출하실 수 있습니다.
트레이딩 기회를 놓치고 있어요:
- 무료 트레이딩 앱
- 복사용 8,000 이상의 시그널
- 금융 시장 개척을 위한 경제 뉴스
등록
로그인
계정이 없으시면, 가입하십시오
MQL5.com 웹사이트에 로그인을 하기 위해 쿠키를 허용하십시오.
브라우저에서 필요한 설정을 활성화하시지 않으면, 로그인할 수 없습니다.