MetaTrader 5용 무료 기술 지표 - 13

When trading price action or using price action triggers such as Pbars, Inside Bars, Shaved Bars, etc. it is important to always wait for the bar/candle to close more than anything else.It is often the case (whether it’s the 4H, hourly, etc) that price action will be dominant in one direction for the majority of the candle only to reverse strongly at the end of the candle. Institutional traders know retail traders are less disciplined than they are. They know a good trading candle pattern coul
FREE

The indicator IQuantum shows trading signals for 10 symbols in the daily chart: AUDCAD, AUDUSD, EURUSD, GBPCAD, GBPCHF, GBPUSD, NZDUSD, USDCAD, USDCHF, and USDJPY.
Signals of the indicator are produced by 2 neural models which were trained independently from one another. The inputs for the neural models are normalised prices of the symbols, as well as prices of Gold, Silver and markers of the current day.
Each neural model was trained in 2 ways. The Ultimate mode is an overfitted neural model
FREE
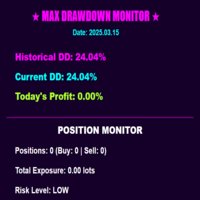
FREE

Indicator IRush uses a modified version of a popular indicator RSI (Relative Strength Index) to look for entries on a daily chart or lower. The indicator has been set up and tested with the major symbols: AUDUSD, EURUSD, GBPUSD, USDCAD, USDCHF, and USDJPY. An automated trading with this indicator is implemented in the expert advisor Intraday Rush . This expert advisor can open, trail and close its trades. Check it out, it may be exactly what you are looking for!
A Correct Reading of IRush
The c
FREE

The name Aroon means “ Dawn's Early Light ” in Sanskrit. His creator Tushar Chande chose this name because the indicator is designed to catch the beginning of a new trend. At first sight it seems a little confusing all those jagged lines but after you understand the basics of it, you will find this indicator pretty cool and use it in a variety of ways, i.e.: Trigger, Trend Filtering System, and so on. The Aroon indicator was created in 1995 so it is a "modern" indicator compared to the Jurassic
FREE

The Monthly Weekly Open Line is an indicator that plots: The current month open line that will extend till the last week on the month. Weekly lines that span the look back days period that you have set . Each line will extend from the respective weekly Monday zero GMT till friday of the respective week. Monthly and Weekly open lines can be used to build very powerfull anc consistent trading strategies. They act as natural S/R price barriers.
FREE
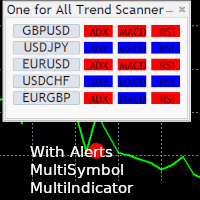
One for All Trend Scanner is a trend following multi-symbol indicator that can be used with any input: forex, stocks, commodities,... The panel shows three indicators and six symbols with the trend for every pair (symbol/indicator): up, down or no trend. The indicators are: Average Directional Movement Index (ADX) Moving Average Convergence Divergence (MACD) Relative Strength Index (RSI) You can choose which indicators will use for entry/exit and can adjust the parameters of each indicator sepa
FREE

Minimalist style BB indicator fully filled with a single color. Indicator type: Technical Indicator You are too confused with the complicated zigzag lines in the BB indicator, especially when your strategy has many indicators combined, it looks like a mess and we will no longer see any candlesticks on the chart for technical analysis s. This indicator was born to solve that. See more: New tradingview indicator: Order Block TV | Minimalist Price Action Strategy | Subscribe It is designed
FREE

Indicator that uses ATR and standard deviation to calculate the current trend. It has the top and bottom line. The top line is shown when it is high, and the bottom line when it is low. The indicator does not draw a trend line or show the trend for the day, or for a certain period. It has the function of indicating the current trend, and may indicate a reversal.
use it with caution and at your own risk.
FREE

The DR IDR Range Indicator plots ADR, ODR and RDR ranges for a given amount of days in the past. A key feature that appears is that it calculates the success rate of the ranges for the shown days. This indicator is perfect for backtest since it shows ranges for all of the calculated days, not just the most recent sessions. PRO VERSION
https://www.mql5.com/en/market/product/93360 Remember: this free version counts neutral days as true days , so stats might be slightly inflated. To get perfect a
FREE

VWAP RSJ is an indicator that plots the Hourly, Daily, Weekly and Monthly VWAP Lines.
Large institutional buyers and mutual funds use the VWAP ratio to help move into or out of stocks with as small of a market impact as possible. Therefore, when possible, institutions will try to buy below the VWAP, or sell above it. This way their actions push the price back toward the average, instead of away from it. Based on this information I developed this indicator that combines 4 types of VWAP Tim
FREE
Simple SuperTrend indicator, similar to that of TradingView's.
Links:
All-In-One Supertrend Indicator MT4 Version
It has buffers for buy and sell signal, if you want to integrate this into an EA.
It helps traders easily identify trends by providing clear buy and sell signals based on price movements. Designed for simplicity, it’s easy to use and integrates well with various trading strategies, making it a great option for traders of all levels.
Happy trading!
FREE

The Spots Indicator can be used for Entering and Exiting your trades based on the common candlestick patterns such as: engulfing, hanging man, doji etc. It is designed to publish desktop and mobile notification every time a signal is triggered. However, it is worth noting that this indicator is recommended to be used with other indicator for confirming the entries. It is best to use it with the Investment Castle Trend Lines indicator and the Supply and Demand indicator .
FREE

Free for now, price is going to be 30 USD at Jan 1. 2025.
Features: Pin Bar Detection : The indicator is designed to identify bullish and bearish pin bars based on specific criteria, including the relative size of the candle’s body and shadow, as well as the position of the candle's body in relation to the 38.2% Fibonacci level. Customizable Labels : Custom text is displayed above each identified bullish or bearish pin bar, such as "[38.2]" for bullish and "[-38.2]" for bearish, helping traders
FREE

Certainly! Let me introduce you to a powerful tool for MetaTrader 5 (MT5) that can automatically identify and draw support and resistance (S&R) levels on your trading charts. This tool is called the “Support and Resistance Levels Guru” . Support Resistance Levels Guru The Support & Resistance Indicator automatically displays essential S&R levels on your chart. These levels are crucial for technical analysis and are used by many traders. Resistance levels (zones) are shown in R ed , while suppo
FREE
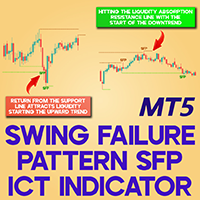
Swing Failure Pattern SFP ICT Indicator MT5 The Swing Failure Pattern (SFP) ICT Indicator for MT5 helps identify instances where the price tests a key support or resistance level, briefly surpasses it, and then swiftly pulls back, closing within the initial zone. This MetaTrader 5 tool marks liquidity zones using distinct green and orange lines. «Indicator Installation & User Guide» MT5 Indicator Installation | Swing Failure Pattern Sfp ICT Indicator MT4 | ALL Products By TradingFinderLab
FREE

Do you want to see the most relevant supports and resistances at a glance? Tired of tracing the levels by hand? Multi Levels Detector is an indicator for MetaTrader that will draw supports and resistances according to the parameters entered, and also offers the possibility of executing an alert every time the price reaches any of its levels.
SETTINGS UsePercentage: Allows you to configure whether the distances between levels will be measured in points, or by a percentage of the asset.
TimeFram
FREE
BBTrend is a relatively new indicator developed by John Bollinger to work with Bollinger Bands. It is one of only a few indicators that can signal both strength and direction making it a very valuable tool for traders.
Calculations The calculations are fairly simple. The default periods of 20 and 50 are shown, but these can be changed through the parameters. Lower = MathAbs(lowerBB(20) - lowerBB(50)) Upper = MathAbs(upperBB(20) - upperBB(50)) BBTrend = (lower - upper) / middleBB(20)
Interpret
FREE
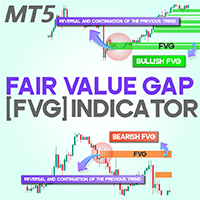
Fair Value Gap or FVG indicator MT5
The Fair Value Gap (FVG) Indicator is a valuable asset for traders using MetaTrader 5, designed to highlight market inefficiencies. An FVG occurs when an imbalance between supply and demand causes a rapid price movement. To understand this, picture three consecutive candlesticks; the space between the first and third candlestick represents the "FVG." This indicator automatically marks these gaps on the chart using dynamic boxes—green for bullish FVGs and red
FREE
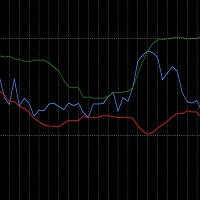
The RSI_BBands is a custom indicator designed to combine the Relative Strength Index (RSI) and Bollinger Bands (BB) for enhanced market analysis. It calculates the RSI using a specified period (default 14) and overlays Bollinger Bands around the RSI values, with adjustable parameters for the Bollinger Bands period and deviation.
Check more HERE
Key Features: RSI Calculation: The RSI is calculated based on price changes, with higher values indicating overbought conditions and lower values indi
FREE

Initiated in 1995 by the physicist and technical analyst Paul Levine, PhD, and subsequently developed by Andrew Coles, PhD, and David Hawkins in a series of articles and the book MIDAS Technical Analysis: A VWAP Approach to Trading and Investing in Today's Markets.Latterly, several important contributions to the project, including new MIDAS curves and indicators, have been made by Bob English, many of them published in the book.
FREE
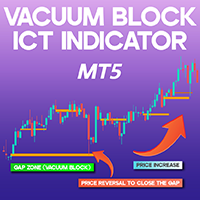
Vacuum Block ICT Indicator MT5 The Vacuum Block ICT indicator MT5 is designed to detect price voids in the market that emerge due to inactivity or strong buy/sell momentum during periods of heightened volatility.
These gaps typically appear following major political or economic developments, where a lack of active orders and insufficient liquidity causes price movements to retrace back to these regions. Vacuum blocks are classified as either bullish or bearish and are visually represented in ora
FREE

The 3 Candlestick Engulf indicator is a candlestick pattern indicator that considers the last 3 bearish candles for a Bullish Engulf candlestick pattern signal and last 3 bullish candlesticks followed by a Bearish Engulf candlestick pattern for a bearish signal. Engulfs are also presented in both trending and non-trending situations of the market though recommended to move with signals that are in line with the trend basing on the moving average. The indicator has multiple input features that yo
FREE

The ZigZag SMC/SMT Indicator for MT5 is the ideal tool for traders who want to accurately identify tops and bottoms based on the advanced concepts of Smart Money Concepts (SMC) and Smart Money Trap (SMT).
Main Benefits: Automatic identification of strategic tops and bottoms. Based on concepts used by institutional traders. Ideal for analyzing liquidity, market structure and manipulation. Simple to use: just add it to the chart and track the critical points.
️ Free Version: This ve
FREE

The Kijun-Sen Envelope is a powerful trend-following indicator based on the Kijun-Sen line from the Ichimoku Kinko Hyo system. This tool creates dynamic upper and lower bands around the Kijun-Sen, forming an envelope that helps traders identify market trends, potential reversals, and overbought/oversold conditions.
Key Features: • Trend Confirmation – Helps determine whether the market is in a strong uptrend, downtrend, or ranging phase. • Support & Resistance Zones – The envelope acts as
FREE
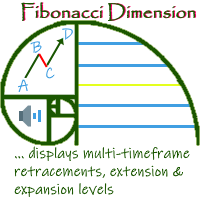
'Fibonacci Dimension' indicator allows display of preset or user-defined multi-timeframe Fibonacci levels. It automatically takes the previous high and low for two user-defined timeframes and calculates their Fibonacci retracement levels. It also considers the retraced level to draw the expansions on every change of price. A complete visual dimension in multiple timeframes allows deriving profitable strategies for execution. Enhanced functionality to view and customize the default Fibonacci Rang
FREE

The Expert Advisor for this Indicator can be found here: https://www.mql5.com/en/market/product/116472 Introducing the Rejection Candle MT5 Indicator, a robust tool designed to revolutionize your trading experience on the MetaTrader 5 platform. Built to pinpoint potential reversals with precision, this indicator offers unparalleled insights into market sentiment shifts, empowering traders to seize profitable opportunities with confidence. Key Features: Advanced Rejection Candle Detection: Uncov
FREE

Distance Price Moving Average
This is an indicator that calculates in real time the distance from the price to the moving average.
With it you can monitor the maximum deviation of the price from the moving average in a certain period of time chosen by you, for example, monitor the distance according to the maximum deviation of the last 30 days.
It is possible to choose the period and type of the moving average.
To make it even better, we have added the possibility of two alert levels if th
FREE

This indicator is based on Mr. Mark Fisher's ACD strategy, based on the book "The Logical Trader."
- OR lines - A lines - C lines - Daily pivot range - N days pivot range - Customizable trading session - Drawing OR with the desired time Drawing levels A and C based on daily ATR or constant number - Possibility to display daily and last day pivots in color zone - Displaying the status of daily PMAs (layer 4) in the corner of the chart - Show the order of daily pivot placement with multi-day piv
FREE

MetaTrader용 Slope Channel 지표
어떤 거래 스타일에도 적합한 시장 트렌드 분석 도구를 찾고 계신가요? Slope Channel – 가격 움직임과 주요 시장 수준을 파악하는 신뢰할 수 있는 도우미입니다! Slope Channel이란? Slope Channel은 혁신적인 지표로, 차트에 기울어진 채널을 구성하며 로컬 극값을 기반으로 매개변수를 자동으로 계산합니다. 이 도구는 최적의 채널 옵션을 강조 표시하여 변화하는 시장 상황에 신속히 적응할 수 있도록 돕습니다. 주요 특징 채널 각도 자동 계산: 지표는 채널의 기울기 각도를 표시하며, 다음 유형을 나타냅니다: 수렴 (양의 각도): 채널이 좁아지고 가격 압력이 증가함을 나타냅니다. 발산 (음의 각도): 범위가 확대되고 불안정성이 예상됨을 나타냅니다. 최신 데이터: 새로운 캔들이 생성될 때마다 채널이 다시 계산되어 가장 최신 데이터를 제공합니다. 다양한 적용 이 지표는 다음에 적합
FREE

The indicator shows your profit and loss (PnL) for the current day right on your trading chart. Anchored at the top-right corner, it displays "PnL: [amount]"—green if you’re up, red if you’re down, white if it’s zero. Every time you close a trade, it updates instantly, adding up your profits, commissions, and swaps from all buys and sells trades since midnight. No fuss, no extra charts—just real-time feedback on how your day’s going.
FREE
AC Pivot Panel – Your Ultimate Pivot Trading Tool The AC Pivot Panel is a powerful yet user-friendly pivot point indicator designed to help traders identify key support and resistance levels with ease. Whether you’re a beginner or an experienced trader, this indicator simplifies pivot trading and enhances your decision-making process. Key Features : Interactive Selection Panel : Easily adjust pivot settings directly on the chart with a compact and intuitive panel. Multiple Pivot Methods : C
FREE

The indicator displays divergence for any custom indicator. You only need to specify the indicator name; DeMarker is used by default. Additionally, you can opt for smoothing of values of the selected indicator and set levels whose crossing will trigger an alert. The custom indicator must be compiled (a file with ex5 extension) and located under MQL5/Indicators of the client terminal or in one of the subdirectories. It uses zero bar of the selected indicator with default parameters.
Input parame
FREE

Hello, This indicator is a unique high reliability 7-in-1 multicurrency indicator comprising these sub-indicator’s: A Trend Power Crossover Indicator. A Percent Change Crossover Indicator. A Currency Overbought/Oversold Indicator. A Currency Deviation Indicator. A Currency Impulse Signal Indicator. A Trend Power Indicator. A Currency Volatility Indicator. The main advantage of this indicator is that it's reasoning by currency and not by currency pair. The values of each sub-indicator are calcula
FREE
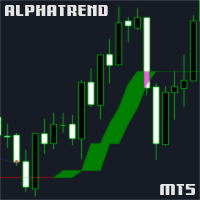
Overview: The AlphaTrend Indicator is a custom technical analysis tool designed for the MetaTrader 5 (MT5) trading platform. This indicator uniquely combines the Average True Range (ATR) and the Money Flow Index (MFI) to offer traders a novel approach to trend analysis and potential reversal points in the market. Key Features: ATR-Based Trend Analysis: Utilizes the Average True Range (ATR) to assess market volatility, aiding in identifying potential trend reversals. MFI Integration: Incorporates
FREE

Custom Panel allows you to gather all kind of important information and display it as one handy table in the upper right corner of the chart.
You can choose the contents of the panel yourself. Every row will show your own customized condition or value. Every column shows a different timeframe. The panel may contain up to 10 rows and up to 8 columns. Sample usage Row : Price > EMA(30)
Mode : YES_NO
Meaning : is current price above EMA(30)
Row : Ask < Bands[L]
Mode : YES_NO
Meaning : is current a
FREE

Highly configurable Adx indicator.
Features: Highly customizable alert functions (at levels, crosses, direction changes via email, push, sound, popup) Multi timeframe ability Color customization (at levels, crosses, direction changes) Linear interpolation and histogram mode options Works on strategy tester in multi timeframe mode (at weekend without ticks also) Adjustable Levels Parameters:
ADX Timeframe: You can set the lower/higher timeframes for Adx. ADX Bar Shift: you can set the of
FREE

Double Smoothed Stochastic is similar to Stochastic except for this Indicator we use what is called double exponentially smoothing.
This will give the trader a more speedy response to price changes which tends to smooth out the erratic movements of a regular Stochastic.
Double Smoothed Stochastic Calculation is : DSS = EMA(r) (X - Lxn / Hxn - Lxn) x 100 MIT = EMA(r) (close - Ln / Hn - Ln) x 100
Ln = lowest low of n periods Hn = highest high of n periodsLxn = lowest low of the price serie
FREE

Revolution Martingale is an indicator designed for trading binary options on the M5 timeframe. Features: M5 Timeframe: It is recommended to use the indicator on the M5 timeframe for optimal trading. Trade Entry: Trades should only be opened on the first candle after a signal appears. Signals: A blue diamond indicates a buying opportunity for upward movement, while a red diamond indicates a buying opportunity for downward movement. Configured for Effective Binary Options Trading: The indicator i
FREE

Willkommen in einer neuen Ära des Tradings mit dem AI Moving Average Indikator, einem fortschrittlichen MetaTrader 5 Indikator, der Tradern prädiktive Einblicke in Marktbewegungen bietet. Dieses Tool kombiniert die Leistungsfähigkeit von KI mit der Zuverlässigkeit eines Zero-Lag-Exponentialgleitenden Durchschnitts, um präzise und zeitnahe Vorhersagen über zukünftige Preisentwicklungen zu liefern. Innovatives Lineares Regressionsmodell Der AI Moving Average nutzt ein maschinelles Lernmodell der l
FREE

StopLevel 미터는 STOPLEVEL 레벨을 제어합니다. 레벨이 변경되면 경고로 신호를 보냅니다. STOPLEVEL - 스탑 주문을 하기 위한 현재 종가에서 포인트 단위의 최소 오프셋, 또는 포인트 단위로 허용되는 최소 손절매/이익 실현 수준. STOPLEVEL 값이 0이라는 것은 손절/이익 실현을 위한 최소 거리에 대한 제한이 없거나 거래 서버가 터미널로 전송할 수 없는 동적 수준 제어를 위해 외부 메커니즘을 사용한다는 사실을 의미합니다. 두 번째 경우에 STOPLEVEL은 실제로 "부동" 상태입니다. 표시기 설정: color_ - 레벨의 구역 색상 draw_bars - 레벨 영역을 표시하기 위한 막대의 수 width_price - 가격 라벨의 두께 미터는 STOPLEVEL 레벨을 제어합니다. 레벨이 변경되면 경고로 신호를 보냅니다. STOPLEVEL - 스탑 주문을 하기 위한 현재 종가에서 포인트 단위의 최소 오프셋, 또는 포인트 단위로 허용되는 최소 손절매/
FREE

One of the best tools for analyzing volume,
Weis Wave was idelized by David Weis, to facilitate the reading of directional flow. For the VSA method disciples it is an evolution of the practices created by Richard Wycoff, facilitating a predictive reading of the market, always seeking an accumulation and distribution of the negotiated contracts.
Cumulative wave volume Range of wave ( removed) Average Wave volume Ref "Tim Ord lectures" ( removed)
FREE

Gatotkaca Support Resistance Trendline Indicator is a simple indicator that detects support, resistance and trendlines. It will helps you find breakout momentum based on lines calculated by this indicator. This is conceptually based on fractals, but with customizable periods. Compatible for any timeframes. You can customize how this indicator work by setting up the period input.
FREE

This indicator will show a vertical representation of the volume distribution within a selected user range.
This is a free version of the full product. It is limited to use on a week old data or older. Find the full product at https://www.mql5.com/en/market/product/42234 .
Main features: This Indicator will create an image that will allow viewing the tick volume per price level in a graphical form. The indicator will work on any range size in any time-frame, limited only by your computer mem
FREE

NtickChart-BVcandle Features This is a free version with limited functionality.
This is a tick chart indicator that displays in a sub-window. Inspired by Bob Volman's (BV) scalping method, it is designed as a tool for achieving simple and effective trading. It is a tick chart specifically for day trading and scalping, focusing even on 1 pipette changes. Instead of time-based candle bars, it generates candle bars for a specified number of ticks (ticks_in_candle). This allows for a more detailed
FREE

TransitGhost Signal indicator, this is one of my best forex trading strategy. The strategy is based on the simple moving average cross, 5 SMA AND 200 SMA of which take a longer time to cross. Whenever the is a cross between the 5 SMA and 200 SMA a signal will be given, when the 5 SMA cross the 200 SMA to the upside ,a buying arrow will appear on chart, and push notification(alert) "Buy now, use proper risk management" will be sent on both the MT5 PC and mobile app, and when the 5 SMA cross the 2
FREE

Tops & Bottoms Indicator FREE Tops abd Bottoms: An effective indicator for your trades
The tops and bottoms indicator helps you to find ascending and descending channel formations with indications of ascending and/or descending tops and bottoms. In addition, it show possibles opportunities with a small yellow circle when the indicator encounters an impulse formation.
This indicator provide to you more security and speed in making entry decisions. Also test our FREE advisor indicator:
FREE
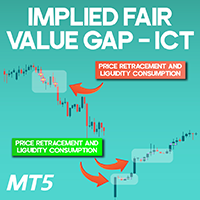
Implied Fair Value Gap ICT Indicator MT5 The Implied Fair Value Gap ICT Indicator MT5 is a powerful tool designed to uncover hidden price inefficiencies within the MetaTrader 5 platform. This indicator employs a specialized method by plotting two theoretical lines at the midpoint of the shadows of consecutive candles, marking the space between them as an implied fair value gap. It's important to note that if the shadows of the neighboring candles fully overlap, no hidden fair value gap is formed
FREE

VWAP FanMaster: 정확한 풀백 전략을 마스터하자!
VWAP FanMaster 는 정확한 진입점 과 효율적인 풀백 을 찾는 트레이더를 위한 궁극적인 지표입니다. **VWAP(거래량 가중 평균 가격)**과 피보나치 팬 라인 을 결합하여 시장에서 중요한 가격 영역을 명확하게 표시합니다. 주요 기능 간단하고 강력함 : 수직선을 이동시키기만 하면 자동으로 VWAP 과 피보나치 팬 라인 이 그려집니다.
스마트한 거래 전략 : 가격이 그려진 영역으로 되돌아오는 것을 기다린 후, 완벽한 풀백 을 지원 및 저항 레벨에서 포착하세요.
고급 시각적 도구 : 가격의 융합 영역 을 즉시 찾아서 신속하고 정확한 거래 결정을 내리세요. VWAP FanMaster를 선택해야 하는 이유 초보자도 쉽게 사용할 수 있음 .
두 가지 강력한 분석 도구 를 결합하여 거래 정확도를 높입니다.
위험 관리 개선 을 위한 명확하고 일관된 가격 예측 제공. VWAP F
FREE

Volume Weighted Average Price (VWAP) is a trading benchmark commonly used by Big Players that gives the average price a Symbol has traded throughout the day. It is based on both Volume and price. This indicator contains Daily VWAP and MIDAS' VWAP, which means you are able to anchor the beggining of MIDAS' calculations and, therefore you will be able to use this methodology to study price versus volume moves after anchor point. You will be able to anchor up to 3 HIGH MIDAS VWAP's and 3 LOW.
Wish
FREE

the AK CAP toolbox free to use;
it includes the same indicators we use for our daily trading and we think the simpler the better. Lightweight indicator for use on all timeframes. that includes VWAP with vwap value indicator on top right. 3 EMA: FAST, MEDIUM, SLOW the candle timer to show how much time left in a candle.
colors and positions are fully customizable.
enjoy
FREE

This indicator is based on the Bollinger Bands indicator. It helps the user identifying whether to buy or sell. It comes with an alert that will sound whenever a new signal appears. It also features an email facility. Your email address and SMTP Server settings should be specified in the settings window of the "Mailbox" tab in your MetaTrader 5. Blue arrow up = Buy. Red arrow down = Sell. Line = Trailing Stop. You can use one of my Trailing Stop products that automatically move the Stop Loss and
FREE

A simple volume indicator according to the color of the candle!
- Custom background!
- Supports Volume by Ticks or Real Volume.
The original Metatrader Volume indicator does not show the colors of the bar according to the color of the Candle, it only changes color when the volume of a candle is greater than the previous one, this sometimes creates confusion for beginners and does not know the real reason for the color change.
Free indicator, support may take a while to respond!
FREE

Totally linked to the result of a movement and the duration he had. Its height records how many ticks the asset walked during a given movement, its width shows us the duration that movement had. Its configuration must be in line with the Weis Wave Indicator configuration to observe the movement force and can indicate a possible accumulation or distribution of the movement;
FREE
To get access to MT4 version please click here . This is the exact conversion from TradingView: "Breakout Finder" by "LonesomeTheBlue". The screenshot shows similar results from tradingview and Metatrader. This is a medium-load processing indicator. Updates are calculated per candle. This is a non-repaint indicator. The major input options are available. Buffers are available for processing in EAs. You can message in private chat for further changes you need. Thanks for downloading
FREE
This non-repainting indicator, inspired by Larry Williams’ renowned "VIX Fix", replicates the power of the VIX (Volatility Index) but works across all asset classes—making it a versatile tool for traders. Originally designed for stock indices, this version adapts to any market, including forex, commodities, and crypto, providing valuable insights into potential market bottoms.
For more details, check out this pdf: https://www.ireallytrade.com/newsletters/VIXFix.pdf
Key Features: Based on the w
FREE
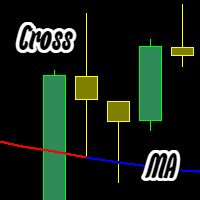
이 인디케이터는 두 가지 색상의 이동평균선(MA)을 표시합니다: 파란색 — 이전 봉의 시가와 종가가 MA 선 위에 있을 때. 빨간색 — 이전 봉의 시가와 종가가 MA 선 아래에 있을 때. 설정 가능 옵션: MA 유형 (단순, 지수, 평활, 선형); MA 기간; MA 색상 변경 시 알림. 문제가 있으면 알려주세요. 수정하겠습니다! bar cross Moving cross candle cross Moving cross bar cross MA cross candle cross MA cross bar cross Moving Average cross candle cross Moving Average cross bar
이 인디케이터는 두 가지 색상의 이동평균선(MA)을 표시합니다: 파란색 — 이전 봉의 시가와 종가가 MA 선 위에 있을 때. 빨간색 — 이전 봉의 시가와 종가가 MA 선 아래에 있을 때. 설정 가능 옵션: MA 유형 (단순, 지수, 평활, 선형); MA 기간;
FREE

(Google 번역) 이 지표는 Worden Brothers, Inc 에서 개발한 원본 " TSV(Time Segmented Volume) "를 기반으로 합니다. 그러나 여기에 몇 가지 기능을 추가했습니다. 원본에서 사용하는 기본 종가만 사용하는 대신 적용할 가격을 선택할 수 있습니다. 실제 범위를 기반으로 하는 가상 볼륨을 포함하거나 볼륨 가중치를 전혀 적용하지 않는 등 사용할 볼륨 가중치를 선택할 수도 있습니다. (Original text) This indicator is based on the original “ Time Segmented Volume (TSV) ” developed by Worden Brothers, Inc . However, I added an extra few features to this one. One can choose the price to be applied, instead of only having the default close price us
FREE
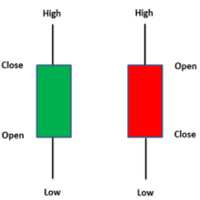
The indicator shows the strength of the trend if the green number is more than 50, you need to look for a signal to buy, and on the contrary, the red number is more than 50, you need to look for a sell,
The indicator is based on the Heiken Ashi candle
the indicator is suitable especially for scalping and medium-term trading
REMEMBER THE INDICATOR DOES NOT GUARANTEE A WINNER BUT IT HELPS TO MAKE CORRECT TRADING
THE RISK ON THE TRANSACTION WILL BE NO MORE THAN 3 PERCENT
FREE

세계 주요 시장의 현재 시간을 표시하는 표시기. 또한 현재 세션을 표시합니다. 사용하기 매우 쉽습니다. 차트에서 많은 공간을 차지하지 않습니다. VirtualTradePad 와 같은 Expert Advisor 및 기타 패널과 함께 사용할 수 있습니다. 클래식 스타일 버전. 친애하는 친구 및 EA 사용자 여러분, 리뷰 섹션에 귀하의 평가를 추가하십시오. Forex 소프트웨어의 모든 업데이트는 무료입니다 ! 이것은 무료 거래 유틸리티입니다! 다른 특징들: 입력 매개변수에 옵션이 있습니다. 버튼 위에 마우스를 놓으면 팁 표시/숨기기, 영어/러시아어 팁 언어를 선택할 수도 있습니다. 닫기 버튼은 응용 프로그램을 중지합니다. 최대화/최소화 버튼은 차트의 창을 축소/확장합니다. 창은 차트에서 이동할 수 있습니다. 이렇게 하려면 창 상단 닫기 및 최소화 버튼 근처를 클릭한 다음 창을 원하는 위치로 이동합니다. Expforex,Vladon,Indicator,Utility
FREE

The "Session Time Vertical Lines" indicator displays vertical lines on the chart that mark the beginning and end of major global trading sessions: Sydney, Tokyo, London, and New York . It is designed to help traders visually identify active market hours, overlaps, and potential high-volume periods directly on the price chart. This tool is especially useful for intraday traders who rely on market session timing to plan entries and exits. Inputs / Settings Parameter Name Description DaysToDraw Num
FREE

Introducing our latest innovation in MetaTrader 5 indicators, designed to dramatically improve your trading workflow with high functionality and ease-of-use. It features a robust collection of features designed to help you streamline chart analysis and make the most of your trading decisions. Here's a quick rundown of its incredible features: Fast Drawing of Objects : Save precious time with the quick draw feature. With just a click of a button, you can create various trading objects on your ch
FREE
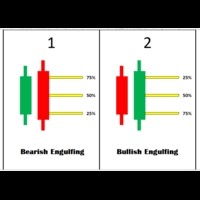
Engulfing Levels Indicator – Smart Entry Zones for High-Probability Trades Overview:
The Engulfing Levels Indicator is designed to help traders identify key price levels where potential reversals or trend continuations can occur. This powerful tool combines Engulfing Candle Patterns , Percentage-Based Levels (25%, 50%, 75%) , and Daily Bias Analysis to create high-probability trading zones . Key Features:
Engulfing Pattern Detection – Automatically identifies Bullish and Bearish Engulf
FREE

This indicator displays volume delta (of either tick volume or real volume) encoded in a custom symbol, generated by special expert advisers, such as RenkoFromRealTicks . MetaTrader does not allow negative values in the volumes, this is why we need to encode deltas in a special way, and then use CustomVolumeDelta indicator to decode and display the deltas. This indicator is applicable only for custom instruments generated in appropriate way (with signed volumes encoded). It makes no sense to ap
FREE
The indicator is a line right at yesterday's closing price. With the indicator, there is no need for adding or deleting previous day close lines each new day. T he line gives you an instant visual reference point for support, resistance, and market sentiment. Whether you are day trading or swing trading, this line helps you quickly gauge where the market closed last session and how current price action relates to that level. It works seamlessly across all timeframes - from 1-minute charts to d
FREE

Индикатор для синхронизации и позиционировании графиков на одном и более терминалах одновременно. Выполняет ряд часто необходимых при анализе графиков функций: 1. Синхронизация графиков локально - в пределах одного терминала при прокрутке, изменении масштаба, переключении периодов графиков, все графики делают это одновременно. 2. Синхронизация графиков глобально - тоже самое, но на двух и более терминалах, как МТ5, так и МТ4. 3. Позиционирование графика на заданном месте при переключении периодо
FREE

Session Box Indicator for MetaTrader 5
Description: The SessionBox indicator is designed to visually represent the trading sessions on a chart, specifically the Asian, European, and American sessions. This indicator draws customizable rectangles around each session, allowing traders to easily identify different trading periods. It also includes labels to denote each session, enhancing clarity.
Users only need to input the session start and end hours in their server time. Please note, the Asia
FREE

TOPOS INDICATOR AND HISTORIC BACKGROUNDS The Indicator of historical tops and backgrounds is based on the monthly chart where sharks hide so it was developed to facilitate the identification of these regions. The available features are the Incoming Triggers alerts and notifications that are sent to the mobile phone. Parameters 1-) Tops and Bottoms: You can change the color of the lines and the period in years and the filter range between the top and bottom and the median and consider th
FREE
Supertrend with CCI Indicator for MQL5 – Short Description The Supertrend with CCI Indicator is a powerful trend-following tool that combines Supertrend for trend direction and CCI for momentum confirmation. This combination helps reduce false signals and improves trade accuracy. Supertrend identifies uptrends and downtrends based on volatility.
CCI Filter ensures signals align with market momentum.
Customizable Settings for ATR, CCI period, and alert options.
Alerts & Notifications via
FREE

!!!This Free Version just works on EURUSD!!! Wa Previous Candle Levels MT5 shows the previous candle levels, it shows the previous candle Open High Low Close levels (OHLC Levels) in different time frame. It's designed to help the trader to analyse the market and pay attention to the previous candle levels in different time frame. We all know that the OHLC Levels in Monthly, Weekly and Daily are really strong and must of the time, the price strongly reacts at those levels. In the technical anal
FREE
MetaTrader 마켓은 거래 로봇과 기술 지표들의 독특한 스토어입니다.
MQL5.community 사용자 메모를 읽어보셔서 트레이더들에게 제공하는 고유한 서비스(거래 시그널 복사, 프리랜서가 개발한 맞춤형 애플리케이션, 결제 시스템 및 MQL5 클라우드 네트워크를 통한 자동 결제)에 대해 자세히 알아보십시오.
트레이딩 기회를 놓치고 있어요:
- 무료 트레이딩 앱
- 복사용 8,000 이상의 시그널
- 금융 시장 개척을 위한 경제 뉴스
등록
로그인
계정이 없으시면, 가입하십시오
MQL5.com 웹사이트에 로그인을 하기 위해 쿠키를 허용하십시오.
브라우저에서 필요한 설정을 활성화하시지 않으면, 로그인할 수 없습니다.