MetaTrader 5용 무료 Expert Advisor 및 지표 - 33

Online monitoring of forex accounts fxmon.io The application helps track real-time accounts from your forex terminals Metatrader 4/5 around the clock. List of main features: The state of your accounts in the moment Profitability on each account and on all together Metrics for currency pairs Screenshots of pairs from the terminal Fine-tuning of notifications for any indicators Access to statistics via Telegram, Android app, iOS app
If you use Expert Advisors and robots, this app is for you Moni
FREE

The Display N Bars utility is a simple tool designed to help identify candles.
If a trader tries to share knowledge with a colleague but it is difficult to pinpoint exactly the desired candle, just say the corresponding candle number.
The candle count is reset every day.
Seeking to offer a good customization the inputs are:
Display type -> Display only odd, only odd, or both candles?
Direction -> Horizontal or Vertical?
Display multiples of: (display frequency) -> Displa
FREE

CloseByLossOrProfit Expert Advisor closes all positions as their total profit or loss reaches a specified value (in deposit currency). In addition, it can delete pending orders. Allow AutoTrading before running the Expert Advisor. Usage: Run the Expert Advisor on a chart. Input Parameters: Language of messages displayed (EN, RU, DE, FR, ES) - language of the output messages (English, Russian, German, French, Spanish); Profit in the currency - profit in points; Loss in the currency - loss in p
FREE

Standard PVSR is based on Pivot Points.
Steps to Setup the Indicator: Install the Custom Indicator; Set all the Lines Color, Width and Styles; Set visualization to All Timeframe; and DONE
It can be used for: All Pairs: Forex, Cryptocurrencies, Metals, Stocks, Indices etc. All Timeframe All Brokers All type of Trading Style like Scalping, Swing, Intraday, Short-Term, Long-Term etc. Multiple Chart
-->> For any Type of Support, Guidance, Setup Issue, EA Optimization, Input Setup etc.
FREE

Good afternoon. Today we offer the maxlottomson indicator to determine the maximum volume that you can put up for purchase or sale, if you look at your deposit level. This indicator is convenient to use for News trading, when you need to determine the entry point on a high-speed movement and calculate the risk level as a percentage of the deposit, the maxlottomson indicator shows the maximum value of the LOT volume for your deposit that you can use for trading.
FREE
MT5用 サブウィンドウにスプレッドとBUY SWAP(BS)とSELL SWAP(SS)を表示するインジケーターです。
表示の文字フォントの大きさと色の設定、スプレッドの表示をPIPS表示もしくはPOINTS表示切替が可能ですので、チャートの色設定などに合わせて、お好みでご利用いただけます。 サブウィンドウの表示サイズに合わせて、その中央に表示するようになっています。
(ご協力お願いします!) こちらは無料でご利用いただけます。どうぞご自由にご利用ください。 もしよければ MS High Low indicator も紹介していますので、どうぞご参照の上、DEMO版のダウンロードをお試しください!
Happy Trading :)
FREE

FXRog = Forex Running On Growth
Expert Advisor description ShortTerm : Yes MidTerm : Yes LongTerm : Yes TargetProfit : By Money, value can be changed in the parameter StopLoss : By Maximum Open Position, all position will closed when maxtrade is reach, value can be changed in the parameter
Parameter description StartTrade : begining time to start trading EndTrade : last time ea to open a position MoneyManagement : 1 = FixLot, 2 = VolumeLot FixLot : lot of transactions with a fixed amoun
FREE

Donation: USDT (TRC20) : TJhnnAGwkJqVyAM69Uq9fuDFNxfu1X1c9x USDT (BEP20/KCC/ERC20) : 0x0b9a736E6178F47450322936170213d419C4A7c0
You can use this expert to execute Martingale orders for you open positions. This expert will add to your positions with a pre-defined loss step.
For choosing open positions you can use Symbol Name or Magic Number . Also the loss step will be defined by currency or pips. All positions that refer to a certain order will be closed by entered Profit from input sectio
FREE

================ // Average period ma_Sma, // Simple moving average ma_Ema, // Exponential moving average ma_Smma, // Smoothed MA ma_Lwma // Linear weighted MA =============== // Average method // Turn alerts on? // Alert on current bar? // Display messageas on alerts? // Play sound on alerts?
FREE
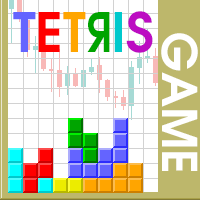
The Tetris — the most famous time killer is now on MT. Game develops active logic, attention and speed of decision making. This is a classic version of the game, no frills, but you can still adjust the size of the glass, the scale of the game, the color of the figures, and the desired speed. The game is made as an indicator. Control Keys: 'W,A,S,D' or 'Cursor' or 'NumPad'. S — Start new game. C — Continue previous game. P — pause on / off. Space — drop a figure. Esc — exit to menu.
FREE

This is an EA that supports simple order closing on MT5. EA Close MT5 (Homemade ) - EA closes orders when profit >= x$ - EA closes orders when loss >= -x$ - EA closes orders when Equity >= x$ - EA closes orders when Equity <= x$ - EA closes orders for all currency pairs or pairs using EA If you have any questions, please contact me: https://t.me/EAForexFree_vn
FREE

화면 공간을 더 필요로 하는 트레이더를 위한 숨김 스케일 도구 사용 방법 "T"를 눌러 시간 스케일을 숨기고 "P"를 눌러 가격 스케일을 숨길 수 있습니다. 해당 버튼을 클릭하고 새로운 키를 키보드에서 입력하여 이러한 키를 사용자 정의할 수 있습니다. 두 스케일을 동시에 숨기려면 두 옵션에 동일한 키를 할당할 수 있습니다. 스케일을 다시 표시하려면 해당 키를 다시 누르면 됩니다. 도구를 만든 이유 우리는 Sweet VWAP 지표를 사용하는 트레이더들이 더 많은 화면 공간을 가질 수 있도록 '숨김 스케일' 도구를 만들었습니다. 목표는 화면 공간 제한에 직면하는 모든 트레이더들에게 더 편안하고 생산적인 작업 환경을 제공하는 것입니다. 이 도구는 가격 움직임을 관찰하는 것이 주요 작업인 price action을 사용하는 트레이더들에게 특히 유용합니다. 우리의 도구를 사용하면 스케일을 숨기려면 한 번의 키 입력만으로 충분합니다. 이렇게 하면 트레이더는 시장 분석에 집중할 수 있습니다. 키
FREE

MP Close By Loss Or Profit for MT5 The Reason I made this Expert is because I want traders who already found out how to be profitable in the market use an easier tool throughout their trading days. This Expert will consider your exposure of trades and close them based on profit targets and losses you set for your own Risk Management. I want to thank my friend who helped me on this Expert, and his brilliant work is now shared here with you. A bit of advice after running the expert on your platfo
FREE

The indicator calculates the inclination angle between the Highs, Lows and Closes of adjacent bars. The angle can be measured in degrees or radians. A linear graph or a histogram is drawn in a subwindow. You can set the scale for the calculation — floating or fixed. For use in Expert Advisors or indicators, you need to specify a fixed scale.
Parameters Angular measure — degrees or radians. Scale mode for calculation — scaling mode. Free scale — free transformation, the indicator will calculate
FREE

Midpoint Bands is a channel-like indicator that draws two lines on the chart - an upper band and a lower band, pointing out possible reversal levels.
This is one of the indicators used in the Sapphire Strat Maker - EA Builder.
Sapphire Strat Maker - EA Builder: https://www.mql5.com/en/market/product/113907
The bands are simply calculated like this:
Upper Band = (HighestHigh[N-Periods] + LowestHigh[N-Periods])/2 Lower Band = (LowestLow[N-Periods] + HighestLow[N-Periods])/2
FREE

News Indicator. Shows the interest rate of 12 countries (Australia, Brazil, Canada, Mexico, euro zone, UK, India, New Zealand, Switzerland, United States, South Korea, Japan). It will help to analyze the impact of the interest rate on the exchange rate. It makes sense to set an indicator on large timeframes. To improve the information content, it makes sense to change the settings style of the indicator of the desired country, so that the line stands out from the total mass of indicators, as ind
FREE

This is a multi frame stochastic indicator, you can attach any time frame of stoch indicator on one chart. It is very useful if you like to check multi time frame stoch data. If you are interested in EA,click below links to take a look: https://www.mql5.com/en/market/product/80170 https://www.mql5.com/en/market/product/81136
How to use: > Atach the first time frame you want on to the currency pair's chart > Atach the second time frame you want on to the currency pair's chart > Atach the thir
FREE

This indicator uses the chart information and your inputs to display the lot size and associated stop for long or short positions. It uses an ATR based percent volatility position sizing calculation. You can use this indicator to learn more about a better position size calculation than a fixed lot system. The indicator adds text directly to the chart to show you the current position size calculation, the risk % input, the ATR Range input, the ATR value from the prior bar, the account equity at r
FREE
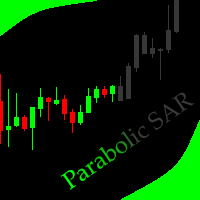
This indicator allows to hide Parabolic SAR (on all MT5 timeframes) from a date define by the user, with a vertical line (Alone) or a panel (with "Hidden Candles"). Indicator Inputs: Step Maximum Color Width Information on "Parabolic SAR" indicator is available here: https://www.metatrader4.com/en/trading-platform/help/analytics/tech_indicators/parabolic ************************************************************* Hey traders!! Give me your feeds! We are a community here and we have the sa
FREE
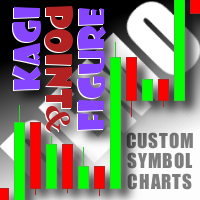
This non-trading expert utilizes so called custom symbols feature to build custom charts based on history of real ticks of selected standard symbol. New charts imitate one of well-known graphic structures: Point-And-Figure (PnF) or Kagi. The result is not exactly PnF's X/O columns or rectangular waves of Kagi. Instead it consists of bars, calculated from and denoting stable unidirectional price moves (as multiples of the box size), which is equivalent to XO columns or polygonal lines. These Poi
FREE

This EA offers functions: start trading, end trading, close order (time), pending order placement (time), Recommendations: Symbol: DE40, US30 Time Frame: Any Minimum deposit: $300 (leverage 500) The lower the leverage, the bigger account. Account Type: ECN, Raw or Razor with very low spreads. The pyramid scheme works like this: If Pyramid Manager is set to true in Settings, the following happens. Pending orders are placed in both directions. Number of total orders adjustable. If Fixed Profit T
FREE

This indicator will mirror the assets in use in another metatrader, being able to choose the timeframe and a template. This is the Metatrader 5 Client, it needs the Metatrader 4 or 5 Server versions: Metatrader 4 Mirror Chart Server: https://www.mql5.com/en/market/product/88644
Metatrader 5 Mirror Chart Server: https://www.mql5.com/en/market/product/88652 Details of how it works in the video.
FREE
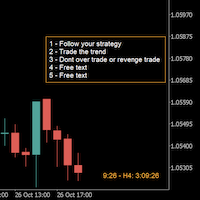
A good trader is a trader that respect his plan and keep the head cool. This indicator allow to display up to 5 lines of text for the things you always to see.
Congifuration 5 lines of text Text font, color, size Frame on/off, color, style, size Position of the text anchored Corners or anywhere on the screen Any questions or comments, send me a direct message here https://www.mql5.com/en/users/mvonline
FREE

The Oscar, one of my favorite indicators. This is my enhanced Version of it with more options and better visuals. Many different averaging methods Oscar changes color on signal cross, but not too volatile (3% extra threshold) Adaptable Divisor, higher numbers lead to more signals, due to higher fluctuations. Its a fast but quite accurate trend direction indicator. Play around with the settings and make it match to your setup. GL trading Please follow me on Twitter https://twitter.com/semager and
FREE

Overview The script displays information about the trade account: Information about the trade account: Account - account number and type (Real, Contest or Demo); Name - name of the account owner; Company - name of a company that provide the access to trading; Server - trade server name; Connection State - connection state; Trade Allowed - shows whether trading is allowed on the account at the moment; Experts Allowed - shows whether it is allowed to trade using Expert Advisors; Balance - account
FREE
Description This is a utility tool for MT5, and it displays some useful information on charts for discretionary trading. Some of the information obtained by using indicators that are standardly installed by MT5 or by manual calculation is displayed on the chart from the beginning.
Benefits of the This Is Something Useful MT5 The minimum necessary information that needs to be confirmed in discretionary trading can be displayed on the chart at any time. By using this tool, you can quickly acces
FREE
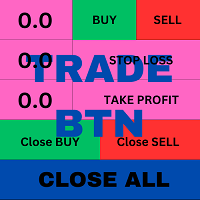
T his is an ON CHART trade management panel. In other words, ON CHART Lot Size, Buy, Sell, Stop Loss, Take Profit, Close Buy, Close Sell and Close All buttons! *IMPORTANT NOTE: Input settings are NOT usable. You can change or insert Stop Loss and Take Profit values only on the chart panel. (See the below video!) This one is MT5 version!
BUTTONS List: 1. Lot Size - (0.01) is default click on it and insert the lot size with which you want to open a trade. 2. Stop Loss - (0.0) is default click on
FREE

Corretora recomendada para usar esse indicador: https://tinyurl.com/5ftaha7c Indicador que pinta o candle de amarelo em pontos de muita agressão no mercado. Sempre que o mercado for se movimentar o candle irá ficar amarelo. Valido para todos ativos e todos timeframes. SEE OUR RESULTS ON INSTAGRAM: https://www.instagram.com/diogo.cansi/ TELEGRAM GROUP = https://t.me/robosdsc More information by email dscinvestimentos@gmail.com or by Whatsapp 55-991372299
FREE
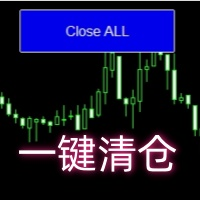
Close all open orders, delete all pending orders, and clear the entire account's orders. Please use caution! After clicking the button, the account order will be 0! Help us quickly clear account orders! As it is a free version, only the function of closing all orders is available. If other functions are needed, customization is required! The paid version has more features!
FREE

O Chart Control é um indicador que permite de forma rapida e pratica alterar o timeframe e ativo do grafico, possibilitando que voce possa fazer todas as suas analises em apenas um grafico sem precisar abrir vários, além disso voce pode escolher o entre os temas claro e escuro para o qual melhor se adapta a sua preferencia.
MT4: https://www.mql5.com/pt/market/product/112155
FREE

This is a Price Projection for Current Candle from Time Frame M15 To Weekly, It's shows Market Trends Teji (Bullish) Or Mandi (Berries). It's Show Teji High & Low for Bullish Market and Mandi High & Low for Berries Market. We can Plan Our Trade in Well Advance for our Current Open Trade. It's Generate New Data for Every New Candle. You are requested to Please Test it with demo Ac before Use in Real Trade. Please Save it to your Mql\Indicator folder and attache to your chart. if any quay Please
FREE

An Adaptive Moving Average (AMA) is one more moving average overlay, just like EMA. It changes its sensitivity to price fluctuations . The Adaptive Moving Average becomes more sensitive during periods when price is moving in a certain direction and becomes less sensitive to price movement when price is volatile. For more information, welcome to our Telegram Group. https://t.me/InfinXx
FREE

Please, if you like this AE, I would appreciate it if you could rate it with 5 stars ️ ️ ️ ️ ️ THANK YOU!!
The expert advisor includes the following parameters: Magic number: Maximum slippage: Stop loss (pips): Take profit (pips): Trailing stop (pips): Trailing step (pips): Fixed lot or Risk: Info panel: This expert advisor does not use any dangerous strategy, such as martingale or grid, which can generate a total loss of the account. The Expert Advisor incorporates an inf
FREE

主要城市的时间。北京时间、东京时间、悉尼时间、惠灵顿时间、纽约时间、法兰克福时间、伦敦时间、迪拜时间。 城市时间可选择开启或者关闭。 点差变色提醒。设置点差提醒点数,例如,设置100点,点差大于100点,文字会变红色。 Time in major cities. Beijing time, Tokyo time, Sydney time, Wellington time, New York time, Frankfurt time, London time, Dubai time. City time can be turned on or off. Dot difference color change reminder. Set the point difference reminder points. For example, set 100 points. If the point difference is greater than 100 points, the text will turn red.
FREE

This indicator show color of trend. And combined with the average line, but be used on the hightest price and the lowest of the 26 period. The target entry at the level and the point of the route between 2 line for entry and exit position This is a first version, many problems is not supported and fine. Expected a contected from your friends To continue to follow the good products
FREE
Background
This product is a practical tool to check the market based on the cycle theory . When you need to use multi cycle charts to analyze a symbol , manually adding charts with different cycles and applying templates is a very large cost. This product can help you quickly add multi cycle charts of one or more symbols, and uniformly apply the same template . After adding, you can drag the charts to the sub screen, which is suitable for multi screen analysis. Usage Method Apply this script t
FREE

Track the historical outcome of your options operations on your favorite asset. It works for any asset in the spot market that has authorized option series on B3 (Brazilian stock exchange). Associate the robot with the asset you want to record and monitor its operation history and results. How to use the robot: 1. Enter historical data for your operations: Purchases and sales of the asset Purchases and sales of options on the asset Received dividends Cash inflows and outflows 2. Monitor the rea
FREE

Стрелочный индикатор, выдающий сигнал при пересечении канала боллинждера. Сигналы выдаются в виде стрелок и подходят для торговли бинарными опционами.
Входные параметры Period of BB - период боллинджера Shift of BB - смещение боллинджера Deviation of BB - отклонение боллинджера Inform about finding the signal - параметр, отвечающий за получение уведомлений (Alert) о найденном сигнале. По умолчанию - да
FREE

(Google 번역) 이 지표는 John Welles Wilder의 ATR(Average True Range) 에서 영감을 받았지만 몇 가지 추가 정보가 있습니다. 마찬가지로 실제 범위의 지수 이동 평균을 계산하지만 와일더 대신 표준 알파 가중치를 사용합니다. 또한 범위 평균의 평균 편차를 계산하여 오프셋으로 표시합니다. 이렇게 하면 변경 사항을 더 빠르게 식별할 수 있을 뿐만 아니라 그 영향도 파악할 수 있습니다. (Original text) This indicator was inspired by John Welles Wilder's average true range (ATR) , but with some extra information. Similarly, it calculates the exponential moving average of the true range, but using the standard alpha weight instead of Wilder's . It a
FREE

The Retracement indicator shows the current and historical high, low and mid values. Optionally, it can also display major retracement levels. All these levels together form the significant levels of support and resistance. Therefore, it is essential to know them for every kind of trader.
Levels High Low Midpoint 76,4 % 61,8 % 38,2 % 23,6 %
Main features The indicator shows the actual levels of High, Low, Mid and selected retracements. Four optional retracement levels. Alert notificatio
FREE

The Commitments of Traders Ratio Indicator is one of these things you never thought about it before you really see the magic behind it. The indicator shows the Ratio of long/short positions released by the CFTC once a week.
If you have a look on the Sreenshot you can see two (three) zones of interest. Important note: MAs are not available in version 1.0. Zone 1: The Switches (Red -> Green, Green -> Red) Zone 2: MA cross Zone 3: If you combine this with the COX indicator an additional zone will
FREE

Less is more. Find the strongest trends! This expert scans ALL currency pairs for a strong trend combined with a breakout.
Requirements for a trend report: 1. Up-trend or down-trend must be found in all of the following timeframes (D, H4, H1, M30) 2. Breakout in the daily timeframe (the upper or lower band of the Bollinger band must be broken)
The correctness of the trend is confirmed to 90%
FREE

This indicator can be used to study the repeating daily volatility structure, and also find deviations from the historical means. Black line tells the average volatility of current hour from last 30 days. Blue bands tell the confidence interval (2 times standard deviation). Red line tells the current volatility, ATR.
Inputs: - days: the number of days where to calculate the average volatility - atrp: the ATR period used to measure volatility
FREE
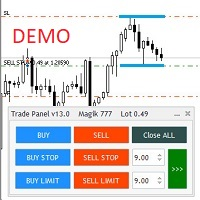
Бесплатная версия советника Trade Panel PRO
Данная торговая панель предназначена для быстрой и удобной торговли в один клик. Создавался продукт для частичной автоматизации своей личной ручной торговли https://www.mql5.com/ru/signals/1040299?source=Site+Profile+Seller Советник имеет ряд возможностей, а именно: Открытие BUY или SELL ордеров. SL выставляется ниже (выше) минимальной (максимальной) цены, задаваемых в параметрах количества свечей. Размер TP рассчитывается в соотношении от размера
FREE

White label available. contact us for more info. dushshantharajkumar@gmail.com
Slides by Chart Walker "Slides" is a MetaTrader 5 (MT5) utility designed to streamline chart navigation by facilitating automatic chart switching. With "Slides," users can preset specific time intervals for chart rotation, enabling automatic transitions between different financial instruments or timeframes. This utility proves invaluable for traders who monitor multiple charts simultaneously, as it optimizes wo
FREE

--- StudentK Sync Chart --- 1. Move charts at the same time 2. Cross check among different Symbols and Timeframes 3. Plan your own trading strategies
=== Simple (Free) Version ===
1. Allow USDJPY only
2. Support M5 and M15
3. * Contact StudentK for unlocking all timeframes *
--- Context --- StudentK is not indicated as a master or K Sir for knowledgeable person who claims for winning all the time. (But lots of traders should know the fact that it is rarely truth, especially in fluctuat
FREE

Simple script for Buy by Market Execution on all financial instruments.
Inputs Volume - default: 0.10 Deviation - default: 10 points Stoploss - default: 50 points Takeprofit - default: 50 points Comment - default: Order by Market Confirm - default: false
Inputs Details Type Order Buy Order is preset. Deviation Maximum deviation from quoted price in points. Stoploss & Takeprofit In points value, be careful that this value will be added to minimum stop allowed by the broker. For example if you
FREE

Universal Webhook is utility to send MT5 ORDER and TRANSACTION event
Compatible with any Webhook Server
Features:
Basic Auth Support Custom Authorization header support Custom Header Support Automatically Sends Webhook on OnTradeTransaction event. Automatically bring Trade Account information (configurable)
Specially made because of request from WebhookPrinter.com users, but feel free to use.
Sample Webhook Payload: { "event": " TRADE_TRANSACTION_ORDER_ADD ", "account": [ {
FREE

The "Takeandstop" script is a powerful tool designed to streamline your trading workflow by automatically setting Take Profit (TP) and Stop Loss (SL) levels on your MetaTrader 5 chart. This script is particularly useful for traders who want to efficiently manage their risk and reward without the hassle of manually calculating and entering these levels. Key Features: Effortless TP and SL Placement: With a few clicks, the script allows you to set predefined Take Profit and Stop Loss levels for you
FREE

This is a simple indicator type thing to track potential total risk if all the stop losses to be hit. It gives the some of the total stop losses for a certain currency in positions and orders. These are the functions. (I will add more functions later, eg - total profits per symbol etc.) ( Add a comment if you need any feature. I will add it ) Total risk exposure - This is the total risk that can happen if all the stop losses in positions and open orders were to hit. Total positions risk - This i
FREE

This EA provides: Grid buy button and grid sell button When pressed, it enters market then subsequent layers as pending order separated by pips value for each layer. Close all button When pressed it closes all running positions and pending orders. This expert advisor does not provides means to automatically add take profits and stop losses. User must specify it manually.
FREE

A utility for automatically detecting the GMT offset of your broker To use the utility, place it in the Scripts folder of the terminal data directory, enable WebRequest in the terminal settings and add the address https://www.worldtimeserver.com/ to the list of allowed ones. Run the Check GMT script on the chart with any currency pair There is only one setting in the script: site = https://www.worldtimeserver.com/ just for your convenience. Copy this address from the sc
FREE

Pairs Navigator is a simple and easy-to-use tool that allows you to view all of your charts in a single window. This eliminates the need to open multiple charts from the Market Watch window, saving you time and effort. Pairs Navigator is also very lightweight, so it will not put a strain on your RAM or cause your MT4/5 platform to hang. To use Pairs Navigator, simply drag and drop the currency pairs you want to view into the Pairs Navigator window. You can then easily switch between charts by
FREE

This is a tool to estimate your probability of bankruptcy. features. estimate a probability of bankruptcy (Nauzer J. Balsara) from your trade history usually, it is small print and never interfere with trades alert in large prints and color when it exceed the alert level you can set parameters(i.e. winning ratio) fixed and simulate freely *1: this value is for reference only and is not guaranteed to occur.
FREE
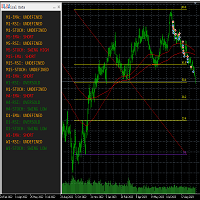
This tool helps to get a quick overview of a market. In one panel, indicators show trend, swing highs/lows and overbought/oversold information of various time frames (M1,M5,M15,H1,H4,D1,W1). Fibonacci can be used to identify different price levels. The input parameters of all indicators can be set by the user. The time frames can be changed as desired. The user can decide for himself which indicators he would like to see in the panel. Fibonacci appears on the chart at the next minute change at t
FREE
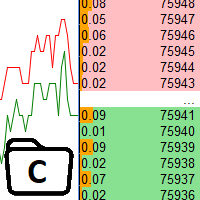
The utility is designed to control the update rate of the order book (or several) in the strategy tester. Management is carried out by a library, which is available here https://www.mql5.com/en/market/product/81400 Interface description: S/P Start and pause playback --- Decrease the speed by one step +++ Increase speed by one step R Updating the character list <0> Slider, moving left/right change the playback speed, after releasing the mouse it is restored to its original state. The
FREE

This indicator shows the value of returns in the selected time frame
They are calculated as logarithm of returns , rather than price or raw returns. For small returns, arithmetic and logarithmic returns will be similar. The benefit of using returns, versus prices, is normalization. It is possible measures all variables in a comparable metric despite originating from price series of unequal values
Inputs You can display data both as a Histogram or a Line It's also possible to display the
FREE

TRAILINATOR is a unique Solution to use different Trailing-Stop Variants and change your settings via Remotecontrol. You configure your Trailing-Stop for a specified Symbol only once. This setting will be used for all your Positions of the same Symbol. Currently we support these different Trailing-Stops: Standard : works like you use in Metatrader Terminal, starts trailing if your profit is greater than trailing stop Start after points : trailing stop will start after your defined points in p
FREE

The utility draws reversal levels using the formulas for each of the selected number of candles:
Pivot = (high + close + low) / 3 R1 = ( 2 * Pivot) - low S1 = ( 2 * Pivot) - high R2 = Pivot + (R1 -S1) R3 = high + ( 2 * (Pivot - low)) S2 = Pivot - (R1 - S1) S3 = low - ( 2 * (high - Pivot)) H = high L = low U = if the candle is bullish, then close. Otherwise - open D = if the candle is bullish, then open. Otherwise - close
On any timeframe.
After a new candle closes on the calculated timefr
FREE

The SyntheticaFX Indicator serves as a valuable tool for identifying potential regions of price reversal in the market. It achieves this by scrutinizing how an asset's price has historically reacted to specific levels, enabling it to pinpoint areas where a shift in market direction may be imminent. This indicator is presented in a dedicated window, featuring bars along with a central reference line set at 0.00. These elements collectively convey crucial information about the prevailing market se
FREE

All utilities of my experts advisors included in a single one. Includes: Raba Time Scheduler EA Raba Challenge Manager EA Raba BreakEven and Trailing StopLoss EA Notes: Auto enabling/disabling algo trading is disabled due to MQL Market policies.
I you have any doubt you can leave it in comments and I will anwer it asap. If you found this tool helpful for you, a comment and a good rating will be appreciated. Also any proposal will be taken into account for future versions.
FREE

Это специальная утилита, для подключения внешнего индикатора к торговой панели . Она позволяет получать данные из буфера индикатора и рисует стрелочные объекты для передачи их в торговую панель. Входные параметры
Number of call buffer - номер индикатора для покупки Number of sell buffer -номер индикатора для продажи Indicator window - окно индикатора Indicator position in list - позиция индикатора в списке Default value of indicator - значения по умолчанию для индикатора Show information - пока
FREE
Traders Club Clock for MT5 Readme
ローソク足のすぐ横にその時間足での 残り時間とスプレッドを表示します。 ※残り時間はサーバ時間から計算しています。 月足、週足、日足、4時間足、1時間足、30分足、15分足、5分足、1分足
で表示可能となっております。
※スプレッド値ポイント単位での表示になります。
※時間の更新はティック毎ではなく1秒 毎 に更新するようにしています。
一目で残り時間とスプレッドを確認できます。 機能: 使用しているフォント種類を変更できます。 使用しているフォントサイズを変更できます。 表示しているテキストの色を変更できます。 スプレッド表示を非表示にすることができます。 表示する位置を変更することが出来ます。
FREE

Простейший индикатор для ручной торговли. Для комфортной торговли так же имеется эксперт https://www.mql5.com/ru/market/product/41133
Суть идикатора: уровни строяться на основе Moving Average с выбранным периодом по ценам High и Low. На разнице между High и Low строятся следующие уровни выше и ниже. В случае если бар не выходит за уровни, помечается зеленой меткой. Данную метку и уровни можно использовать для выставления отложенных ордеров когда цена на долго застревает между уровнями. Входны
FREE
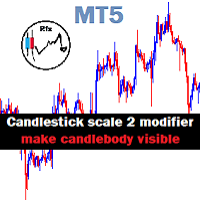
Chart Candlestick scale 2 zoom will visible instead of just a tiny unrecognized line make it look neat and tidy Instruction.
If you don't like the candles colors, you can do so by changing color. read below:
-Colors must be changed in the indicator setting.
-It won't change through the Chart properties to modify.
-After changing the color, save it as template so it wont change the colors to default value.
FREE

TickChart Indicator plots tick line on the main window of MetaTrader.
In the Lite version, the number of ticks is limited to 20 and the alert function described below is omitted. The tick-line shows the most detailed, fastest and real-time activities of the market, which are usually hidden in bars or candles longer than 1 minute. Usually, several new tick-line segments appear while a bar of M1 time frame is completed. After the release of an important economic indicator, the number of ticks pe
FREE

US 30 BOT This is a simple quantitative model that trades US30 Index from NASDAQ top 30 American stocks It uses volatility contraction and expansion as a basic theory. Place it on US30 chart ,any timeframe. Hedging accounts are advised. NB: Standard accounts are preferred and well regulated brokers eg ICMarkets are advised to avoid unnecessary losses eg slippage ones, commissions and large spreads. Minimum account balance ADVISED : USD 100 set activate to true in inputs section NB: These
FREE

This is Gekko's indicator of quotations and variations. It summarizes quotations and variations of the current symbol in different timeframes as well as other correlated symbols. Keep track of all this information on your chart while you are negotiating for decision making support. Input Parameters General Settings: configure which quotations and variations you want to keep track for current day, week, month or year as well as M1, M5, M15, M30, H1 and H4 charts; Symbols Configuration: add up to
FREE

Привет. Сегодня представляем индикатор корреляции - SynchroWindowTomson. Индикатор в одном окне показывает движение нескольких инструментов, по отношению друг к другу, удобно определять направление и изменение, особенно когда вы работаете с целым портфелем разных инструментов и нужно определить какой из них тянет результат назад и движется в другую сторону. Так же видны точки разворота спреда.
FREE

Indicador Regressão Linear – Par de Ativos Indicador é um oscilador que faz o plot do Resíduo resultado da regressão linear entre os dois ativos inseridos como input do indicador, representado pela fórmula: Y = aX + b + R Onde Y é o valor do ativo dependente, X é o valor do ativo independente, a é a inclinação da reta entre os dois ativos, b é a intersecção da reta e R é o resíduo. O resíduo representa a quantidade da variabilidade que Y que o modelo ajustado não consegue explicar. E os resíduos
FREE
MetaTrader 마켓은 과거 데이터를 이용한 테스트 및 최적화를 위해 무료 데모 거래 로봇을 다운로드할 수 있는 유일한 스토어입니다.
어플리케이션의 개요와 다른 고객의 리뷰를 읽어보시고 터미널에 바로 다운로드하신 다음 구매 전 트레이딩 로봇을 테스트해보시기 바랍니다. 오직 MetaTrader 마켓에서만 무료로 애플리케이션을 테스트할 수 있습니다.
트레이딩 기회를 놓치고 있어요:
- 무료 트레이딩 앱
- 복사용 8,000 이상의 시그널
- 금융 시장 개척을 위한 경제 뉴스
등록
로그인
계정이 없으시면, 가입하십시오
MQL5.com 웹사이트에 로그인을 하기 위해 쿠키를 허용하십시오.
브라우저에서 필요한 설정을 활성화하시지 않으면, 로그인할 수 없습니다.