MetaTrader 5용 무료 Expert Advisor 및 지표 - 31

Normalized Candlestick shows candlesticks which are filtered by volatile price action activities. It filters big price movements that caused by big players and news. It shows candlesticks based on actual psychological reason to go up or down in normal circumstance.
It was originally made to find actual reversal points that depends on support and resistance levels. But big players and news can cause price to be volatile and move support and resistance to new level dynamicaly. In order to norma
FREE

The Co-Pilot is a simple trade management system designed to be the quickest way from your strategy to the market. It is optimized for single trade setups that might be short, medium or long term. The program allows you to set your trade setup directly from the chart using graphical objects, set your risk apetite and even provides oppurtunity for partial closes. It also has a built in alert system that keeps you informed on the actions taken by the copilot when youre offline.
It is designed to
FREE

Introducing our cutting-edge Trade Copier Expert Advisor for MetaTrader 5 (MT5) – the ultimate solution for seamless trade replication across multiple accounts on the same server or computer. Elevate your trading experience and take control of your investment strategy like never before with our professional-grade Trade Copier. Key Features: Effortless Trade Replication: Our Trade Copier effortlessly duplicates trades from a master account to multiple slave accounts, ensuring that you never miss
FREE

The Martinware Closing Time Alarm indicator serves to warn traders that the current period (bar, candle) is about to end.
Input parameters: Time offset: with how many seconds before the ending of the current period the alarm must trigger
Alert with sound: informs if the alert should include playing a sound
Sound selection: a list of sounds available
Custom sound: name of the custom sound file to be used in case "custom sound" was selected. It must be inside a folder named "Sounds", this o
FREE

Indicator that show candlestick bars with an different sampling method than time fixed. Real time data is sourced to the indicator and it may be used as substitute of the default graph. Each bar is formed when a predefined amount of ticks is received, showing in the graph the OHLC of this clusteri of ticks. The input variable is the amount of ticks of each bar. It's a different approach of sampling, the amount of bars is proportional to the amount of negotiations insted of a sample in a fixed am
FREE

Recomended broker: https://tinyurl.com/5ftaha7c Indicator used to monitor price fluctuations in the market and discover possible reversals through reversal points or divergences in the indicator. All assets and all timeframes. SEE OUR RESULTS ON INSTAGRAM: https://www.instagram.com/diogo.cansi/ TELEGRAM GROUP = https://t.me/robosdsc More information by email dscinvestimentos@gmail.com or by Whatsapp 55-991372299
FREE

The Commodity Channel Index computes the deviation of the typical price of each bar from the average price over a particular time period. Multiplying the median deviation by 0.015 facilitates normalization, which makes all deviations below the first standard deviation less than -100, and all deviations above the first standard deviation more than 100. This adaptive version is based on the indicator described by John Ehlers, in the book Rocket Science for traders. The indicator uses the homodyne
FREE

================ // Average period ma_Sma, // Simple moving average ma_Ema, // Exponential moving average ma_Smma, // Smoothed MA ma_Lwma // Linear weighted MA =============== // Average method // Turn alerts on? // Alert on current bar? // Display messageas on alerts? // Play sound on alerts?
FREE

Upon launching the script, you will need to specify three parameters: the desired Take Profit, an acceptable Loss level, and a Magic number. Following this, a panel with five buttons is generated: Close all trades - regardless of profit or loss. Close only BUY trades. Close only SELL trades. Close trades with profits greater than Take Profit. Close trades with losses exceeding Loss. All closures are performed ONLY based on the specified Magic number. The panel can be moved within the chart windo
FREE

The indicator converts two moving averages into histograms and paints their intersection area.
There is a shift trick setting, it is used to smooth the result of calculations. You can see the changes if you reduce this parameter to 1 (minimum value).
Available averages:
MA Simple MA Exponential MA LinearWeighted MA Smoothed DEMA TEMA and
RSI - as a bonus By default, the fast MA is displayed at the top of the histogram, and the slow one at the bottom. You can swap them if you like.
shi
FREE

This EA automatically closes all Open Trades and Pending Orders at your specified Date & Time. There is no option in Meta Trader to automatically close all Open Trades and Pending Orders at your specified Date & Time. Here comes this EA “Time Based AutoCloser” using which you just provide your desired Closing Date & Time and on reaching it, all open trades and pending orders will be automatically closed. Input of EA
Your Desired Closing Date & Time (for example 2023.01.31 12:30) (Please note
FREE

OnBoard stats is a panel that show in a single view a lot of usefull information about working orders and trading account. It has 4 different sub-panels (from left to right): Symbols order statistics : it can be found symbols for which there are orders (market or pendings). Symbol with pendings are colored with "Pendings color". Clicking on a specific symbol row, chart will be changed to that symbol. Current symbol statistics : informations about the "current" symbol, the one which is opened in
FREE

This indicator allows you to visually identify with a different color the candlesticks that exceed a certain limit of the ATR.
Just drag and drop it on the chart.
The user must enter the value of the ATR period.
The user must enter the value of the ATR limit with which he wants to identify the candlesticks.
In the colors tab, the user can select the colors with which to repaint the candles.
It is recommended that the first color always be None.
The second color corresponds to b
FREE

Double Line Donchian Channel MT5/Meta Trader 5 Indicator, this is customized Indicator to show only 2 Lines of Highest and Lowest PRICE line where you can add a MA (MOVING AVERAGE) for center line. What is Donchian Channel?
Donchian Channels are three lines generated by moving average calculations that comprise an indicator formed by upper and lower bands around a midrange or median band. The upper band marks the highest price of a security over N periods while the lower band marks the lowest
FREE
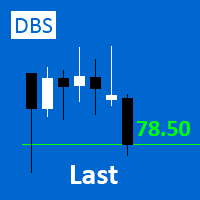
A small utility displays the value of the last price (Last) to the right of the chart. The Last price is the price at which the last deal was executed. Utility is convenient to use for screens with small print, for visual observation of the price level (value) or for people with poor eyesight. You can customize: Growth color Fall color Text font Font size Offset text
FREE

Description: Protect your live or evaluation accounts by not letting it hit the maximum daily draw down! This utility is best for prop firms such as FTMO and MFF(MyForexFunds) and etc. Guide: Apply to EURUSD 1m Chart.
Default Settings: Maximum Draw Down Balance: 4% Account Balance. Maximum Draw Down Equity: 4% Account Balance Target Profit Balance: 1% Account Balance. Target Profit Equity: 1% Account Balance. Time To Reset: 16:57 to 16:58 GMT
Behavior: Setting starting_balance to 0 will au
FREE

JCStatistics 简繁数据统计 1.显示账户信息:内容显示 交易员、账号、本金、杠杆、保证金、保证金比例、余额、净值; 日周月开盘余额、持仓收益、日收益、周收益、月收益; 收益为正时显示红色字体,收益为负时显示绿色字体; 日收益低于-5%时显示CircuitBreak; 总收益低于-10%时显示MarginCall; 2.显示统计数据: 收益(收益率)(交易量)(胜率) 5日数据;4周数据;12月数据; 3.当前标的统计:Symbol()收益(交易量)(胜率) 4.主流标的统计:收益(交易量)(胜率) 可以选择性显示账户信息、数据信息,调整显示颜色,调整字体,调整字体大小。 指标删除后自动删除桌面文字及背景。 备注:如遇使用问题,请联系邮箱:16692618587@qq.com.
FREE

ProFactor is an indicator generating signals based price on the famous profit factor formula. The calculation is simply defined as gross GREEN BARS divided by gross RED BARS.
That's it in a nutshell, but sometimes the simplest things hold the most value.
So let's imagine your trading system's gross profit for the past year was $40,000 and your gross losses were $20,000. Your Profit Factor would be 2. The ProFactor calculation works on the price of the asset instead of the strategy out
FREE

The indicator draws actual Fibonacci levels for your trading activity.
The levels are redrawn every time after the price touches the low (0%) or the 100% fibonacci level.
In the parameters, select the trading activity: Long term investor Medium term investor Medium-term investor active Short term investor Short-term investor active Speculator Speculator active Scalper Scalper active Try this indicator in action, and you will no longer have to look for coordinates for drawing fibonacci level
FREE

Готовый автоматический советник, торгует на классических индикаторах. Создан специально для EURJPY Таймфрейм Д1 .
Суть стратегии - отрабатываются месячные уровни инструмента EURJPY . Используются классические стоп-лоссы, тейк-профиты и трейлинг-стоп. Рекомендуется закрытие сделок в пятницу в 21-00 ( ExitOnFriday = true) Настройки советника: MagicNumber = 100 ; //MagicNumber тактики 1 MagicNumber2 = 11111; //MagicNumber2 тактики 2 magic3 = 123 ; //magic3 тактики 3 mag
FREE

Индикатор Envelopes gaussian - это стандартный Envelopes с обработкой фильтром Гаусса. Преимущество данного индикатора в меньшем запаздывание от стандартного индикатора.
Входные параметры: Period - период индикатора по умолчанию 14 Deviation - ширина канала по умолчанию 0.1 Shift - смещение индикаторных линий от цены в барах. По умолчанию 0 Индикатор пригоден для использования в советниках
Буфер 0 — верхняя линия индикатора;
Буфер 1 — нижняя линия индикатора;
FREE

For traders, monitoring price movements is a constant activity, because each price movement determines the action that must be taken next.
This simple indicator will helps traders to display prices more clearly in a larger size.
Users can set the font size and choose the color that will be displayed on the chart. There are three color options that can be selected to be displayed on the chart.
FREE

Color Candle Indicator. The indicator implements a breakout system using the channel. When price exits the gray channel, the candlestick color changes to the color corresponding to trend direction. Blue for growth, yellow color for fall. Bright colors denote coincidence of trend direction and direction of a candlestick. Dark colors correspond to the situation when the direction of a candlestick is opposite to trend.
FREE

This indicator looks for 3 rather strong patterns: Spinning Top pattern Hammer or Hanging Man Inverted Hammer or Shooting Star These patterns may indicate a trend continuation or its reversal, depending on the location of the patterns.
Input parameters Distance - distance between the signal and the formed signal Note: the higher the timeframe, the greater the value should be used in Distance to display the signal correctly
Indicator Features Suitable for any currency pair Operating timeframe
FREE

The "Takeandstop" script is a powerful tool designed to streamline your trading workflow by automatically setting Take Profit (TP) and Stop Loss (SL) levels on your MetaTrader 5 chart. This script is particularly useful for traders who want to efficiently manage their risk and reward without the hassle of manually calculating and entering these levels. Key Features: Effortless TP and SL Placement: With a few clicks, the script allows you to set predefined Take Profit and Stop Loss levels for you
FREE

The indicator based on Bollinger Bands parameters determines the bar's position and displays the value in the indicator window.
When a bar closes below the lower Bollinger Bands line, the indicator value becomes negative.
In such a case, one can expect an imminent market reversal and an upward movement.
When a bar closes above the upper Bollinger Bands line, the indicator value becomes greater than 1.
In such a case, one can expect an imminent market reversal and a downward movement.
It
FREE

Thank you for your interest in The Tail.
I have been trading since 2018. Or rather, it’s not me who trades, but the army of my robots, which I constantly develop. Tail is one such candidate.
This robot works on moving averages, filters trades by RSI.
The robot provides the functionality of volume and position control.
Combine different approaches. I recommend using it in a group of 3-5 of the same robots on different instruments for the best result.
I recommend keeping a high value of
FREE

Please, if you like this AE, I would appreciate it if you could rate it with 5 stars ️ ️ ️ ️ ️ THANK YOU!!
The expert advisor includes the following parameters: Magic number: Maximum slippage: Stop loss (pips): Take profit (pips): Trailing stop (pips): Trailing step (pips): Fixed lot or Risk: Info panel: This expert advisor does not use any dangerous strategy, such as martingale or grid, which can generate a total loss of the account. The Expert Advisor incorporates an inf
FREE

Stat Monitor is a good information indicator.
Benefits of the indicator: The indicator provides useful information - the current spread, the cost of one lot of the symbol, trading leverage and the recommended lot size for trading. You can use the indicator on the MetaTrader 5 trading platform of any broker. The indicator provides useful information.
Version of the Stat Monitor indicator for MetaTrader 4 I wish you all good luck in trading and stable profit!
FREE

The Indicator indicator draws 2 clouds based on Envelopes indicator values. The upper cloud is formed by the upper lines values and the lower cloud by the lowers lines values. The indicator allows to change the Envelopes parameters and the clouds colors the period of the base line and the deviations of each Envelopes instance. The indicator holds 5 buffer index as follow: [0] - Outer values of the upper cloud [1] - Inner values of the upper cloud [2] - Base/Center line values [3] - Inner valu
FREE

Что такое MACD? Обычный MACD – это осциллятор хотя его часто называют трендовым индикатором, или даже «трендовым осциллятором». Происходит это потому, что MACD строится на основе показаний двух скользящих средних. Чем отличается MACD DA?
В MACD DA используется специальный ценовой фильтр. Только после фильтрации строится индикатор. Гистограмма отображает степень расхождения двух скользящих средних: если одна удаляется от другой, то растут и столбики гистограммы, если сближаются, тогда столбц
FREE
The Tick Flow Meter, also known as Tick Density Meter or Tick Counter, is an innovative indicator designed to provide deep insights into market dynamics down to the second.
It is a cutting-edge indicator crafted to measure the intensity and frequency of ticks within specific time intervals. By focusing on tick flow, this indicator offers traders a unique perspective on market liquidity, momentum, and volatility, empowering them to make informed trading decisions.
Key Features: Granular Tim
FREE
Description This is a utility tool for MT5, and it displays some useful information on charts for discretionary trading. Some of the information obtained by using indicators that are standardly installed by MT5 or by manual calculation is displayed on the chart from the beginning.
Benefits of the This Is Something Useful MT5 The minimum necessary information that needs to be confirmed in discretionary trading can be displayed on the chart at any time. By using this tool, you can quickly acces
FREE

The Scaled Awesome Oscillator (SAO) represents a refined adaptation of the Awesome Oscillator, aimed at establishing consistent benchmarks for identifying market edges. Unlike the standard Awesome Oscillator, which records the variation in pips across different commodities, the only unchanging reference point is the zero line. This limitation hampers investors and traders from pinpointing specific levels for trend reversals or continuations using the traditional Awesome Indicator, a creation of
FREE

Hello and welcome ladies & gentlemen :) this is the MT5 version of this free tool for my lovely people :) It's very simple tool to set Stoploss for your orders or positions within milliseconds whatever how much this orders count , Just drop the EA on the chart that you want to modify the SL for it's orders and fill the INPUTS as the following : - ( Order_Type ) Select the orders or positions types . - ( StopLoss ) Write the SL you want . - ( MagicNumber ) Use magic number 0 for manual cre
FREE

Source code only at 500 usd The Time Range Breakout Strategy is an advanced, automated trading solution designed to capitalize on market movements within specific time intervals. Developed for the MetaTrader platform using MQL5, this strategy identifies key breakout points within a user-defined time range and executes trades accordingly. Here's a detailed description of the product for sellers: Product Overview Time Range Breakout Strategy Product Highlights: Automated Trading : Executes buy and
FREE
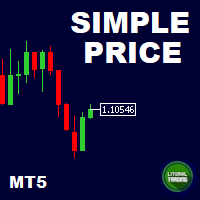
This is our simplest tool! With it you hide the Bid and Ask lines from chart and have only a small rectangle showing what current price is. This tool is useful for those who want the cleanest chart possible. You can also show the Ask price only, instead of the Bid (most common). To further assist you in cleaning the chart check out our other tool: https://www.mql5.com/en/market/product/41835 Any questions or suggestions, please contact us. Enjoy!
FREE
This is a demo version, only 0.01 lot is alowed Full version: https://www.mql5.com/pt/market/product/73259 EA uses the value of the ATR indicator as a decision to open a trade, very useful to trade in the first moment of a big movement, because the ATR indicator is able to track the size of the movements in the period chosen by the user. The user includes the period of the indidacor ATR and the value/size that it is of interest to open a trade, the operation will take place in same direction o
FREE

This EA offers functions: start trading, end trading, close order (time), pending order placement (time), Recommendations: Symbol: DE40, US30 Time Frame: Any Minimum deposit: $300 (leverage 500) The lower the leverage, the bigger account. Account Type: ECN, Raw or Razor with very low spreads. The pyramid scheme works like this: If Pyramid Manager is set to true in Settings, the following happens. Pending orders are placed in both directions. Number of total orders adjustable. If Fixed Profit T
FREE

An easy indicator that simply shows the moment we connect to the market. We can easily see what has happened while we were gone because the line has two different colors that show the start time. It is only that, a visualization aid that allow us to mark the market behavior while it was night time in our country, or if we have stopped several hours. Input: Server start working date: Day of month Month Year Hour Minutes
FREE
Long Term Double MACD Strategy with EMA Trend Confirmation
This strategy uses a leading and lagging MACD indicator. The leading indicator gives the entry signals, and the lagging indicator gives the exit signals. This Expert does not use any account management and as such you should make sure to set good stop losses.
Works best on longer timeframes on low volatility pairs.
FREE

The indicator shows the current spread of the symbol, the minimum, average and maximum values for the current bar in the form of digital, analog and graphic indicators. Has two modes of operation: fixing the system spread, or calculating the spread as the difference between the "Bid" and "Ask" prices on each incoming tick. Parameters The indicator has a single input parameter: Type of calculation - type of spread calculation. It can take the following values: System spread - the spread value
FREE
Use Day Trading Tracker to keep a record of your earnings across accounts. This indicator will show a dashboard in the Meta Trader chart to show for the profit or loss money in your account. It’s easy to see just how much money you’re making matched betting with the Forex Trading Profit Tracker. Key features: Track your profit over time Check out your stats. Track expected profits against actual profits. Export account history to Excel. MT4 version: https://www.mql5.com/en/market/product/39113
FREE

Automatically protect you positions with Raba BreakEven and Trailing StopLoss EA. Functionalities: Automatic break even. Automatic trailing stoploss
I you have any doubt you can leave it in comments and I will anwer it asap. If you found this tool helpful for you, a comment and a good rating will be appreciated. Also any proposal will be taken into account for future versions.
FREE

Highly configurable Accumulation and Distribution (AD) indicator. Features: Highly customizable alert functions (at levels, crosses, direction changes via email, push, sound, popup) Multi timeframe ability Color customization (at levels, crosses, direction changes) Linear interpolation and histogram mode options Works on strategy tester in multi timeframe mode (at weekend without ticks also) Adjustable Levels Parameters:
Ad Timeframe: You can set the lower/higher timeframes for Ad. Ad Bar Shi
FREE
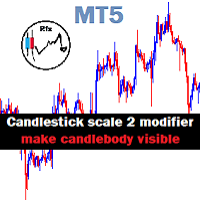
Chart Candlestick scale 2 zoom will visible instead of just a tiny unrecognized line make it look neat and tidy Instruction.
If you don't like the candles colors, you can do so by changing color. read below:
-Colors must be changed in the indicator setting.
-It won't change through the Chart properties to modify.
-After changing the color, save it as template so it wont change the colors to default value.
FREE

This indicator can be used to study the repeating daily volatility structure, and also find deviations from the historical means. Black line tells the average volatility of current hour from last 30 days. Blue bands tell the confidence interval (2 times standard deviation). Red line tells the current volatility, ATR.
Inputs: - days: the number of days where to calculate the average volatility - atrp: the ATR period used to measure volatility
FREE

To get access to MT4 version please click here . This is the exact conversion from TradingView: "Hammer & ShootingStar Candle Detector" by "MoriFX". This is a light-load processing and non-repaint indicator. All input options are available. Buffers are available for processing in EAs. You can message in private chat for further changes you need. Thanks.
FREE

The purpose of the remaining time indicator on the K-line is to assist traders in gaining a deeper understanding of market dynamics and making more precise trading decisions, particularly in the realm of forex and binary short-term trading. The significance of this indicator and its application to various trading strategies will be thoroughly examined below: Enhancement of Trading Timing Accuracy - Precision: By displaying the remaining time of the current K-line cycle, traders can achieve great
FREE

xCalper Economic Calendar brings economic calendar information to your Terminal chart and Experts from online sources. Just add it to your chart to see detailed news without losing attention or automate reading of calendar information to improve trading decisions.
Main Features Support data sources: Forex Factory. Filtering by day, impact or currency of news. Visual alert of upcoming news. Platform notification of upcoming news.
Parameters Filters Impact expected - Show/Hide by impact: Low,
FREE

If your strategy requires trading during a certain period of market activity - calm or turbulent, this indicator will help you find such periods of time within a week for each currency pair using statistics.
The principle of the indicator is quite simple.
The entire trading week, from Monday 00:00 to Friday 23:59, is divided into timeslots, the duration of which corresponds to the current timeframe.
For each timeslot, activity is calculated - the average value of the difference between the
FREE

Simple countdown indicator for the next candle. Only claim is to be light! The indicator inserts a text object to the right of the current price and calculates how much time is left for the new bar, showing this to the trader. Leave your comment if the indicator helped you in any way! If you have any suggestions, let me know to evaluate the improvements. Success and Good Trades!
FREE
White label available. contact us for more info. dushshantharajkumar@gmail.com Replica Local Trade copier by Chart Walker
Replica, a MetaTrader 5 (MT5) local trade copier, is a powerful tool designed to streamline and automate trading processes for users within the MT5 platform. This innovative software allows traders to replicate trades from one account (master) to another (slave) in real-time, enabling efficient and synchronized trading across multiple accounts. With its user-friendly int
FREE

Utility for show on charts the visual informations about:
- a vertical line at start of each bar of selected timeframe
- a vertical line at start of each day
- a vertical line at start of each week
- vertical lines at start / end of trading sessions selected
- bid / ask prices, spread, money value for each point (of 1 standard lot) and last tick time recived"
You can enable / disable each information and set the color for each line
FREE

This indicator shows both GMT time and your broker's time on the chart.
Simply attach the indicator to a chart, and you will see the GMT time and your broker's time displayed in the top left corner, as shown in the screenshot. By using this indicator, you can always stay informed about your broker's time, which is especially useful during daylight saving changes.
You won't have to worry about whether your broker follows the US or EU schedule, as the indicator automatically adjusts to reflect a
FREE

Consecutive candles can give us an indication as to the strength of a trend. With this indicator, you can set the number of consecutive bull or bear candles you wish to be present before achieving a valid signal of RSI crossing into overbought or oversold. With this information, you can better judge if a continuation or reversal situation is about to present. RSI has two settable levels
Interesting settings: Number of consecutive candles needed before a valid signal Overbought level of RSI Ove
FREE

The trade cost caused by spreads is an important indicator when formulating trade profit-loss ratios. Spread costs info is particularly important for short-term traders, especially scalping traders. This tool can output the spread cost of all Forex currencies (including XAU and XAG) in the platform in different account types (USD account, EUR account, etc.).
Calculation and code See articles: THE TRADE COST OF FOREX CURRENCY Part1 THE TRADE COST OF FOREX CURRENCY Part2 THE TRADE COST OF FOREX
FREE

마지막으로 인터페이스가 편리 해졌습니다. 지금 당신은 마우스로 표시 기간을 제어 할 수 있습니다. 버튼을 클릭하고 마우스 휠을 스크롤하여 참조 기간을 늘리거나 줄이십시오. 이 버튼은 편리한 장소에 배치 할 수 있으며 한 번의 클릭으로 고정 및 사용할 수 있습니다. 하나의 차트에 여러 지표를 설정하고 개별적으로 또는 한 번에 모두 관리 할 수 있습니다. 차트에 간단한 설치를 사용하면 각 표시기의 매개 변수 이름 바꾸기 또는 변경에 대해 걱정할 필요가 없으며 자동 알고리즘 자체가 필요한 개체의 이름을 바꾸고 생성 할뿐만 아니라 사용 후 삭제할 수 있습니다. 이 인터페이스는 가능한 한 편리하며 실제로 수동 개입이 필요하지 않습니다. 이 구성 요소는 종종 자신의 거래 전략에 참조 표시기를 사용하는 사람들을 위해 이상적입니다. 차트에 지속적으로 작업 할 수 있습니다! 테스터에서 작동하지 않습니다. 이 무료 제품에 대한 귀하의 의견을 남길 수있는 큰 요청. 설치 방법:
-차트에"버튼"을
FREE

Free version of https://www.mql5.com/en/market/product/44815 Simple indicator to calculate profit on fibonacci retracement levels with fixed lot size, or calculate lot size on fibonacci levels with fixed profit. Add to chart and move trend line to set the fibonacci retracement levels. Works similar as default fibonacci retracement line study in Metatrader. Inputs Fixed - select what value will be fix, lot or profit (available in full version, lot is set on free version) Fixed value - value tha
FREE

I always wondered if I can have multiple time frame Moving average on same chart , it is not possible , now with my Indicator is possible , As you know Moving average is lagging not leading indicator , but how can I predict future levels of it ?
I came with this idea , I hope you will like it , I made a Mirror of Moving average , the other side of specific time will be shown in the other side of the chart where the price didnt reach yet , that will help you to know the levels you can start sel
FREE
This is a simple indicator that shows the spread in points. It is useful for those like trade scalper, in addition to be customizable.
Functions:
Color - I don't need to explain :) Font type - I don't need to explain :) Font size - I don't need to explain :) First text - text in front of spread number Second text - aditional text after the spread number. Corner - specify the corner where the spread will be written. Horizontal distance - horizontal distance from the edge. Vertical distance -
FREE
This EA has no stop loss. All risks are at your discretion.
This is Free EA, It can make you profitable if you use it carefully. Please don't ask for the MQ5 file, I'm using it to develop other robots.
Gegenpressing MT5 EA is a fully automatic Expert Advisor for Scalping Trading on XAUUSD timeframe M1 but also in others. The basic strategy starts with Market order in Trend Following, so this EA Follow the Trend . M1 Trend…. very very fast.
If you like this EA and want to hel
FREE

Spread Indicator MT5 - NS Finanças. (http://www.nsfinancas.com.br) Auxiliary tool to give Spread visibility to all types of currency pairs and timeframes. The labels are well positioned in the upper right corner of the chart so as not to disturb the visualization during the trade, however it is also possible to drag the indicator to the best place on your screen. In addition to the current spread, this indicator also monitors the minimum, maximum and average spread of the selected currency pair
FREE

An EA to export trading history for FXer - Journaling and Analytics. Register Create an API token Put EA on any chart (any TF is fine) Fill in the API token Follow analytics for better trading !!! Currently in beta-testing !!! At FXer, our mission is clear: to empower traders like you with the tools needed to excel in the ever-changing world of trading. We are committed to providing top-tier, data-driven market analysis and trading intelligence, ensuring you can make well-informed decisions, man
FREE

The Indicator indicator draws 2 clouds based on Keltner indicator values. The upper cloud is formed by the upper lines values and the lower cloud by the lowers lines values. The indicator allows to change the Keltner parameters and the clouds colors the period of the base line and the deviations of each Keltner instance. The indicator holds 5 buffer index as follow: [0] - Outer values of the upper cloud [1] - Inner values of the upper cloud [2] - Base/Center line values [3] - Inner values of
FREE

This is the MT5 version. Get Q-Math MT4 here
Check it out and if you like it just enjoy it. Try various values to find the setting that best suits your trading. Upward signal if the indicator is colored lawn green and bearish signal if the indicator is gray. You can use the line itself to trailing stop when you open orders. This is just a tool. A complement. It is not a strategy. Combine it with your own analysis Just download it and try it, it's free.
FREE
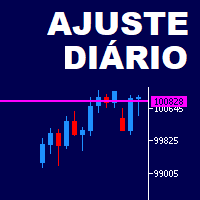
This is a tool in script type. It shows in chart the actual and/or past day ajust price in a horizontal line. The symbol name and it expiration must be set up according to the actual parameters. The lines appearance are fully customizable. You need to authorize the B3 url on MT5 configurations: www2.bmf.com.br. You need this to the tool can work. This is a tool for brazilian B3 market only!
FREE
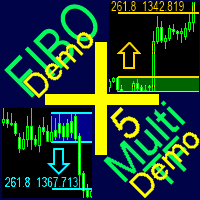
A ready-made multitimeframe trading system based on automatic plotting and tracking of Fibonacci levels for buying and selling any symbol. Demo version - calculation of the last 390 bars is not performed.
Advantages Determines the trend direction based on a complex of 14 indicators ( Cx ), extremums of ZigZag ( Z ), RSI ( R ), Impulse ( I ) Displaying the values of 14 indicators comprising the trend direction ( Cx ) Plotting horizontal levels, support and resistance lines, channels View the pl
FREE

Moving Average ******************* Moving Average для платформы секундных графиков Micro . ********************* Секундный график на порядок увеличит точность ваших входов и выходов. Секундный период , в привычном формате, позволит увидеть то, что ранее было скрыто. Бесплатные индикаторы, дополнят визуальную картину, что, в совокупности выведет вашу торговлю на новый уровень. Идеально подходит как скальперам, так и трейдерам торгующим внутри дня. Индикатор Moving Average для платформы Micr
FREE

The custom Bollinger Bands Height indicator measures and displays the current state of the Bollinger Bands indicator, showing whether the bands are widening (moving away from each other) or narrowing (starting to converge). Contraction, indicated by the narrowing of the bands, suggests that the current market movement is losing momentum and hints at the potential start of a new strong movement. This can be a signal to look for an opportune moment to enter a position, as a sharp price change ma
FREE
MetaTrader 마켓 - 거래자를 위한 로봇 및 기술 지표는 거래 터미널에서 바로 사용할 수 있습니다.
The MQL5.community 결제 시스템은 MQL5.com 사이트의 모든 등록된 사용자가 MetaTrader 서비스에서 트랜잭션을 수행할 수 있습니다. 여러분께서는 WebMoney, 페이팔, 또는 은행 카드를 통해 자금을 예치하거나 인출하실 수 있습니다.
트레이딩 기회를 놓치고 있어요:
- 무료 트레이딩 앱
- 복사용 8,000 이상의 시그널
- 금융 시장 개척을 위한 경제 뉴스
등록
로그인
계정이 없으시면, 가입하십시오
MQL5.com 웹사이트에 로그인을 하기 위해 쿠키를 허용하십시오.
브라우저에서 필요한 설정을 활성화하시지 않으면, 로그인할 수 없습니다.