MetaTrader 5용 무료 Expert Advisor 및 지표 - 24

시장 팔레트는 관성 및 가격 변동의 가속을 기반으로 거래 결정을 필터링하기위한 강력한 도구입니다.
_________________________________
지시자 신호를 이용하는 방법:
표시기는 세 가지 색상의 히스토그램 신호를 생성합니다. 표준 색 구성표에서 파란색 열이 나타날 때 긴 포지션 만 유지하고 빨간색 열이 나타날 때 짧은 포지션 만 유지하고 회색 열이 나타날 때 거래 행동을 삼가하는 것이 좋습니다. 더 높은 열의 모양은 가격 움직임의 임계점의 형성을 의미합니다-열의 색상을 변경할 확률이 높습니다.
_________________________________
표시기 매개 변수는 히스토그램 표시 스타일을 변경하는 것이 좋습니다. 계산에 사용되는 매개 변수를 변경하는 것은 제공되지 않습니다-이 내 제품의 철학 때문이다:안정성과 객관성.
_________________________________
귀하의 질문 및 제안을 환영하며 비공개 메시지로 보
FREE

"Five Minute Drive" indicator that is designed to be used in the 5 minute timeframe only. One of its most important advantages is that it shows the general trend in the upper time frames when looking at the 5-minute timeframe. Therefore, when opening positions in the 5 minute timeframe, when it is in line with the trends in the upper timeframes, you are less likely to be upside down. If you can interpret the curvilinear and linear lines drawn by this indicator on the graphic screen with your geo
FREE

The indicator of trend (flat) with a price channel.
Trading Buy - the price have crossed the central line upwards (the candlestick has closed above the line) and the channel is oriented horizontally (yellow line) or directed upwards(green line). Move to breakeven when reaching the opposite border of the channel. Close positions when conditions for selling are formed. Sell - the price have crossed the central line downwards (the candlestick has closed below the line) and the channel is oriented
FREE

FRB Sell Agression - Indicator shows the Sell Agression Balance of the TIMEFRAMES chosen by the user through a histogram in a new window. - This indicator can only be used if the broker provides data on Volumes. Forex market brokers do not report this data. - B3 (Bovespa - Brazil) informs the data and with that it is possible to use it in Brazilian brokerages.
Settings Color - Define the color that will be shown in the histogram. Use Historical Data - Defines whether the indicator will calc
FREE

Property of Vertical Capital Edition: Gugol_Quants About USA INDEXES QUANT_INDICATOR: This is a indicator created by math modulation to be used as a trading tool, which was developed in MQL. (MT5) This indicator is for use only with US500(S&P500), NAS100(Nasdaq Composite) and US30(Dow Jones). Signals are activated on "Open" Candle. It’s based on Intraday/Swing Trades whose main timeframe is H1, H2, H3 and H4. However you can use it with other assets by testing with the appropriate settings. *
FREE

Alert System You use function keys to create horizontal lines for alerts. 1. Allow set horizontal line properties (line color, line style, line width, ...) for alerts. 2. Allow add text to horizotanl line. You can hide or show text when you need. You can change text and its price, but time of text will be set in input named "text_time" (0 is current time, you should test this input with -1, -2, -3 or lower). 3. It has 2 types of alert: above and bellow. You can set key to create them. If price i
FREE

Axilgo Pip Piper CoPilot Elevate your trading game with the Axilgo Pip Piper CoPilot, the first in our revolutionary Pip Piper Series. This all-inclusive toolset is meticulously crafted for serious traders, focusing on key areas such as Risk Management, Trade Management, Prop Firm Rule Compliance, and Advanced Account Management . With CoPilot, you’re not just investing in a tool—you’re gaining a strategic partner in the intricate world of trading. Important Notice: To ensure you receive the fu
FREE

Main: Not martingale, not a grid; Working on all symbols;
Signals: There is a good rational algorithm. Work of two indicators: Stochastic and OsMA (you can set a separate Timeframe for each indicator)
Stop Loss/Take Profit: There is a good money management system (there are several type for trailing stop loss); There is virtual levels of Stop Loss / Take Profit; There is smart lot (percent by risk) or fix lot
Important: EA can work on closed candles, and on current candles; Quickly o
FREE

This indicator is based on the Heiken Ashi indicator. It helps the user identifying whether to buy or sell. It comes with an alert that will sound whenever a new signal appears. It also features an email facility. Your email address and SMTP Server settings should be specified in the settings window of the "Mailbox" tab in your MetaTrader 5. Blue arrow up = Buy. Red arrow down = Sell. Line = Trailing Stop. You can use one of my Trailing Stop products that automatically move the Stop Loss and inc
FREE

Bill's Williams Awesome Oscillator signal from his book "Trading chaos 2nd edition" on bars. Normally this signal is being used for 2nd entry after 1st entry by Divergent bar ----------------------------------------------------------------------------------------------------------- Please make shure that you understand Bill's Williams system before trade with real money using this indicator. Ideal entry setup is: 1) Divergence with zero line AO crossing 2) Divergent bar on top of the final 5th
FREE

Have you ever wondered which currency is the strongest at any particular time? Or which currency pair is trending the most. Well, the currency strength meter helps with just that. It compares USD , EUR , AUD , CHF , GBP , CAD and NZD depending on the timeline you have chosen in settings, and ranks them on the number of pips each has moved compared to the rest. N/B: All currency charts of the above pairs must have loaded. You can do this by highlighting all major and minor currencies in
FREE

Transform your financial chart analysis with our innovative Candle Coloring Indicator. This powerful tool allows you to instantly visualize market trends based on closing prices relative to a customized average. Customized Coloring: Choose colors that best suit your analysis style. Highlight candles above the average in a vibrant color of your choice and candles below the average in another distinctive color. Adjustable Average: Tailor the indicator to your trading strategies by setting the aver
FREE

Indicator of Stowell's Three-Bar Net Line. In this indicator, the number of bars used for determining the lines can be defined in the settings. With the default settings, the indicator draws arrows in the areas of the line breakout. The lines are not displayed on the chart by default. but can be enabled.
Parameters Alerts - enable alerts when arrows appear. Arrows appear on a forming bar and can disappear during bar formation. Therefore, it is recommended to wait for the bar with the arrow to
FREE

This spread indicator displays the actual spread of each candle. It highlights the maximum spread and the minimum spread of the chosen symbol. This indicator is very helpful to see in real time the spread evolution helping to avoid taking a trade when the spread is too high.
Inputs:
Print value in Points: if true displays the spread as a whole number
D isplay minimum and maximum spread of the past N days: select the number of days to consider the maximum and minimum spread
Automatically
FREE
MT5用 サブウィンドウにスプレッドとBUY SWAP(BS)とSELL SWAP(SS)を表示するインジケーターです。
表示の文字フォントの大きさと色の設定、スプレッドの表示をPIPS表示もしくはPOINTS表示切替が可能ですので、チャートの色設定などに合わせて、お好みでご利用いただけます。 サブウィンドウの表示サイズに合わせて、その中央に表示するようになっています。
(ご協力お願いします!) こちらは無料でご利用いただけます。どうぞご自由にご利用ください。 もしよければ MS High Low indicator も紹介していますので、どうぞご参照の上、DEMO版のダウンロードをお試しください!
Happy Trading :)
FREE
Please, if you like this AE, I would appreciate it if you could rate it with 5 stars ️ ️ ️ ️ ️ THANK YOU!!
Expert Advisor based on the signal generated by two MACDs (Moving Average Convergence Divergence), which can trade on different time frames (M1, M5, M15, H1, H4, etc.) The Expert has the following variables: >>>>>>>>>>>>>>>>>>> Magic number Slippage >>>>>>>>>>>>>>>>>>> Stop Loss (pips) Take Profit (pips) Trailing Stop (pips) Trailing Step (pips) Money management: Lot o
FREE

The key to success is always good optimisation.
The system has a number of variables and in this case its simplicity is the key to its success. The system looks for the different "Gaps" as market entry failures and then debugs them through a stochastic analysis, i.e. the analysis of two moving averages to see if the price is overvalued or undervalued, and once this is done, the expert advisor will decide whether to perform an action or refrain from performing it. It is a very simple but power
FREE

Black Friday PROMO launch My portfolio . I am giving this expert advisor for FREE.
The Expert Advisor has been developed by AI for Nikkei and M15 timeframe. There is no need to set up parameters, all settings are already optimized and fine-tuned. Recommended broker RoboForex because of EET timezone.
My recommendation is to have a look also at the rest of my products in the portfolio, as they work very well together in combination. Check other portfolio screenshots.
Dax Ai , Daw Ai , Niki A
FREE
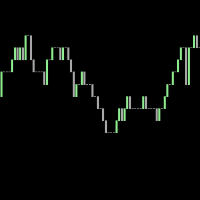
This is a tick indicator which compares the current bid price with the previous bid directly before it, and draws candles based on a comparison of the current ticks. It does not use historical ticks. Everything happens in real time, data moves from right to left, and the newest data arrives at the right. A trend line can be added which points in the direction of the price shifts.
FREE
Abacus Scalper demo Works on demo account only Uses advanced standard deviation filteralgorithm to determine trade positions.
INPUT SETTINGS LotSize: Default is minimum trade volume. StopLoss: Specified in pips. Default is 100pips. TakeProfit: Specified in pips. Default is 200pips. Note: 1 pips = 10 pip points on greater than 0.000001 tick size.
Good account management. Minimum capital is 500. Recommended minimum capital is 1500
FREE

The Netsrac Correlation Trade Indicator (NCTI) was created to trade correlations between different assets. NCTI offers five different strategies to do this. Five different correlation trading strategies with two or three assets Fast access your assets with one click via asset buttons Your profit/loss at a glance Configurable alerts via screen or mobile You can use the indicator with every timeframe. Higher timeframes give fewer but better signals. If you have some questions or suggestions - plea
FREE
Protect My Trades is an EA (expert advisor bot) that automatically put stop loss and take profit on market trades and pending orders. You can specify if want it to do this only on actual symbol trades or in all others. Its configuration is very simple. Functions: Take profit: distance to TP (0 = disabled, no TP will be created).
Stop loss: distance to SL (0 = disabled, no SL will be created).
Price type: price type in pips or pipets/points (pips is common in Forex).
Actual symbol only: manage
FREE

BinaWin NoTouch is an indicator that sends an alert signal when the trade is in the right position to wait for the breakdown of a side market.
It is specially designed to trade under the “No Touch” strategy of the Binary.Com platform with synthetic indexes N.10, N.25, N.50, N.75 and N.100
Similarly, trading can be done with the conventional CALL and PUT strategy of any Binary Options platform.
Requirements to use the indicator:
1. Have an account at Binary.Com
2. Configure the Binary.
FREE

Fundamentação teórica Rate of Change - taxa de mudança (ROC) O ROC é um oscilador que flutua acima e abaixo de uma linha de zero, medindo a variação percentual de preços ao longo de determinado período. O ROC de 20 períodos mede a variação percentual de preços ao longo de 20 períodos, quanto maior a diferença entre o preço atual e o de 20 períodos atrás, maior o valor do ROC. Quando o indicador está acima de zero, a variação percentual é positiva indicando tendência bullish, se o indicador está
FREE

About the Bollinger Bands
The Bollinger Bands indicator was invented by John Bollinger in the 1980s. The Bollinger Bands consist of a Moving Average, an Upper and a Lower Band and is included in Metatrader 5. The default settings are 20 for the period and 2 for the deviation. EasyBot Bollinger Bands is an expert advisor developed with the idea to be useful for traders who love to trade using the popular indicator Bollinger Bands. EasyBot Bollinger Bands has very simple trading logic. When the
FREE

SYMPHONY 8a is an advanced speculation system developed by 8aSistemas that uses intelligent input/output and management algorithms with sophisticated filtering methods.
There is nothing special here, no Holy Grail testing, just a strict rules-based trading approach, which allows you to maximize returns while keeping risks under control.
RECOMMENDED Currency Pairs: EURCAD
IT CAN DEVELOP IN ANY CURRENCY PAIR AS LONG AS IT IS OPTIMIZED IN EACH PAIR.
SYMPHONY OPERATES WHEN THE MARKET IS
FREE

Developed by Charles Le Beau and featured in Alexander Elder's books, the Chandelier Exit sets a trailing stop-loss based on the Average True Range (ATR). The indicator is designed to keep traders in a trend and prevent an early exit as long as the trend extends. Typically, the Chandelier Exit will be above prices during a downtrend and below prices during an uptrend.
Calculation
The original Chandelier Exit formula consists of three parts: a period high or period low, the Average True
FREE

OrderCalc opens a window in the chart with the data of your orders:
Position size, stop loss, take profit, profit/loss
Only the positions for this symbol are displayed. If several positions exist, these are totalled and displayed in the last line. If you work with pyramids, you can see at a glance how big the total profit or loss is.
M can be used to display information about the symbol: Margin, spread, minimum order size, increment etc. R opens the risk calculator. A click in the chart c
FREE

Double Correlation indicator (free) plots two windowed correlations in a separate window. the size of window is taken as input before the two symbols to correlate to. Two symbols are taken as an input parameters as well as period length. and the two correlations are computed with the currently shown symbol ex: input GBPJPY and AUDNZD. current symbol EURUSD then the following will be computed corr(EURUSD,GBPJPY) and corr(EURUSD,AUDNZD) The indicator can be useful to run a multi-symbol pair trad
FREE
SmartSetup Bot Is an advanced trading tool that combines the flexibility of manual configurations with the power of semi-automated features. It automatically generates graphical objects, displaying critical zones such as support and resistance levels, stop loss and take profit areas, and other essential indicators. SmartSetup Bot provides clear and precise visualization of your trading parameters, facilitating informed decision-making. This bot is designed for traders who value manual control bu
FREE

This Expert advisor Trades Trending conditions, best use on EURUSD 1hr chart Strategy uses Bollinger band , Rsi and a momentum indicator to identify the best trading conditions
Includes news filter and account protection settings , also entry protection for high spread . Optimized code for quicker optimization in mt5
Download demo and test out Bollinger Band Lion .
FREE

We have all seen a currency pair enter the overbought or oversold territory and stay there for long periods of time. What this indicator does is gives you the emphasis. So if you are looking for reversals then you may want to take notice when oversold territory is entered into with a bullish engulfing candle or if the trend is your thing then check for bearish engulfing candles while entering oversold. This indicator will show a downward arrow when it detects a bearish engulfing candle while cro
FREE

A "simple design" trading panel, which is characterized by small byte size, low CPU usage, simple steps, and quick operation, 1 to 2 clicks to complete a functional operation,
saving time and increasing efficiency . The panel is easy to use, and it is not complicated to set parameters, which is in line with traders' habits. At the same time, its compact-
design, clear at a glance, and comprehensive functions are a powerful tool for manual trading! Key features of the panel: Click "Bid/Ask
FREE

Convenient tool for measuring the number of points between the prices directly on the chart. Displays in the measurement between points in percentage, points (financial) and time (bars ). Compatible with all graphical timeframes. When fixed on the chart is displayed in all timeframes. Press Ctrl, click the first point, move the mouse and will now display the measurement. Click again and fix. Very fast tool that does not occupy much space. Input Parameters Line Color Line Style Text Color Text Si
FREE

An indicator for visualizing time ranges of key trading sessions: Asian, European, and American. The indicator features functionality for setting the start and end times of each trading session, as well as an adjustable timezone of the trading server. The main advantages of the indicator include the ability to operate with minimal CPU load and memory usage. Moreover, it offers the option to specify the number of displayed historical days, providing the user with flexible market dynamics analysis
FREE

The " Pure View " indicator is designed to quickly display and hide indicators on the chart. Description
1. Currently Pure View works with Stochastic, MACD, RSI indicators 2. Displaying and hiding indicators occurs using hot keys 3. The key combination Shift + C will display or hide the "Stochastic" indicator on the chart 4. The key combination Shift + V will display or hide the "RSI" indicator on the chart 5. The key combination Shift + B will display or hide the "MACD" indicator on the chart
FREE

Overview Custom Logic for Trading MT5 Mini is the free version that designed to execute trades based on custom indicator signals, with robust position management features with break-even settings. This script allows traders to implement their strategies with high precision and flexibility, enhancing their trading efficiency and profitability. Input Parameters Indicator Settings indicator_name : Name of the custom indicator to be used for generating signals. buy_signal : Signal value indicating a
FREE

US 30 BOT This is a simple quantitative model that trades US30 Index from NASDAQ top 30 American stocks It uses volatility contraction and expansion as a basic theory. Place it on US30 chart ,any timeframe. Hedging accounts are advised. NB: Standard accounts are preferred and well regulated brokers eg ICMarkets are advised to avoid unnecessary losses eg slippage ones, commissions and large spreads. Minimum account balance ADVISED : USD 100 set activate to true in inputs section NB: These
FREE

This indicator sums up the difference between the sells aggression and the buys aggression that occurred in each Candle, graphically plotting the waves of accumulation of the aggression volumes. Through these waves an exponential average is calculated that indicates the direction of the business flow.
Note: This indicator DOES NOT WORK for Brokers and/or Markets WITHOUT the type of aggression (BUY or SELL). Be sure to try our Professional version with configurable features and alerts: Agr
FREE

Trend Market Catcher MT5 is a powerful tool developed to assist traders in identifying and capturing profitable market movements. This expert advisor leverages advanced algorithms and sophisticated indicators to analyze price patterns, detect trends, and generate precise trading signals. With Trend Market Catcher, you can say goodbye to guesswork and emotional decision-making. It employs a systematic approach, meticulously scanning the market to identify favorable trading opportunities. By focus
FREE

This indicator is based on the Moving Average indicator. It helps the user identifying whether to buy or sell. It comes with an alert that will sound whenever a new signal appears. It also features an email facility. Your email address and SMTP Server settings should be specified in the settings window of the "Mailbox" tab in your MetaTrader 5. Blue arrow up = Buy. Red arrow down = Sell. Line = Trailing Stop. You can use one of my Trailing Stop products that automatically move the Stop Loss and
FREE
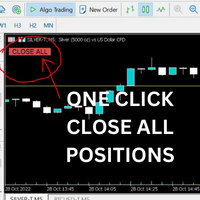
Just Attach to the Chart to be able to Click Button to Close all Open Positions in your Trading Account. Change Horizontal And Vertical Pixel based positioning for Button placement on chart. Appreciate your feedback and reviews. Note: All open positions on your trading account will be closed when button pressed.
If you need help with any simple utility happy to help.
FREE

정확한 거래 분석을 손끝에서: 차세대 거래 분석 소프트웨어 시중에 나와 있는 일반적인 거래 분석 소프트웨어는 종종 시간별 또는 주별 손익 비율 통계만 제공하여 더 정확한 거래 분석의 필요성을 충족하지 못합니다. 그러나 실제 거래 시장에서는 매일마다 고유한 상황이 발생합니다. 월요일은 조용하고, 수요일은 3배의 오버나이트 금리로 활발하며, 금요일은 주요 데이터 발표로 인해 매우 활발합니다. 분명히 매일 통계 분석을 수행하는 것은 과학적이지 않으며, 주 단위로 분석하는 것이 더 합리적입니다. 그러나 주간 차트는 각 날의 통계적 조건만을 보여주고 시간별 변화를 포착할 수 없습니다. 또한 특정 상품은 롱 포지션과 숏 포지션 간에 상당한 차이를 보이며, 이는 현재 거래 분석 소프트웨어에는 없는 별도의 분석이 필요합니다.
시간 단위가 너무 거친 것 외에도 기존 거래 분석 소프트웨어는 전략 필터링 측면에서도 부족합니다. 한 상품에 여러 전략이 동시에 실행될 수 있기 때문에 상품 이름만으로
FREE
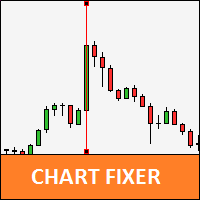
Utility that allows you to set a specific date on the chart. You set a reference point through a vertical line and it is done! When changing timeframes, the reference point is always positioned at the center of the chart. That way you can analyze a specific date at different timeframes easily, without losing the reference point or scrolling the chart to it.
This is a product developed by Renato Fiche Junior and available to all MetaTrader 5 users!
Partners: "Águia Traders" team ( Eagle Trad
FREE

RSI Currencies is an indicator that is based on the RSI concept but with a totally different approach. It calculates its values calculating all RSI values of all pairs related to the same currency and making an average between them: the goal is to obtain a more solid and trustable information about what each currency are doing lowering the impact of market noise and extreme euphory on a particular pair to analyze the whole basket. It works on 28 forex majors and minor pairs related to these curr
FREE

The Volume Weighted ATR indicator is a helpful tool for measuring market activity. It is based on the idea of the Volume-Weighted ATR. Combining these two elements helps identify potential turning points or breakout opportunities. The indicator for the classification of the activity of the market uses the moving average and its multiples. Accordingly, where the VWATR bar is located (relative to the moving average), it is labelled as ultra-low, low, average, high, very high or ultra high. The Vo
FREE

Индикатор для синхронизации и позиционировании графиков на одном и более терминалах одновременно. Выполняет ряд часто необходимых при анализе графиков функций: 1. Синхронизация графиков локально - в пределах одного терминала при прокрутке, изменении масштаба, переключении периодов графиков, все графики делают это одновременно. 2. Синхронизация графиков глобально - тоже самое, но на двух и более терминалах, как МТ5, так и МТ4. 3. Позиционирование графика на заданном месте при переключении периодо
FREE

The TradeQL Indicator is a customizable tool that highlights specific trading patterns on candlestick charts. Users can define patterns through TradeQL queries, which the indicator then applies to the chart, visually representing matches and captured groups. Ideal for identifying complex trade setups in real-time.
TradeQL queries are specified using the TradeQL Language. See https://github.com/abdielou/tradeql for more details. This language is expressed as a regular expression. The language a
FREE

Média Móvel que possui todos tipos de Cálculo comum: Simples Exponencial Suavizada Ponderada Conta com suporte para aplicação sob outros indicadores!
Seu principal diferencial é o esquema de cores em GRADIENTE que, de acordo com a mudança no ângulo da média, altera suas cores conforme demonstrado nas imagens abaixo. Com isso, espera-se que o usuário tenha uma percepção mais suavizada das pequenas alterações.
Bons trades!!
FREE

InsideBarStop Indicator for MT5
This indicator can be used to show and evaluate the trailing stop algorithm "Trailing Stop with Inside Bars" that was proposed by the famous German trader and author Michael Voigt ("Das grosse Buch der Markttechnik") to capture robust gains when trading strong price moves. The trailing stop price is shown as a red line. You can start the trailing stop anywhere on your chart (bars or candles) by setting the "initialBarDateTime" input parameter to the open time of
FREE

Что такое RSI? Индикатор RSI (Relative Strength Index, индекс относительной силы) — это индикатор, который измеряет соотношение восходящих и нисходящих движений. Расчет ведётся таким образом, что индекс выражается в диапазоне от 0 до 100. Как понять RSI?
Если значение RSI находится равно 70 и больше, считается, что инструмент находится в состоянии перекупленности (ситуация, когда цены выросли выше, нежели того ожидал рынок). Значение RSI на уровне 30 и ниже считается сигналом о том, что инст
FREE

(암호화폐 차트)
Binance Future의 모든 기호를 사용자 지정 기호에 저장합니다.
Binance Future의 기호에 "F" 접두사를 추가합니다.
Binance Future의 기호를 따를 수 있는 인프라를 만듭니다.
도구 메뉴 >> 옵션 >> Expert Advisors에서 WebRequest를 허용하고 URL을 추가해야 합니다. https://fapi.binance.com
스크립트를 두 번 클릭하기만 하면 됩니다.
몇 초 만에 전체 목록을 볼 수 있습니다.
링크에서 제품을 참조하십시오 https://www.mql5.com/en/market/product/68694 설치 및 추가 지원을 위해 주저하지 말고 저희에게 연락하십시오. 설치 및 추가 지원을 위해 주저하지 말고 저희에게 연락하십시오.
FREE

Basing Candles indicator is an automatic indicator that detects and marks basing candles on the chart. A basing candle is a candle with body length less than 50% of its high-low range. A basing candle or basing candlestick is a trading indicator whose body length is less than half of its range between the highs and lows. That's less than 50% of its range.
The indicator highlights the basing candles using custom candles directly in the main chart of the platform. The percentage criterion can be
FREE

The currency strength momentum has a lot of similarities with currency strength meter presented in the previous page, but the difference are much more pronounced. You can try putting both in the same chart and see the difference in results. Currency strength momentum measures strength of a currency based on (you guess it) it's momentum relative to other currencies, while currency strength meter measures the strength of a currency based on pips it has moved in a certain direction.
FREE
A new type of indicator for Professional and Experienced Traders. Specifically designed for trend identification. A great tool for investors to invest at the right and suitable time for decent trading. You can present it to your potential clients and customers for their satisfaction.
A very handy and trendy tool. Easy to read , comprehend and user friendly. By this tool you can easily identify the potential to enter in trading and low potential to exit. Best of Luck!
FREE

Vegas Tunnel, with up to 20 levels, allowing you to plot or not each level with color change, line thickness and ON/OFF visualization for easy use 100% free and lifetime Recommended use for time frames: Original --> H1 Fractals --> M15, M30, H4, D1 and W1 When the black dots are above the tunnel, start short positions. When the black dots are below the tunnel, start long positions. It's important to remember that just because the market breaks the line of lying doesn't mean it's time to enter a
FREE

QuantumAlert RSI Navigator is a free indicator available for MT4/MT5 platforms, its work is to provide "alerts" when the market is inside "overbought and oversold" regions in the form of "buy or sell" signals. This indicator comes with many customization options mentioned in the parameter section below, user can customise these parameters as needful. Join our MQL5 group , where we share important news and updates. You are also welcome to join our private channel as well, contact me for the priva
FREE

Эксперт торгует по сигналам индикатора SystZ Trend Lines . Входные параметры: Take in atr, 0 - do not use a take profit - размер тейк профита по ATR (50) , рассчитанному на текущем таймфрейме. Если значение параметра равно 0, то не используется; Stop in atr, 0 - do not use a stop - размер стоп лосса. Если значение равно 0, то не используется; Risk factor, volume eq Equty*Risk factor/1000 - используется для расчета размера рабочего лота, который вычисляется как Эквити*Risk factor/1000. Нап
FREE

계정의 레버리지와 심볼의 확산을 실시간으로 모니터링할 수 있는 훌륭한 유틸리티 도구 이것은 데이터를 정확하게 식별하는 방법을 알 수 있습니다.
레버리지와 스프레드 지표의 조합. 거래 계좌의 레버리지 및 스프레드를 자동으로 확인하는 도구입니다. 모든 브로커 외환 주식에서 일합니다. 브로커가 레버리지를 변경하고 경제 뉴스 발표 중에 퍼지는 경우 모니터링하는 데 유용합니다. 현재 심볼의 실시간 스프레드 확인. 거래 계좌의 실시간 레버리지 확인. 빠른 새로고침으로 이해하기 쉬운 디자인 등 레버리지는 비교적 적은 투자로 많은 돈을 벌 수 있는 Forex 시장의 특수성입니다. "레버리지"라는 용어는 일반적으로 레버리지 또는 평준화로 번역됩니다. 많은 Forex 보커는 매우 흥미로운 레버리지를 가질 가능성을 제공합니다. 예를 들어 1:100의 레버리지란 투자금액의 100배 이상의 금액으로 운용하여 Forex거래가 가능하다는 것을 말합니다. 이것은 외환 시장에서 실제 투자로 얻을 수 있는 것
FREE

Product Description: Adaptive Y-Axis Scaling is a powerful MT5 indicator designed to enhance your trading experience by providing precise control over the Y-axis (price) scaling of your charts. This innovative tool allows you to customize the price scaling by specifying the number of pips from the visible chart's highs and lows. The calculated price range from this input is then used to set the maximum and minimum prices for the open chart, ensuring an optimized and comprehensive view of market
FREE

Highly configurable Momentum indicator.
Features: Highly customizable alert functions (at levels, crosses, direction changes via email, push, sound, popup) Multi timeframe ability Color customization (at levels, crosses, direction changes) Linear interpolation and histogram mode options Works on strategy tester in multi timeframe mode (at weekend without ticks also) Adjustable Levels Parameters:
Momentum Timeframe: You can set the lower/higher timeframes for Momentum. Momentum Bar Shift:
FREE

Fair Value Gap Supreme Court EA uses a special calculation formula between price differences and thus determines whether the parity is above or below the required price. It does not use the MA and RSI system, instead it detects sudden fomo SELLs and BUYs in prices. In this way, it enters trade only when there are HIGH opportunities.
This EA is still in BETA. For this reason, do not buy yet. You can test it. If you find a good setting and symbol, I will give you the EA for FREE.
FREE
Description This is a utility tool for MT5 reminding traders of all the entry points by highlighting trading history. For those who just started to learn trading, one of the most efficient tips to improve their trading skill is to look back their own trading history. However, trade history arrow shown on MT5 chart is simply too small to find out, which will keep traders away from reviewing their trade, especially stupid mistakes like overtrading. By clearly showing their trade history and face i
FREE
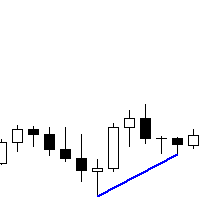
You can run this Tool in the Visual Strategy Tester. Indicator version coming soon. If you want this built into a Custom EA for you, send me a message. The Metatrader 5 RSI regular and hidden divergence scanner is a powerful tool designed to identify potential trading opportunities based on divergences between the RSI indicator and price action. With its intuitive interface and advanced scanning capabilities, this scanner helps traders pinpoint instances where price movements may be diverging f
FREE

Kindly rate and comment about the product for upgradation & Support
The 5 EMA is plotted in green color ( Lime ). The 14 EMA is plotted in red color ( Red ). The 20 EMA is plotted in blue color ( Blue ). The 200 EMA is plotted in black color ( Black ). The 200 EMA is plotted in yellow color ( Yellow ).
The Quarter EMA that provided calculates and plots four Exponential Moving Averages (EMAs) on the chart using different periods: 5, 14, 20, and 200. Each EMA
FREE

。。。。。。。。。。。。。。。。。。。。。。。。。。。。。。。。。。。。。。。。。。。 This indicator is based on Bollinger Bands indicator. It helps user clearly know the Band is expand or contract.
The method of use is the same as the traditional Brin channel index. Users can use different color areas to distribute forest channel indicators in expansion or contraction stage. -------------------------------------------------------------------------------------------
FREE

An indicator for analyzing different currency pairs simultaneously Forex is a complex market that requires several currency pairs to be analyzed simultaneously Determine the number of currency pairs yourself Determine the currency pair you want to analyze to analyze 4 of the most important and similar currency pairs at the same time. For direct and simple analysis, some currency pairs have changed (EURUSD>>>USDEUR) Do not doubt that to succeed in this market, you must analyze several currency pa
FREE

Multset This is inte_plays indicator, which helps the trader to enter the trades appropriately it plots an arrow when there is appropriate environment which permits trading
Features 1. Sends push notification on mobile devices 2. Plots arrow on chart when the setting is found
TimeFrame Is suggested to be used on higher time frames only, especially starting 15min and above for proper moves
For more informations please Visit: https://t.me/Tz_Fx_Lab Subscribe to our Youtube channel: htt
FREE

Sentiment Liner This is a steroidised Daily-Weakly-Monthly high-low and open, must have indicator. With this stuff user can determine the average of (daily-weakly-montly) open levels. 4 example: if you in day mode switch the average to 5, you get the 5 day sentiment. In weakly mode turn the average to 4, than you get the 4 weak sentiment,...so on. Naturally one can us as a simple day-week-month high and low indikator. S1: high S2: low Pivot: open, Average: averager
FREE

This is a customizable three moving averages indicator useful in crossover trading technique. Yo can set various parameters such as calculation methods (exponential, simple, etc.), period and price type for each MA separately from one input dialog.
Parameters: Period <1,2,3> - Period of a moving average Shift <1,2,3> - Shift of a moving average Method <1,2,3> - Method of calculation for each moving average set separately Applied Price <1,2,3> - Set price type for calculations for each movi
FREE
MetaTrader 마켓은 MetaTrader 플랫폼용 애플리케이션을 구입할 수 있는 편리하고 안전한 환경을 제공합니다. Strategy Tester의 테스트를 위해 터미널에서 Expert Advisor 및 인디케이터의 무료 데모 버전을 다운로드하십시오.
MQL5.community 결제 시스템을 이용해 성능을 모니터링하고 원하는 제품에 대해 결제할 수 있도록 다양한 모드로 애플리케이션을 테스트할 수 있습니다.
트레이딩 기회를 놓치고 있어요:
- 무료 트레이딩 앱
- 복사용 8,000 이상의 시그널
- 금융 시장 개척을 위한 경제 뉴스
등록
로그인
계정이 없으시면, 가입하십시오
MQL5.com 웹사이트에 로그인을 하기 위해 쿠키를 허용하십시오.
브라우저에서 필요한 설정을 활성화하시지 않으면, 로그인할 수 없습니다.