MetaTrader 5용 무료 Expert Advisor 및 지표 - 16

The key to success is always good optimisation.
The system has a number of variables and in this case its simplicity is the key to its success. The system looks for the different "Gaps" as market entry failures and then debugs them through a stochastic analysis, i.e. the analysis of two moving averages to see if the price is overvalued or undervalued, and once this is done, the expert advisor will decide whether to perform an action or refrain from performing it. It is a very simple but power
FREE

CANDLESTICK_MT5
A very interesting indicator of candlestick patterns, converted from the free version of the CANDLESTICK indicator for the MetaTrader4 terminal to the version for the MetaTrader5 terminal. In addition to candlestick patterns, it draws support and resistance lines, which are perfectly worked out by the price on the chart. It can work on any timeframe. Has simple settings. When converting, the logic of work and the design of the original CANDLESTICK indicator for the MT4 termina
FREE

Trend Fibonacci is a unique indicator that combines a power of Fibonacci sequences and ranges. Channel Group: Click Here
How to read:
- There are three zones --> red, gold and green
- Red candlestick = downtrend
- Green candlestick = uptrend
- Gold candlestick = no established trend
Inputs: Per = number of bars used for calculations FirstRatio = first Fibonacci ratio (Or use any ratio you want) SecondRatio = second Fibonacci ratio (Or use any ratio you want)
!! IF YOU PURCHASE TH
FREE

If you are (or were) a fan of the RSI indicator will love Tushar Chande's Dynamic Momentum Index indicator, that simply put is a dynamic variable lenght RSI, so it is more powerful. The DMI indicator internally uses a variable number of bars in its calculations, taking into consideration the volatility levels of the current market you are analyzing. This way, the DMI indicator will use more bars as volatility decreases and less bars when volatility increases, giving you a more powerfull analysis
FREE

Gatotkaca Support Resistance Trendline Indicator is a simple indicator that detects support, resistance and trendlines. It will helps you find breakout momentum based on lines calculated by this indicator. This is conceptually based on fractals, but with customizable periods. Compatible for any timeframes. You can customize how this indicator work by setting up the period input.
FREE

This is a buyer and seller aggression indicator that analyzes the shape of each candle and project this data in a histogram form. There are 4 histograms in one. On the front we have two: Upper - Buyer force. Lower - Seller force. At the background we also have two histogram, both with same color. They measure the combined strenght of buyers and sellers. This histograms can be turned off in Input Parameters. It is also possible to have the real or tick volume to help on this force measurement. IN
FREE

The RFOC Symbol Background was created to display the name of the asset and the current timeframe in the background of the chart.
Displaying the name of the asset at the bottom of the chart is often used by traders who are designing the screen for spectators, making it easier to identify the asset and the timeframe during a class, for example.
It is available for the user to select the font size (small, medium or large) and select the color for better viewing according to the background colo
FREE
SignalDeMarker - stable in its work automatic adviser. The algorithm of the adviser's work is based on the definition of overbought / oversold market zones, built on the basis of an assessment of the current demand and the level of risk. The indicator is installed in the usual way, on a chart with a time period of D1 and works with any trading instrument. Options Expert_MagicNumber = 1234 - magic number
Signal_StopLevel = 50.0 - level of stop-loss (in points)
Signal_TakeLevel = 50.0 - Level
FREE

Keltner-Enhanced improves the accuracy and readability of Keltner Channels with many options for adjusting them and more five price calculations beyond the META default.
The Keltner-E indicator is a banded indicator similar to Bollinger Bands and Moving Average Envelopes. They consist of an upper envelope above a midline and a lower envelope below the midline.
The main occurrences to look out for when using Keltner Channels are breakouts above the Upper Envelope or below the Lower Envelope
FREE

Price and Spread Indicator
Version: 1.0 Developer: Creative Tech Solutions Website: https://www.creativetechsolutions.co.uk
Overview The Price and Spread Indicator is a great tool for MetaTrader 5 that displays the Ask and Bid prices along with the spread directly on the chart. This indicator provides real-time updates and allows traders to make informed decisions based on accurate price information.
Features - Real-time Price Updates: Continuously updates Ask and Bid prices. - Spread D
FREE

Are You Better than Monkey? Prove it...
The trade of this EA is based on random output with customizable lot size (use martingale or not), stop-loss, and take-profit levels. Easy to use and Simple Great for benchmarking tests against other EAs or manual trade. Works for ECN/Non-ECN brokers and 2-3-4-5 digit symbols Support us by open My recommended broker. Exness Tickmill robot monkey uses Adx trend filter for fair game no-trade unfavorable market ( you can turn off set adx = 0) . EA starts
FREE

모든 전략을 스캔하고 해당 자산의 모든 타임프레임에서 매수 및 매도 지점을 보여주는 스캐너를 가지고 싶어 해본 적이 있나요? 이것이 정확히 이 스캐너가 하는 일입니다. 이 스캐너는 프로그래밍이 필요하지 않은 전략 생성기인 Rule Plotter: 프로그래밍 없이 전략을 만드는 도구 에서 생성한 매수 및 매도 신호를 다양한 자산 및 타임프레임에서 실행하기 위해 설계되었습니다. Rule Plotter의 기본 전략은 양봉과 음봉뿐입니다. 이것은 Rule Plotter에 전략을 그리지 않으면 선택한 자산의 모든 타임프레임에서 봉의 색상을 보여줄 것입니다. 음봉이면 빨간색이고, 양봉이면 녹색입니다. 원하는 만큼 전략을 만드세요 기본 전략에 제한받지 마세요. Metatrader에서 사용 가능한 모든 지표를 사용하여 전통적인 전략을 만들거나 선호하는 지표를 사용하여 사용자 지정 전략을 만드세요. 이 스캐너는 Rule Plotter가 제공하는 것 중 일부에 불과하며 Rule Plotter의 보조
FREE

The "Simple Trading Controller" for MetaTrader 5 sets a new standard for speed and efficiency in opening and closing market positions. Crafted with a clean and intuitive design, this tool is a response to the specific needs of traders, ensuring a seamless and rapid trading experience. All it provides is: Quick BUY and SELL Buttons Open multiple operations at the same time Set Trade Size Set Stop Loss Take Profit Points Close All Positions Let's go and see the advantages of using "Simple Trading
FREE

Silent Trader The fully automated Silent Trader EA opens positions after receiving signal from 4 indicators: Money Flow Index, Force Index, Alligator and Standard Deviation. It also contains stop loss and take profit. GBPJPY M30 Entry lots: minim 0.1 Stop Loss: 184 pips Take Profit: 284 pips Minimum acount: 1000 - 2000 $ Max Spread : 20 points Account leverage - from 1:500. Terminal - MetaTrader5 Recommendation : ü MaxLotSize - maximal allowed trading lot. Change this param
FREE

Индикатор Trade in trend предназначен для торговли по тренду. Сила тренда определяется шириной линии. Узкая линия - начало или конец тренда. Широкая линия свидетельствует о высокой силе тренда. Резкая смена ширины линии свидетельствует, с большой вероятностью, об окончании тенденции. Сигналы индикатора Не против покупки: переход с красной линии в белую цена отразилась от белой линии индикатора цена находится выше белой линии индикатора Не против продажи: переход с белой линии в красную цена отр
FREE

QuantumAlert CCI Navigator is a free indicator available for MT4/MT5 platforms, its work is to provide "alerts" when the market is inside "overbought and oversold" regions in the form of "buy or sell" signals. This indicator comes with many customization options mentioned in the parameter section below, user can customise these parameters as needful. Join our MQL5 group , where we share important news and updates. You are also welcome to join our private channel as well, contact me for the pri
FREE

Indicators are for trend followers!
A trading system constructed by three moving averages. Trade with the trend and let profits run. Necessary for traders: tools and indicators Waves automatically calculate indicators, channel trend trading Perfect trend-wave automatic calculation channel calculation , MT4 Perfect trend-wave automatic calculation channel calculation , MT5 Local Trading copying Easy And Fast Copy , MT4 Easy And Fast Copy , MT5 Local Trading copying For DEMO Easy And Fast Copy
FREE

This indicator evaluates the market sentiment using raw price action measurements, and it is an amazing trading confirmation. It can be used to take a trend-trade approach or a contrarian approach using reversal patterns. [ Installation Guide | Update Guide | Troubleshooting | FAQ | All Products ] Find early reversals Confirm short-term trades Detect indecision on the market Take contrarian trades near support and resistance levels Trade inside bars confirmed by overall direction of the market T
FREE
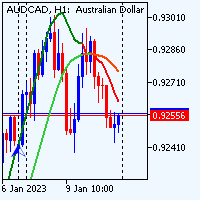
Test Before Use... In the forex market, a range refers to a period of time during which the price of a currency pair remains relatively stable, fluctuating within a narrow band. This can be contrasted with a trend, which refers to a sustained movement in the price of a currency pair in a particular direction. During a range, the price of the currency pair may move up and down within a defined range, but it is not trending strongly in any particular direction. This can be a good time for the rang
FREE

Whether you are a scalper or daily trader, you will always look for bullish / bearish engulfing candles. This can be a bit tricky and stressful when you try to visually identify the engulfing candles on the chart. Not only that, you might be trading on the M15 time frame but the engulfing candle is forming or has already formed in the H4 time frame. This indicator is made to do that on your behalf. You can trade on any time frame and see Engulfing candles of another time frame, this means that
FREE

Description des paramètres :
Doushoku samourai est un robot trading adapté pour du trading semi-automatisé. Il utilise une moyenne mobile pour déterminer les ordres qu'il doit passer. Si le prix actuel est au-dessus de la moyenne mobile, il achète. Si le prix actuel est en-dessous de la moyenne mobile, il vend. Le calcul du take-profit (ou target) est déterminée en points (0.1 PIP).
Il est le résultat de la différence entre un prix choisi nb bougies dans le passé et le prix de la dernière b
FREE

O Indicador valida a força da tendência utilizando o volume negociado. Os candles são mostrados na cor verde indicando força compradora e cor vermelha na força vendedora. O movimento é encerrado pelo SAR parabólico. Vantagens: Filtra distorções de preço sem volume financeiro; Filtra consolidações e movimentos laterais; Filtra divergências de volume pelo indicador Money Flow. Desvantagens: Não filtra todos os falsos rompimentos, visto que rompimentos importantes geram altos volumes financeiros; N
FREE

The Supertrend etradro indicator is volatility based and is more of a trend following indicator in function. The ATR indicator, which is integrated into the calculation of the super trend, also calculates course gaps (gaps) and does not overlook them. This allows more accurate values to be calculated. When measuring volatility, the mean value of the current price serves as the basis. Since the Supertrend indicator features sliding stop and reversal lines, it is quite similar in function to the P
FREE

지표 소개:
지표는 추세선과 히스토그램을 그립니다. 가격 지연이 적고 미래 기능이 없으며 신호가 표류하지 않습니다. 시장이 지역간 변동을 보일 때 표시기가 빨간색과 녹색 히스토그램으로 나타나면 저가 구역이고, 표시기가 자홍색과 노란색 히스토그램으로 나타나면 고가 구역입니다. 또한 고가 및 저가 영역에 따라 시장의 추세를 분석하는 데 사용할 수 있습니다. 표시기 이전 k 라인에 위쪽 화살표 또는 아래쪽 화살표가 있을 때 이 신호를 사용하여 때때로 거래할 수 있도록 편의를 제공하기 위해 이메일, 경고 및 알림을 보낼 수 있습니다. 표시기에는 히스토그램의 높이, 선의 기간 및 비율을 포함하여 변경 가능한 매개변수가 있습니다. 모든 시간대에 적용되며 M1 이상의 시간대에 적합합니다. 표시기의 작업은 스크린샷에 나와 있습니다. 이 표시기가 거래에 도움이 되기를 바랍니다.
FREE

Indicator measures strength of each currency in your list.
Main idea: It simply iterates through all combinations of pairs and adds difference between open and close in percent. Parameters: List of currencies - what currencies will be calculated (maximum is 8) Calculation type - from which data will be strength calculated Calculation data input - used as input related to calculation type Symbol suffix - used in case of suffix on symbols, e.g: when your symbols look like EURUSDm, EURUSDmicro et
FREE

혁신적인 전문가 어드바이저 Awesome Comparative를 통해 Awesome Oscillator 지표의 가장 효과적인 전략을 발견하세요.
Awesome Comparative를 사용하면 MetaTrader5 전략 테스터에서 포괄적인 테스트를 수행하여 귀하의 브로커, 선호하는 자산 및 시간대에 가장 적합한 Awesome Oscillator 전략을 결정할 수 있습니다.
저희 EA는 Saucer, Twin Peaks 및 Zero Line Cross와 같이 세 가지 포함된 전략을 제공합니다. 또한 이러한 전략을 9가지 다른 방식으로 조합할 수 있어 결과와 스크린샷을 예시로 얻을 수 있습니다.
Awesome Comparative의 장점 중 하나는 Awesome Oscillator 지표에 대한 독점적인 초점입니다. 추가적인 필터나 진입 트리거가 포함되지 않아 이 지표의 특성을 철저히 탐구하고 이해할 수 있습니다. 또한 포지션 종료를 변경하는 스탑로스나 테이크프로핏 레벨은
FREE
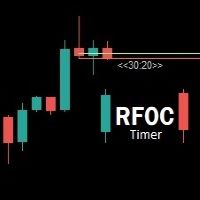
Uma informação de grande valor para o trader se localizar no tempo é a informação de quanto tempo temos para o encerramento do candle atual ou quanto falta para a formação de um novo candle. O RFOC Timer apresenta esta informação de forma clara e alocada à direita do candle atual. Adicionalmente o RFOC Timer acompanha a opção de inclusão das linhas de preços ASK e BID com e sem extensão a direita e/ou esquerda. Esta função auxilia, por exemplo, a não sobreposição das linhas de ASK e BID com as
FREE

EUPulse : The EUPulse trading robot is designed to operate on the EUR/USD currency pair. Optimized for an M30 (30-minute) trading timeframe, it offers a balanced approach for traders aiming to combine short-term and medium-term strategies. Technical Indicators Used Kaufman's Adaptive Moving Average (KAMA) : This adaptive moving average adjusts based on market volatility, smoothing price data to filter out noise while staying responsive to significant price movements. The robot uses KAMA to ident
FREE
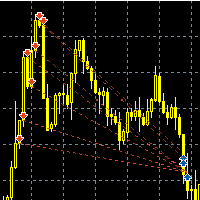
Название советника : Survivor (есть расширенная версия: https://www.mql5.com/ru/market/product/36530 ) Валютные пары : USDJPY, EURUSD, GBPUSD, AUDUSD, GBPJPY, XAUUSD, EURCHF Рекомендованная валютная пара : USDJPY Таймфрейм : М5 Время торговли : круглосуточно Описание : Трендовый советник с возможностью мартингейла и построением сетки ордеров. В советнике используются три группы аналогичных сигналов для открытия, закрытия и дополнительных сделок. При наличии тренда(определяется МА) ловится отс
FREE

This auxiliary indicator displays time left before closing on the current timeframe with continuous update . It also shows the last trade price and variation from a previous day close in percentage and points. This indicator is pretty handy for daytraders and scalpers who want to precisely monitor closing and opening of candles.
Indicator parameters Show in shifted end - Default: False. Display time and values on screen. If True, Displays only time to close aside last candle. Distance from the
FREE

This is a free version of the indicator, the period between the vertical lines is always 30 bars. In the paid version the period can be set by user, so a configuration with many ThreePointsChannel indicators with different periods is possible.
The principle of construction - on top of any number of bars set by the user, a channel is constructed with maximum and minimum lines so that the bars touch the maximum and minimum of the channel at exactly three points. The name of the indicator follows
FREE

RSI Martingale is simply based on the RSI indicator. You can avail it for an affordable price right now because SET and OPTIMIZATION files are not yet available. The rules of the EA is when the indicator reaches the overbought condition, it will open a sell position and buy when the indicator reaches the oversold condition. When the trade is lost, the EA will trade the same position with a doubled lot size.
FREE

This indicator draws the Donchian Channel, filling the background with colors. The color of the middle line is changed following the current trend, based on the standard interpretation of the Donchian Channel.
Input Parameters: Period of the Channel (default is 20) Validate Signals (boolean value to filter out false breakouts, default is false) Background Settings
Show Background (default is true) U ptrend Color (default is DodgerBlue ) Downtrend Color (default is Orchid) Background Tr
FREE
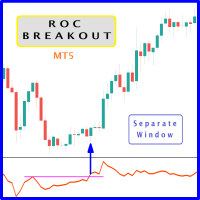
When prices breakout resistance levels are combined with Rate of Change oscillator "ROC" breaks out its historical resistance levels then higher chances emerges to record farther prices. It's strongly encouraged to confirm price breakout with oscillator breakout since they have comparable effects to price breaking support and resistance levels; certainly short trades will have the same perception. Concept is based on find swing levels which based on number of bars by each side to confirm peak or
FREE

WARNING: Product is out of support!
Free version of the grid strategy! Identical strategy to the full version, the only limitation is the number of positions. Its goal is to harvest most out of trending market (on automatic mode) taking advantage of corrections in trends. It can be also used by experienced traders on manual trading. This kind of system is being used by most successful social traders having 500+ paid subscribers. Combine your trading experience with this automatic strategy! It
FREE
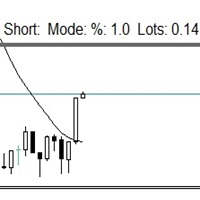
이 작은 도구는 차트에서 간단한 선을 드래그하여 위험 관리를 정의하는 데 도움이 됩니다. 계정 % 또는 라인에서 직접 고정 금액으로 계산된 실제 로트 크기를 보여줍니다.
당신이 해야 할 일은 키보드의 "t" 키를 눌러 라인을 활성화하고 라인을 손실 정지 지점으로 드래그하는 것입니다. 그게 다야.
설정에서 선과 텍스트의 색상과 너비, 선과 오른쪽 사이의 텍스트 공간을 정의할 수 있으며 계정 비율 또는 고정 금액 크기로 위험을 설정할 수 있습니다.
질문이나 희망사항이 있으시면 언제든지 문의해 주세요.
이 작은 도구는 차트에서 간단한 선을 드래그하여 위험 관리를 정의하는 데 도움이 됩니다. 계정 % 또는 라인에서 직접 고정 금액으로 계산된 실제 로트 크기를 보여줍니다.
당신이 해야 할 일은 키보드의 "t" 키를 눌러 라인을 활성화하고 라인을 손실 정지 지점으로 드래그하는 것입니다. 그게 다야.
설정에서 선과 텍스트의 색상과 너비, 선과 오른쪽 사이의
FREE

Double Smoothed Stochastic is similar to Stochastic except for this Indicator we use what is called double exponentially smoothing.
This will give the trader a more speedy response to price changes which tends to smooth out the erratic movements of a regular Stochastic.
Double Smoothed Stochastic Calculation is : DSS = EMA(r) (X - Lxn / Hxn - Lxn) x 100 MIT = EMA(r) (close - Ln / Hn - Ln) x 100
Ln = lowest low of n periods Hn = highest high of n periodsLxn = lowest low of the price se
FREE

Candle High Low
Indicator showing High and Low of X candles across a line.
Settings Candle number for calculation (>= 1 ) - Define the number of candles for the indicator to find the maximum and minimum of that period of candles. Continuation of the line's display to the right - If you want the High and Low line to extend to the right edge of the graph Line High Color - Set line color Line High Style - Set line style Line Low Color - Set line color Line Low Style - Set line style
FREE

The NQ_H4_820422556_S_BB_CF_SQX is an algorithmic trading strategy for MetaTrader, tested on NQ using the H4 timeframe from December 7, 2017, to June 2, 2023. There is no need to set up parameters, all settings are already optimized and fine-tuned.
Recommended broker RoboForex because of EET timezone.
You can find the strategy source code for StrategyQuant at the link: http://quantmonitor.net/listing/nasdaq-trend-catcher/
Key details are:
MagicNumber: 820422556 Main Chart: Current
FREE

This indicator serves as an alert for climax regions.
How does it work? When the 20-period arithmetic moving average meets the 200-period arithmetic moving average, a conflict region forms with two major opposing forces fighting. This causes the price to show random peaks until a winner side is defined, which can be dangerous. Therefore, the indicator paints the region between the moving averages to alert you.
How to use it? It can be used for specific volatility or support and resistance s
FREE

This indicator combines RSI(14) and ADX(14) to find out the signal that price moves strongly. When it appears signal (represent by the yellow dot), and price is going down, let consider to open a SELL order. Otherwise, let consider to open a BUY order. In this case, the strength of moving is strong (normally after sideway period), so we can set TP by 3 times of SL .
FREE

A pin bar pattern consists of one price bar, typically a candlestick price bar, which represents a sharp reversal and rejection of price. The pin bar reversal as it is sometimes called, is defined by a long tail, the tail is also referred to as a “shadow” or “wick”. The area between the open and close of the pin bar is called its “real body”, and pin bars generally have small real bodies in comparison to their long tails.
The tail of the pin bar shows the area of price that was rejected, and
FREE

No Nonsense Forex 방법을 위한 트레이드 패널 차트를 깨끗하게 유지하면서 거래 속도를 향상시키십시오.
특징: -포지션 사이징: 매수/매도를 클릭하면 이 도구는 귀하의 위험에 가장 근접한 로트의 양으로 2개의 거래를 엽니다(각 거래에서 사용되는 잔액의 백분율). 핍 값 계산은 잊어버리세요!
-SL 및 TP: 각 거래는 1.5*ATR에서 손절매로 시작되고 1*ATR에서 이익실현으로 두 절반 중 하나가 열립니다. 사용된 ATR 값은 일일 양초를 완료하는 데 4시간 미만이 남은 경우 현재 양초 중 하나이고, 그렇지 않은 경우 이전 양초 값입니다.
- 손절매 업데이트: 손절매를 손익분기점으로 설정하거나 NNFX의 규칙에 따라 후행 손절매를 업데이트하십시오(가격이 2*ATR로 이동한 후 손절매를 1.5*ATR로 이동). -포지션 닫기: 종료 신호를 받으면 단 한 번의 클릭으로 모든 매수 또는 매도를 마감합니다.
기타 고려 사항: - 프로그램은 다른 전문가가
FREE

작업 논리
Stop Out 유틸리티는 Stop Out 레벨까지 남은 포인트 수를 보여주는 간단하지만 매우 편리한 표시기입니다.
이점은 많은 트레이더가 이익을 추구하는 거래의 위험을 의도적으로 과대 평가하고 사용 가능한 마진을 최대로 사용한다는 사실에 있으며, 이 경우 브로커가 강제로 포지션을 닫을 수 있는 위치를 아는 것이 매우 중요합니다.
차트에 표시기를 놓고 매수 또는 매도의 열린 위치에 따라 차트에서 바로 이 거래 가격의 경계 표시를 볼 수 있습니다.
포지션을 열 때까지는 차트에 선이 보이지 않습니다.
차트에 선이 표시되지 않는다고 해서 유틸리티가 작동하지 않는 것은 아닙니다. 거래의 위험이 최소화되고 예금이 클 가능성이 높으므로 스탑 아웃 선을 훨씬 더 높게 찾아야 합니다. / 현재의 위험으로 당신은 스톱 아웃에서 멀리 떨어져 있기 때문에 거래보다 낮습니다.
질문이 있는 경우 토론 섹션에 질문을 작성할 수 있습니다. 즐거운 거래. Recommended
FREE

FRB Aggression Balance - Indicator shows the Agression Balance of the TIMEFRAMES chosen by the user through a histogram in a new window. - This indicator can only be used if the broker provides data on Volumes. Forex market brokers do not report this data. - B3 (Bovespa - Brazil) informs the data and with that it is possible to use it in Brazilian brokerages.
Settings Color - Define the color that will be shown in the histogram. Use Historical Data - Defines whether the indicator will calcu
FREE

VR 그리드 표시기는 사용자 정의 설정으로 그래픽 그리드를 생성하도록 설계 되었습니다. 표준 그리드 와 달리 VR 그리드는 원형 레벨 을 구축하는 데 사용됩니다. 사용자의 선택에 따라 라운드 수준 사이의 단계는 임의적일 수 있습니다. 또한 VR Grid는 다른 인디케이터나 유틸리티와는 달리 기간이 바뀌거나 단말기를 재부팅해도 그리드의 위치 를 유지합니다. 설정, 세트 파일, 데모 버전, 지침, 문제 해결 등은 다음에서 얻을 수 있습니다. [블로그]
다음에서 리뷰를 읽거나 작성할 수 있습니다. [링크]
버전 [MetaTrader 4] 수직 수준 은 실제 시간 간격을 기준으로 하며 누락 또는 존재하지 않는 기간은 무시 합니다. 따라서 레벨 사이의 단계는 사용자가 선택한 값과 엄격하게 일치합니다. VR 그리드 표시기를 사용할 때 트레이더는 모든 수준에서 스타일 , 수직선 및 수평선의 색상 및 두께를 변경할 수 있습니다. 이를 통해 금융 상품의 라운드 수준 을 제어할 수 있습니다.
FREE

Introducing Adolla Burst FX for EURUSD H1 chart Adolla Burst FX is a groundbreaking expert advisor designed for trading EURUSD H1 chart on the Meta Trader 5 platform, featuring a sophisticated amalgamation of 50 rigorously validated strategies. Developed over an impressive span of 17 years since 2008, Adolla Burst FX stands out for its precision in market despite not using normal TP or SL methods. Its completely indicator based with an advanced reversal function for effective chart navigation.
FREE

Apply to the 5 minute timeframe against the major USD forex pairs. AUDUSD EURUSD GBPUSD USDCAD USDCHF USDJPY Highlights the PropSense Book Levels Turn on/off for Sydney, Asia, London and New York Sessions Shows the Tokyo and London Fixes Turn on/off for Tokyo and London Configure how many historical fixes to show Shows the Sessions Turn on/off visible indication for sessions (supports 4 sessions) Visibly shows the sessions (out of the box configuration for Sydney, Tokyo, London and New York) Hig
FREE

Volume Weighted Average Price (VWAP) is a trading benchmark commonly used by Big Players that gives the average price a Symbol has traded throughout the day. It is based on both Volume and price. Additionally we put in this indicator the MVWAP (Moving Volume Weighted Average Price). For those who do not know the usage and the importance od this indicator I recommend a great article about this subject at Investopedia ( https://www.investopedia.com/articles/trading/11/trading-with-vwap-mvwap.asp )
FREE

The Martinware Volume indicator plots a colored moving average over volume bars. The coloring uses three colors and can be done in different ways choosable by the user and is applied both to the average as to the volume bars.
Three types of coloring are possible: None: no coloring is done Increasing or decreasing: changes the color depending on the current value being bigger or lesser than the previous one Volume relative to average: colors vary if the current volume is bigger or lesser then
FREE

Hunt markets with Hunttern ZigZag . Easy to use with one parameter
You can use it for the following: -Classic patterns -Heads and shoulders -Harmonic patterns -Elliott Wave -Support and resistance -Supply and Demand
Single parameter: -Period (1-120)
Features: -Candle time -Single parameter -Light mode template
This is version 1 of Hunttern ZigZag. We are very happy to receive feedback from you.
FREE

주소를 추가해야합니다' http://ec.forexprostools.com/'허용 된 URL 탭 목록에서'도구/옵션/고문'
라이브 신호:
https://www.mql5.com/en/signals/1286661
브로커에게 최적화하고 사용자 정의해야합니다.
FNG 고문으로 당신은 가장 당신과 당신의 거래 스타일에 맞는 전략을 만들 수 있습니다.
특징::
필터 표시기:봉투,곰/황소,이동 평균,윌리엄스의 퍼센트 범위 및 ATR
뉴스 필터-뉴스 전에 거래를 닫고 뉴스 전에 거래를 중지
브로커에서 숨겨진 TP/SL
퍼짐
FNG Advisor 를 사용하는 방법:
이 전문가를 사용하는 것은 꽤 솔직합니다. "신호 표시기"에서 주요 신호 표시기 중 하나를 선택합니다. 각 표시기는 표시기 제목 아래에 입력이 있습니다. 다음으로 개별적으로 활성화 또는 비활성화하여 사용할 필터 표시기를 선택할 수 있습니다. 각 표시기에는 시간대
FREE

This is an extension indicator that allows the user to select any second time-frame from 1 to 60 second without any multiplier limitaion (ex, 7 seconds, 13 seconds ... are all allowed).
There is only one input called Interval that allows you to set the seconds timeframe you want given is in the range above. You can use indicators on that new time frame with no problems and also build your EAs based on any second timeframe. I hope this is useful, please let me know any bugs you find!
Note: Sin
FREE

I think you all know Donchian Channels. so I am not going to write about it.
With this indicator I tried to create Donchian Trend Ribbon by using Donchian Channels.
How it works ?
- it calculates main trend direction by using the length that is user-defined. so you can change it as you wish
- then it calculates trend direction for each 9 lower lengths. if you set the length = 20 then the lengths are 19, 18,...11
- and it checks if the trend directions that came from lower lengths i
FREE

The "Dagangduit Spread Indicator" is a versatile tool designed to provide traders with essential information about the current spread in the chart window. This indicator offers customizable features, including font parameters, display location on the chart, spread normalization, and alerts to enhance your trading experience. Key Features: Real-time Spread Display : The indicator displays the current spread in real-time on your trading chart, allowing you to stay informed about the cost of execut
FREE

TG Ponto de Cobertura (Coverage Trade)
This Indicator checks your trading results on the day relative to the asset on the chart and adds a line at the price corresponding to the coverage point for the open position, considering the entry price and lot size. The coverage point will be recalculated after new entries, based on the average price of the open operation and the lot size.
If the result for the day is zero, a line will be displayed at the price of the current trade.
If the day's r
FREE

The utility places a grid of pending orders . You can select the number of orders in the grid, the step between orders, multiplier for the order size, SL and TP levels and the magic number. MT4 version of the utility is avaliable by the link - https://www.mql5.com/en/market/product/73490 If you like this utility, take a look at my other products - https://www.mql5.com/en/users/nina_yermolenko/seller
FREE

The indicator draws daily support and resistance lines on the chart, as well as the Pivot level (reversal level).
Adapted to work in MT5
The standard timeframe for calculating support and resistance levels is D1. You can choose other timeframes according to your strategy (for example, for M1-M15, the optimal timeframe for calculations is H1)
The function for calculating support and resistance levels has been updated; in this calculation option, fibonacci levels are taken into account, res
FREE

When prices breakout resistance levels are combined with momentum oscillator breaks out its historical resistance levels then probability emerges to record farther higher prices. It's strongly encouraged to confirm price breakout with oscillator breakout since they have comparable effects to price breaking support and resistance levels; certainly short trades will have the same perception. Concept is based on find swing levels which based on number of bars by each side to confirm peak or trough
FREE

Blitz Trade Scalper - Precision Scalping Made Effortless Experience the next level of precision scalping with Blitz Trade Scalper, is a robust MetaTrader 5 Expert Advisor designed for the 15-minute timeframe. Embrace the world of high-frequency trading with an EA that requires no adjustments – simply activate, and watch as it navigates the markets with surgical precision.
IMPORTANT!! Bot works best on the EURUSD and GBPUSD chart. For other pairs you can back test to test the performance in
FREE

This indicator draws regular bullish and bearish divergences in real-time onto the charts. The algorithm to detect those divergences is based on my 10+ years experience of detecting divergences visually. The divergences are drawn as green and red rectangles on the charts. You can even do forward testing in the visual mode of the strategy tester. This FREE Version is restricted to EURUSD and GBPUSD. The full version without restrictions is here: https://www.mql5.com/en/market/product/42758
Par
FREE

Real Quants Forex Volatility Catcher for MT5 Introduction Real Quants Forex Volatility Catcher is a cutting-edge automated trading system designed specifically for MetaTrader 5. Developed through advanced machine learning and exhaustive data mining techniques, this system offers traders a robust strategy for navigating the complex terrains of the forex markets. With a commitment to rigorous testing that includes Monte Carlo simulations, walk-forward matrix optimization, and live execution valida
FREE
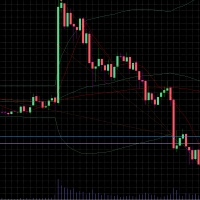
BB Trader is based on the Bollinger Band indicator based on a sell above upper band and buy below the lower band strategy. The EA allows use of multiple grid trades with ATR adjusted spacing. Coded into the EA is a proprietary auto lot sizing algorithm used for placing grid trades. Closing of trades is set in points and an option is included to utilise the opposite Bollinger Band condition.
FREE

A Simple clock that on the left side "Time" shows r espectively the TimeCurrent, followed beneath by the TimeLocal. On the right hand side we have the remaining minutes and seconds of the current candle. TimeLocal is synced every 500 miliseconds however, the TimeCurrent and the time left on the candle are synced every tick, so this can lead to inconsistencies on the readings so keep that in mind.
This indicator have no plots or buffers so it cannot be used in any time based EA.
FREE

BreakdownX — это передовой торговый робот для MT5. Он использует стратегию определения уровней поддержки и сопротивления, чтобы выявлять оптимальные точки входа и выхода на рынке. Особенности: Автоматизированная Стратегия Определения Уровней : Наш советник анализирует рынок, используя [заданное число] последних свечей, чтобы точно определить уровни поддержки и сопротивления. Динамический Расчет Размера Позиции : Встроенный механизм оптимизации размера лота на основе текущего баланса и уровня рис
FREE

The selective pin bar is designed to identify reversals. To use the selective pin bar effectively, traders typically look for Strong Rejection: The tail of the pin bar should extend significantly beyond the surrounding price action. It indicates that there was a sharp rejection of higher or lower prices during the trading period. A strong rejection suggests that the market sentiment may be changing.
FREE

Please backtest with the exact balance of your live account before applying to real money. ==> If account balance is too low it may not trade at all!
For MT4 version please contact via private message. martingale version is available here . Strategy description - Detect trend based on EMA18-EMA50-SMA200 alignment in three time frames: M15, H1, H4 - Trade in trend direction and exit when above alignment is broken. - The bot is tuned to trade XAUUSD(Gold). - The bot output is break even in rangi
FREE
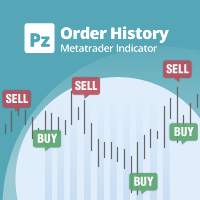
전략 테스터의 시각적 모드와 매우 유사한 라이브 차트의 거래/주문 내역을 표시하는 범용 지표입니다. 교육, 개선, 리버스 엔지니어링 또는 진단 목적으로 특정 기호의 실제 거래 내역을 조사할 수 있습니다. 마스터 비밀번호와 투자자 비밀번호 모두 성공적으로 사용할 수 있습니다.
[ 설치 가이드 | 업데이트 가이드 | 문제 해결 | 자주하는 질문 | 모든 제품 ]
몇 가지 주요 기능은 다음과 같습니다.
방향 분석
모든 거래에 대한 손익 레이블
사용자 정의 가능한 색상 및 크기 이익 계수의 계산 요일 및 시간별 거래 활동 내역
입력 매개변수 구매 화살표: 구매 화살표의 색상
판매 화살표: 판매 화살표의 색상
구매 화살표 크기: 구매 및 판매 화살표의 크기
닫기 구매: 구매 주문 마감 색상
마감 매도: 매도 주문 마감 색상
닫기 화살표 크기: 닫기 주문 화살표의 크기
Winning Trade Line: 수익성 있는 거래를 표시하는 라인의 색상
손실 트레이드 라
FREE

Land Breaker FX Trading System Overview: Welcome to the Land Breaker FX Trading System, a groundbreaking solution for aggressive traders. Since its inception in 2008, this system has been optimized and fine-tuned to deliver exceptional performance on the EUR/USD pair using the H1 chart. The Land Breaker FX boasts over 35,000 trades and brings potential high returns with minimal drawdown. Key Features: 100 Optimized Strategies: Each strategy has been meticulously optimized since 2008, ensuring ro
FREE

This tool will remove buttons and text labels from the chart, after you remove Trading box Order management or Trading box Technical analysis .
You just need to drag this tool to your chart and after cleanup of objects is finished, the tool will remove itself from the chart.
Please check images below that present Before and After using the Removal tool.
There is also a short YouTube video at the bottom to show how easy it is to clean your chart after using Trading box tools.
- input var
FREE
트레이딩 전략과 기술 지표를 판매하기에 가장 좋은 장소가 왜 MetaTrader 마켓인지 알고 계십니까? 광고나 소프트웨어 보호가 필요 없고, 지불 문제도 없습니다. 모든 것이 MetaTrader 마켓에서 제공됩니다.
트레이딩 기회를 놓치고 있어요:
- 무료 트레이딩 앱
- 복사용 8,000 이상의 시그널
- 금융 시장 개척을 위한 경제 뉴스
등록
로그인
계정이 없으시면, 가입하십시오
MQL5.com 웹사이트에 로그인을 하기 위해 쿠키를 허용하십시오.
브라우저에서 필요한 설정을 활성화하시지 않으면, 로그인할 수 없습니다.