MetaTrader 5용 무료 Expert Advisor 및 지표 - 15

Description : Rainbow MT5 is a technical indicator based on Moving Average with period 34 and very easy to use. When price crosses above MA and MA changes color to green, then this is a signal to buy. When price crosses below MA and MA changes color to red, then this is a signal to sell. The Expert advisor ( Rainbow EA MT5 ) based on Rainbow MT5 indicator is now available here .
MT4 version is available here .
FREE

IDixie is an indicator which shows open and close values of the American dollar index, DXY or "Dixie". The indicator is calculated from weighted values of 6 major symbols: EURUSD, USDJPY, GBPUSD, USDCAD, USDSEK, and USDCHF. In addition to "Dixie" values, the indicator also shows a moving average. You can set the period of the moving average. When bars of the indicator break through the moving average, this creates good opportunities to enter the market. As a rule, signals from this indicator are
FREE

O indicador Supertrendingsignal imprime um sinal na tela indicando início de uma forte tendência. O sinal não mostra o ponto de entrada com melhor risco retorno, apenas faz a indicação de uma forte tendência. Foi idealizado a partir de um conjunto de médias móveis e volume. Parametros: Periodmalongo: Períodos da média longa Periodmamedio: Períodos da segunda media Periodmamedio2: Perídos da terceira media Periodmacurto: Períodos da média curta. PeriodATR: Períodos do indicador ATR para adequar
FREE

It is the very same classic Stochastic indicator, but with a little twist: we changed the Signal Line with a 2-color line, so we can use it with EAs as a filtering system. And that's it! I know it could seem stupid but I needed that, so I created it. The original formula is right from Metaquote's chest, no additions, no subtractions, it is Stochastics in its core.
So I will not publish here the Stochastics parameters as they are all the same as always... Enjoy!
If you like this indicator, all
FREE

Candle Counter This product counts the candles and shows the result according to the configuration defined by the user. Professional traders use it to emphasize a specific candlestick.
Settings Position - Choose whether the numbers will be displayed above or below the candle Distance - The distance that the number will have from the candle, referring to the minimum or maximum Font Size - Font Size Color - Font Color
FREE

This indicator is an automated version of the Fibonacci retracement (Fib) indicator. Deciding the best areas to use when drawing the fib can be tricky and this indicator was made with that in mind. When you drop it on the chart it will automatically choose the best points to draw the fib with, but in case you aren't satisfied with those regions, you can adjust it as you wish.
FREE

The indicator that shows the countdown to the change of candles is equipped with an alert when the bar changes (the alert is not active if installed on the M1 time frame). Displays seconds if installed in time frame M1, displays minutes and seconds if installed in time frame above M1, and displays hours and minutes if installed in time frame h1 and above. The time displayed is calculated based on the running time.
FREE

Camarilla Swing Trade Indicator is an Indicator. Support and resistance points are calculated from the High Low Close of the previous TF Week's price.
What are Camarilla Pivot Points?
1.Camarilla Pivot Points is a modified version of the classic Pivot Point. 2.Camarilla Pivot Points was launched in 1989 by Nick Scott, a successful bond trader. 3.The basic idea behind Camarilla Pivot Points is that price tends to revert to its mean until it doesn't. 4.Camarilla Pivot Points is a mathematical
FREE
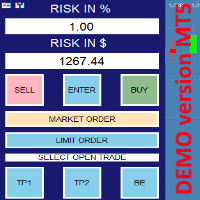
this is DEMO VERISON (for demo acc.) of TRADING OVERLAY with PARTIAL take profit ("virtual TP") and % risk lot size
--- full version available on my 'seller page' as well as version for MT4 Take better control of your trades with ease ! Easy lot size calculation with easy SL/TP setting. Your trading will be much more comfortable with this tool!
Main goal with this tool is very SIMPLE and FAST operation! Works like any EA, add it to selected chart and trade !
Features: start
FREE
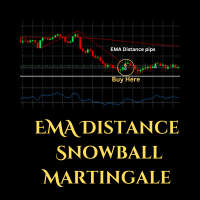
Expert Advisor (EA) that utilizes the basic EMA Distance strategy along with RSI for take profit, and employs support and resistance levels from the Zigzag indicator as stop-loss and take-profit points, you can follow these guidelines: Dow Theory Strategy : This involves analyzing trends using the Dow Theory principles, mainly focusing on identifying primary trends (bullish or bearish) and secondary trends (corrections). You'll need to implement rules for identifying these trends based on price
FREE

Gatotkaca Support Resistance Trendline Indicator is a simple indicator that detects support, resistance and trendlines. It will helps you find breakout momentum based on lines calculated by this indicator. This is conceptually based on fractals, but with customizable periods. Compatible for any timeframes. You can customize how this indicator work by setting up the period input.
FREE

The Big Mac B MQL5 expert advisor is a based off a Bollinger breakout strategy. The MACD indicator is used to confirm either a buy or sell trend. The MFI indicator to act as a trading range to ensure that the buy or sell is not activated when the price is in an overbought or oversold condition.
Trades will only be entered if the current price is within the trading range of the MFI indicator. Default settings are for the USDJPY on the 5 minute time-frame.
To work with the news server, you must
FREE
GoDaekSun 是根據信號產生器做出交易決定後再根據現有的資金量調整下單的單量 設計目的希望所有參與交易的交易者,都能夠獲取合理的利潤
值得注意的是,過去的歷史回測匯或許會有相當大的利潤發生.但是將來的行情型態是不可知的.所以不要盲目地相信EA會創造出絕對的利潤,但也不要一昧地認為自動交易就是不可取的
特點
自適應的交易信號: 根據市場狀況自動調節信號產生的條件 簡單的設定方式: 只需簡單的設定即可. 單品種交易: 根據信號產生器做EURUSD單品種的交易 無華麗顯示面板: 將算力完全用在交易程序的計算 可以更高效續的執行工作 長期交易策略: 穩定的市場狀態時才會執行開單平倉 安全的風險控制: 在當前行情不例於持倉狀況時安全認損 不會早造成爆倉或是大量虧損
環境
使用時間框 M15 交易品種 EURUSD (品種必須列在報價清單上) 啟動資金使用1500美金即可運行 免費版只能交易EURUSD 正式版可以交易多品種 購買或是測試可以聯繫我取得適當的參數
運行淨值保持在2500美金以上 能更加確保交易帳戶的安全
參數
Magic :
FREE

입력 신호 평균 필터가 있는 추세 추적 표시기
이 지표는 이동 평균을 진입 신호로 사용하여 추세 추적기 및 필터 역할을 합니다. 이동 평균은 다양한 추세 범위를 결정하는 데 중요합니다.
- 표준 200일 1차 평균은 장기 추세를 나타냅니다. - 50일 2차 평균은 중기 추세를 나타냅니다. - 20일 3차 평균은 가장 짧은 추세를 나타냅니다. - 9개 기간 평균은 즉각적인 조치를 위한 진입 트리거 역할을 합니다.
이 지표는 시장 동향에 대한 정확하고 포괄적인 분석을 제공하고 신중하게 선택된 이동 평균을 기반으로 적시에 진입점을 식별하는 거래자에게 유용한 도구입니다.
진입 신호 평균 필터가 포함된 추세 추적 지표를 사용하여 거래 전략을 강화하고 더 많은 정보에 입각한 결정을 내리세요. 지금 다운로드하여 거래 결과를 높이세요!
FREE

Что такое Awesome Oscillator? Создателем данного индикатора является Билл Вильямс. Этот трейдер разработал собственную торговую систему. Её основой служит постулат: «Рынок движется хаотично. Какие-либо закономерности этого движения вывести довольно сложно, так как многое зависит от психологических факторов.» Поэтому Вильямс разработал собственные инструменты для анализа рынка.
Одним из таких инструментов и является индикатор АО. Это осциллятор, который дает возможность выявить силу текущего
FREE

Trend Panel은 사용자가 선택한 10개 쌍을 사용하여 시간 프레임 M1 - D1의 확인된 추세 방향을 표시하는 간단하고 편리한 도구입니다.
이 표시기는 모든 전략/템플릿에 방향 확인을 추가한 다음 차트를 다른 쌍 또는 기간으로 빠르게 변경하기 위한 깨끗한 대화식 인터페이스로 작동하도록 설계되었습니다. 그룹채팅 : https://www.mql5.com/en/users/conorstephenson
구매 후 설정 조언과 무료 전문가 고문을 위해 저에게 연락하십시오! 내 제품은 MQL5에서만 판매되는 제품입니다 . 다른 곳에서 이 제품을 본다면 모조품입니다. 속지 마세요. 주요 특징들 차트 패널을 정리하면 시간 프레임의 추세 방향을 빠르게 결정할 수 있습니다. 대화형 기능. 차트에 있는 양초의 색상을 변경합니다. 현재 및 과거 추세를 쉽게 볼 수 있습니다. 페어 및 타임프레임 버튼은 클릭 시 작동하여 현재 열려 있는 차트를 변경합니다. 템플릿 설정에 가장 적합한 위치로 차트
FREE

Volume Projection Indicator The Volume Projection Indicator is a specialized tool designed for traders who focus on the relationship between volume and price action. This intuitive indicator projects the expected volume for the ongoing candle, aiding in decision-making during live market conditions. The indicator presents volume data in a histogram format directly on the chart for quick analysis. Features: Bullish Volume Representation : Each green bar in the histogram signifies the volume for a
FREE

Higher Timeframe Chart Overlay will display higher timeframe candles, including the number of candles high/low you specify.
You no longer need to switch timeframes to check the candles. Everything can be shown in one chart. Get Full Version - https://www.mql5.com/en/market/product/115682 Please feel free Contact me if you have any questions regarding this tool.
FREE

DONCHIAN CHANNEL DC It is a trend indicator developed by “Richard Donchian”, consisting of 3 layers, the upper channel, the lower channel and the middle channel. It is created on the Donchian Channel by plotting the highest and lowest prices reached in the past period on the price chart. It is also used to measure the volatility of the market, as it is an expanding/contracting channel according to the increase/decrease of price volatility. Method 0; Donchian channel indicator drawing. BUY/SELL S
FREE
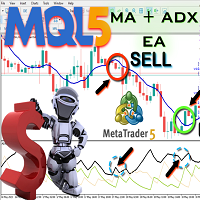
This MA ADX Market analyzer Expert Advisor is an advanced EA that continuously scans the market and finds the best trading opportunities for the trader. It uses a combination of Moving Average (MA) and ADX indicators to generate the trading signals. It is a fully automated EA that sends buy and sell orders to the market so that the trader does not have to be at the computer interface each time and gives his or her time to do his own activities. This is a free EA that you can download Straight A
FREE

Description des paramètres :
Doushoku samourai est un robot trading adapté pour du trading semi-automatisé. Il utilise une moyenne mobile pour déterminer les ordres qu'il doit passer. Si le prix actuel est au-dessus de la moyenne mobile, il achète. Si le prix actuel est en-dessous de la moyenne mobile, il vend. Le calcul du take-profit (ou target) est déterminée en points (0.1 PIP).
Il est le résultat de la différence entre un prix choisi nb bougies dans le passé et le prix de la dernière b
FREE

Volume Weighted Average Price or VWAP is an indicator wich shows different average prices on chart. This is very useful to find strong negotiation price areas and as trend following.
Configurations: Day, Week and Month - Show different VWAPs according to the period. You can change each line style on "colors" tab.
Any doubt or suggestion please contact us. Enjoy! This is a free indicator, but it took hours to develop. If you want to pay me a coffee, I appreciate a lot <3 PayPal, Skrill, Ne
FREE

Overlay indicator on chart between 2 pairs
The Timeframe Overlay indicator displays the price action of timeframes on a single chart, allowing you to quickly assess different timeframes from a single chart. The advantage is to observe and follow the correlations of price movements in real time to help you find potential trades at a glance.
---- Symbol 1 ----
Symbol = EURUSD
Correlation Inverse = false
Display = true
Ratio
FREE

This indicator is especially for the binary trading. Time frame is 1 minutes and exp time 5 or 3 minutes only. You must be use martingale 3 step. So you must put lots size is 10 % at most. You should use Mt2 trading platform to connect with my indicator to get more signal without human working. This indicator wining rate is over 80% but you may get 100% of profit by using martingale 3 step. You should use MT2 Trading Platform to connect meta trader platform and binary platform . You can get mt2
FREE

I present the well-known Moving Average indicator.
This indicator is presented as a channel, where the upper and lower lines are equidistant from the main line by a percentage set by the user.
The indicator is easy to use. The basic settings of the moving average have been saved and a percentage parameter (Channel%) has been added.
Basic parameters:
Channel% - shows how much we want to deviate from the main line.
The indicator is freely available.
FREE
무역 시스템 거래 당일 바를 선택하면 이 바가 닫히면 로봇이 양초의 저점에서 높은 가격으로 두 주문을 보내고 다른 하나는 취소됩니다. 손절매 스탑은 매수의 경우 저점 아래 1틱, 매도의 경우 고점 위 1틱입니다. 테이크프로핏 stopLoss의 범위 중 원하는 만큼 테이크를 설정할 수 있으며, 전략 최적화에서 의상화할 수 있습니다. 최적화 이 로봇에는 위험 수익을 얻을 수 있는 입력이 있으므로 거래하려는 기호에 대한 최상의 입력을 얻기 위해 메타트레이드의 전략 최적화에서 실행할 수 있습니다. muyeog siseutem geolae dang-il baleul seontaeghamyeon i baga dadhimyeon lobos-i yangchoui jeojeom-eseo nop-eun gagyeog-eulo du jumun-eul bonaego daleun hananeun chwisodoebnida. sonjeolmae seutab-eun maesuui gyeong-u jeojeom
FREE

A pin bar pattern consists of one price bar, typically a candlestick price bar, which represents a sharp reversal and rejection of price. The pin bar reversal as it is sometimes called, is defined by a long tail, the tail is also referred to as a “shadow” or “wick”. The area between the open and close of the pin bar is called its “real body”, and pin bars generally have small real bodies in comparison to their long tails.
The tail of the pin bar shows the area of price that was rejected, and
FREE

Baby WPR opera automáticamente en base al algoritmo oscilador WPR. Es capaz de llegar a generar resultados alcistas en las pruebas realizadas con el par de FX GBPUSD en el marco temporal H1 Se puede testear en otros instrumentos ajustando sus diversas opciones. Diseñado para operar con un capital mínimo de 100 USD y un apalancamiento de 1:30 Ideal para los iniciados. Con Baby WPR no esperes grandes beneficios con la configuración conservadora por defecto, por el contrario habrán DD significativo
FREE

The indicator draws daily support and resistance lines on the chart, as well as the Pivot level (reversal level).
Adapted to work in MT5
The standard timeframe for calculating support and resistance levels is D1. You can choose other timeframes according to your strategy (for example, for M1-M15, the optimal timeframe for calculations is H1)
The function for calculating support and resistance levels has been updated; in this calculation option, fibonacci levels are taken into account, res
FREE
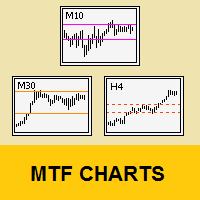
Tool that allows viewing more than one timetime in the same window (up to 3 timeframes). Then, the tool helps the analysis in multiple timesframes.
This is another product developed by Renato Fiche Junior and available to all MetaTrader 5 users!
Input Parameters
- Timeframes 1, 2 and 3: Timeframes of sub-charts
- Show Dates: Shows the dates on the sub-charts on the X-axis (Yes / No)
- Show Prices: Shows on the Y-axis the prices in the sub-charts (Yes / No)
- Show Subwindow: Sh
FREE

Keltner-Enhanced improves the accuracy and readability of Keltner Channels with many options for adjusting them and more five price calculations beyond the META default.
The Keltner-E indicator is a banded indicator similar to Bollinger Bands and Moving Average Envelopes. They consist of an upper envelope above a midline and a lower envelope below the midline.
The main occurrences to look out for when using Keltner Channels are breakouts above the Upper Envelope or below the Lower Envelope
FREE

This is my version of the famous VWAP indicator.
Channel Group: Click Here
You get: - Default VWAP Line - First and second deviation zones - Previous day levels Very simple to use, one of the best tools for day trading. Can be used on any TF and on any symbol. Don't use for entries, use as a trend filter. Add supporting indicators
I would recommend to use the indicator on either 15M or 5M chart.
FREE
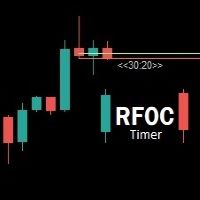
Uma informação de grande valor para o trader se localizar no tempo é a informação de quanto tempo temos para o encerramento do candle atual ou quanto falta para a formação de um novo candle. O RFOC Timer apresenta esta informação de forma clara e alocada à direita do candle atual. Adicionalmente o RFOC Timer acompanha a opção de inclusão das linhas de preços ASK e BID com e sem extensão a direita e/ou esquerda. Esta função auxilia, por exemplo, a não sobreposição das linhas de ASK e BID com as
FREE

Seeing and interpreting a sequence of Candlesticks is easy to spot when you are a human... Higher Highs, Higher Lows, are the panorama of a Buying trend, at least in a short period of time... Seeing a current candlestick higher high and a lower candlestick low, as a human, you can immediately spot a "divergence", an "alert", a "starting range", but in the end and based on other analysis a human trader can understand and behave accordingly to this kind of candlestick data... But what about EAs (r
FREE

The EU_15_111517128_S_Op_CF_SQ3 is an algorithmic trading strategy for MetaTrader, tested on EURUSD using the M15 timeframe from April 1, 2004, to April 24, 2024. There is no need to set up parameters, all settings are already optimized and fine-tuned.
Recommended broker RoboForex because of EET timezone.
You can find the strategy source code for StrategyQuant at the link: http://quantmonitor.net/listing/eurusd-bollinger-bands-breaker/
Key details are:
Main Chart: Current symbol and
FREE

이동 평균 및 RSI EA
Forex 시장에서 최적의 거래 성과를 위해 기술적 분석의 힘을 활용하도록 설계된 최고의 거래 동반자인 이동 평균 및 RSI EA를 소개합니다.
주요 특징들:
이중 이동 평균 교차: EA는 두 가지 이동 평균을 활용하여 시장 동향을 파악하고 매수 또는 매도 신호를 생성합니다. 이러한 이동 평균의 교차는 잠재적인 시장 방향 변화에 대한 강력한 지표를 제공합니다.
RSI 확인: 신호 정확도를 높이기 위해 EA는 30과 70의 임계 수준인 상대 강도 지수(RSI)를 통합합니다. 이를 통해 EA는 시장 상황을 확인하고 과매수 및 과매도 상황을 식별하여 확률이 높은 거래를 보장할 수 있습니다.
동적 로트 크기 관리: EA에는 다양한 거래 스타일과 위험 선호도에 맞는 다양한 로트 크기 모드가 포함되어 있습니다. 동적 로트 크기 모드에서 EA는 계정 잔액을 기반으로 로트 크기를 지능적으로 계산하여 최적의 위험 관리를 보장하고 수익 잠재력을
FREE

Candle High Low
Indicator showing High and Low of X candles across a line.
Settings Candle number for calculation (>= 1 ) - Define the number of candles for the indicator to find the maximum and minimum of that period of candles. Continuation of the line's display to the right - If you want the High and Low line to extend to the right edge of the graph Line High Color - Set line color Line High Style - Set line style Line Low Color - Set line color Line Low Style - Set line style
FREE

모멘텀 반전은 가격 변동 및 바 형성의 강도 분석을 기반으로 가능한 반전 포인트 및 보정의 시작을 감지하기위한 강력한 도구입니다.
_________________________________
지시자 신호를 이용하는 방법:
표시기는 새로운 가격 표시 줄이 나타난 후 신호를 생성합니다. 가격이 지정된 방향으로 임계점을 돌파한 후 생성된 신호를 사용하는 것이 좋습니다. 표시기는 신호를 다시 그리지 않습니다.
_________________________________
표시기 매개 변수는 신호 화살표의 표시 스타일을 변경하는 것이 좋습니다. 계산에 사용되는 매개 변수를 변경하는 것은 제공되지 않습니다-이 내 제품의 철학 때문이다:안정성과 객관성.
_________________________________
귀하의 질문 및 제안을 환영하며 비공개 메시지로 보낼 수 있습니다
_________________________________
시장을 정복에 관심있는 모
FREE

멀티 에셋, 멀티 전략 및 다중 언어 : Edgeweasel Pro 는 주요 화폐 쌍, 지수 및 상품을 포함하여 최대 20개의 금융 도구를 동시에 스캔할 수 있는 멀티 에셋 도구입니다. 이 어드바이저는 Forex, 지수 및 상품에 맞춤형 전략을 제공하는 멀티 전략 기능을 통합합니다. 이 전략들은 극단적인 움직임 이후의 가격 조정을 활용하려고 합니다. 글로벌 사용자 기반을 지원하기 위해, 어드바이저는 영어, 러시아어, 중국어, 스페인어, 포르투갈어(브라질), 독일어를 포함한 다양한 언어를 지원합니다. 그리드 또는 마틴게일 전략에 의존하지 않고 유리한 조건에서 로트 크기를 전략적으로 증가시키는 내장 손실 회복 메커니즘을 특징으로 합니다. 광범위한 테스팅을 통해, 단순한 1:x 위험 대 수익 비율이 일관되게 최상의 결과를 제공한다는 것을 발견했습니다. 보정: 다수의 파라미터를 가진 전략을 개발하는 것은 특히 역사적 데이터에 맞게 최적화할 때 과적합을 초래할 수 있습니다. 이를 완화하기
FREE

The NQ_H4_820422556_S_BB_CF_SQX is an algorithmic trading strategy for MetaTrader, tested on NQ using the H4 timeframe from December 7, 2017, to June 2, 2023. There is no need to set up parameters, all settings are already optimized and fine-tuned.
Recommended broker RoboForex because of EET timezone.
You can find the strategy source code for StrategyQuant at the link: http://quantmonitor.net/listing/nasdaq-trend-catcher/
Key details are:
MagicNumber: 820422556 Main Chart: Current
FREE

Auto Levels is a technical analysis indicator designed to automatically identify and draw support and resistance levels on price charts. The robot is capable of automatically identifying support and resistance levels based on historical price patterns, eliminating the need for manual analysis. You can set the maximum number of lines that the indicator plots as a parameter
FREE

This EA uses the MACD Crossover Strategy. Entries opened when the signal and MACD line cross each other. The Buy position entered only when the cross is below the zero line while the Sell position entered above the zero line. The Moving Average Convergence/Divergence (MACD) is an oscillator that combines two exponential moving averages (EMA)—the 26-period and the 12-period—to indicate the momentum of a bullish or bearish trend. MACD can be used to signal opportunities to enter and exit positions
FREE

The standard Fractals Bill Williams indicator with the ability to specify the number of candles for formation. The indicator works on all charts and timeframes.
Settings: candles - the number of candles to the left and right on the basis of which the fractal is built (in the classic indicator this value is always 2)
Contact: If you have any questions or need assistance, please contact me via direct message. Author: Fertikov Serhii, More of my indicators, advisors, scripts are available i
FREE

Shows the agression balance (buy agression deals - sell agression deals) in a histogram. The agression is calculated on every tick of a given candle and is the sum of volume of all the market buys minus all of the market sell trades. If the ticker does not have real volume, tick volume is used insted;
Very useful to determine if a given candle is dominated by bulls or bears
It is necessary for the data provider to have a list of trades (times & sales) as well as the agressor (buy/sell) d
FREE

Mostra a média móvel quando ADX > 20 e pinta de verde ou vermelho quando os valores de ADX estão subindo indicando tendência. Quando o ADX é menor que 20 indica movimento lateral consolidado. O indicador não define pontos de entrada, somente mostra a média colorida quando a tendência está se fortalecendo. Faz parte do grupo de indicadores do Indicador Tavim.
FREE

Monte Carlo simulation is an Indicator that uses a Monte Carlo model to calculate the probability of the price going up or down. If the price has a probability of going up or down more than 90%, the system will enter a trade by doing a back test of gold assets. It was found that it was able to generate a return of more than 20% in a period of 5 months while having a MAX DD of less than 7%.
What is a Monte Carlo simulation?
A Monte Carlo simulation is a model used to predict the probability o
FREE

VWAP RSJ is an indicator that plots the Hourly, Daily, Weekly and Monthly VWAP Lines.
Large institutional buyers and mutual funds use the VWAP ratio to help move into or out of stocks with as small of a market impact as possible. Therefore, when possible, institutions will try to buy below the VWAP, or sell above it. This way their actions push the price back toward the average, instead of away from it. Based on this information I developed this indicator that combines 4 types of VWAP T
FREE
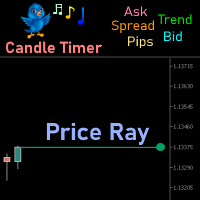
Price Ray indicator is a utility that will improve the way you trade. Primarily, it shows the Bid, Ask or Last price as a line ray which beams till the current candle, last visible chart candle or extended to all candle bars. The enhanced features in this indicator provide information in an area where you focus most, right next to the current candle. You can select text to be shown above or below the Price ray. The indicator is fully customizable, allowing it to fit any strategy requirements. Th
FREE
To access the MT4 version of this EA you can contact via private message. Also you can contact for further modifications. strategy description: - Detect underlying trend using the BxTrender indicator in daily time frame. - Trigger entry using supertrend indicator in M15 time frame. - Also use supertrend indicator to set SL and TP accordingly. EA setup - Nasdaq and other indices(like DAX40) are suggested to be traded. - Risk per trade is hard coded to 0.5%. - Risk:Reward ratio is hard coded to 1:
FREE

The currency strength momentum has a lot of similarities with currency strength meter presented in the previous page, but the difference are much more pronounced. You can try putting both in the same chart and see the difference in results. Currency strength momentum measures strength of a currency based on (you guess it) it's momentum relative to other currencies, while currency strength meter measures the strength of a currency based on pips it has moved in a certain direction.
FREE

XE Forex Strengh Indicator MT5 displays visual information about direction and strength of a signal for current pair and chosen timeframes (M5, M15, M30 and H1). Calculations are based on multiple factors and results are shown as a colored panel with scale bar, numerical values and arrows. There are also displayed values of current price and spread on the pair. There can be activated an alert (as a mail or pop-up window with sound) for each available timeframes which send a message when the dir
FREE

I think you all know Donchian Channels. so I am not going to write about it.
With this indicator I tried to create Donchian Trend Ribbon by using Donchian Channels.
How it works ?
- it calculates main trend direction by using the length that is user-defined. so you can change it as you wish
- then it calculates trend direction for each 9 lower lengths. if you set the length = 20 then the lengths are 19, 18,...11
- and it checks if the trend directions that came from lower lengths i
FREE

QuantumAlert CCI Navigator is a free indicator available for MT4/MT5 platforms, its work is to provide "alerts" when the market is inside "overbought and oversold" regions in the form of "buy or sell" signals. This indicator comes with many customization options mentioned in the parameter section below, user can customise these parameters as needful. Join our MQL5 group , where we share important news and updates. You are also welcome to join our private channel as well, contact me for the pri
FREE

The DD_ATR MT5 indicator is a trading tool developed by the Dagangduit Core Team . This indicator is designed to calculate and display the Average True Range (ATR) in real-time, providing traders with essential volatility information to aid in their trading decisions. Key Features: ATR Calculation : Calculates and displays the ATR for the selected timeframe. Multiple Timeframes : Displays ATR values for multiple timeframes (M1, M2, M3), giving traders a comprehensive view of market volatility.
FREE

This panel displays the price percentage change
Shows the percentage change in price from the last open: Daily, Weekly and Monthly timeframes. Numbers are easier to use than histogram currency meters. Line up the three timeframes strengths/weaknesses for strong trends. Compare currencies strongest against weakest. USD is the world's reserve currency to compare against.
How to use 1. Match the strongest currency with weakest currency; or 2. Match the strongest or weakest currency against US
FREE

This indicator is very useful in observing the direction of the market. It allows users to enter multiple MA lines with specific display method. In addition, it is also possible to change the candle color same to color of the background of chart, so that we only focus on the MA lines. When a signal appears, represented by a red or green dot, we can consider opening a sell (red dot) or buy (green dot) order. Note: it need to set stoploss at the highest value of MA lines (with sell order) or lowe
FREE

ClickDrag는 차트에서 선을 그리고 개체를 쉽게 이동합니다.
클릭한 다음 드래그하여 추세선 그리기를 시작합니다.
마우스를 수평으로 움직이면 가격선이 그려집니다.
마우스를 세로로 움직이면 날짜선이 그려집니다.
기존 선과 개체는 클릭&드래그로 이동할 수 있습니다.
시작 지점과 종료 지점 사이의 가격 및 시간 차이를 표시합니다.
클릭&드래그를 시작한 후,
색상을 변경하려면 좌우로 흔듭니다.
위아래로 흔들어 삭제합니다.
- 클릭앤드래그란?
1. 마우스 왼쪽 버튼을 누릅니다(누르기).
2. 마우스 왼쪽 버튼에서 손을 뗍니다(떼기).
3. 마우스 왼쪽 버튼 누르기(길게 누르기)
4. 마우스를 누른 상태에서 이동(드래그)
이 움직임을 사용하면 추세선을 그리고 개체를 이동하고 색상을 변경하고 지울 수 있습니다.
화살표, 가격 개체, 피보나치, 자이언 선, 순환 선 및 모양도 이동할 수 있습니다.
FREE

Swiss VWAPsimple Motivation Did not find free VWAP that works, the one that I found craseh. So I created a VWAP which calculates values only for the actual day. So computer resouces are not over stressed.
What is VWAP, how is it used? VWAP stands for Volume Weighed Average Price, it calculates the running sum of tick volume and the runnung sum of price times tickvolume. The division of these sums result in a weighed price (Sum P*V/Sum V). The calculation starts normally at midnight. The value
FREE

Индикатор PivotPointSuperTrend отлично показывает данные Тренд на основе мат данных от Pivot и ATR и очень удобен для входа в сделку и выставления стопов. Если кто то сможет добавить в код мултитаймфрем, я и многие пользователи будут очень Благодарны, то есть чтобы ондикатор показывал значение старшего таймафрема на графике младшего таймфрема, Заранее Спасибо!
FREE

This is an extension indicator that allows the user to select any second time-frame from 1 to 60 second without any multiplier limitaion (ex, 7 seconds, 13 seconds ... are all allowed).
There is only one input called Interval that allows you to set the seconds timeframe you want given is in the range above. You can use indicators on that new time frame with no problems and also build your EAs based on any second timeframe. I hope this is useful, please let me know any bugs you find!
Note: Sin
FREE

AliPivot Points is a Meta Trader 5 Indicator that draws you the latest pivot points. You can choose from timeframes ranging from 1 Minute to 1 Month. Calculation methods for pivot points includes: Classic Pivot Points Camarilla Pivot Points Fibonacci Pivot Points Woodie Pivot Points You can personalize the line colors, style, and width to suit your preference. The indicator displays values on the right side of the chart. AliPivot Points values can also be utilized by developers for creating Expe
FREE

The Expert Advisor for this Indicator can be found here: https://www.mql5.com/en/market/product/115564 The Contraction/Expansion Breakout Indicator for MetaTrader 5 (MT5) is a powerful tool designed to identify and signal the breakout of bullish and bearish contraction or expansion formations in financial markets. Utilizing advanced algorithmic calculations, this indicator helps traders spot significant price movements that often accompany these formations, providing valuable insights for stra
FREE

Provlepsis 지표에 오신 것을 환영합니다.
"Provlepsis"는 MQL 마켓을 위해 개발된 고급 지표입니다. 같은 시간대의 이전 바를 분석하여 시장 움직임의 잠재적 범위를 정확하게 계산하여 향후 가격 변동에 대한 소중한 통찰력을 제공합니다. 전통적인 ATR 지표와 달리 "Provlepsis"는 시간 요소를 고려하여 다양한 시장 조건에 적응하는 더 강력한 도구입니다. 밤에는 좁은 범위를 예측하고 활발한 거래 시간대에는 더 넓은 범위를 예측합니다. "Provlepsis"가 제공하는 포괄적인 범위 분석으로 거래 전략에서 경쟁 우위를 확보하세요. 여기에서 Provlepsis 지표의 길이와 시프트를 변경할 수 있는 전체 버전을 확인할 수 있습니다!
https://www.mql5.com/ko/market/product/98802
프로블렙시스 사용의 이유
범위 기반 트레이딩: 이 지표는 시장 움직임의 잠재적 범위를 식별하는 능력으로 범위 기반 트레이딩 전략에 가치를 제공할
FREE

BreakdownX — это передовой торговый робот для MT5. Он использует стратегию определения уровней поддержки и сопротивления, чтобы выявлять оптимальные точки входа и выхода на рынке. Особенности: Автоматизированная Стратегия Определения Уровней : Наш советник анализирует рынок, используя [заданное число] последних свечей, чтобы точно определить уровни поддержки и сопротивления. Динамический Расчет Размера Позиции : Встроенный механизм оптимизации размера лота на основе текущего баланса и уровня рис
FREE
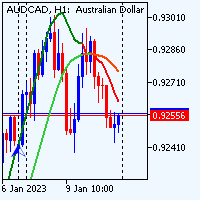
Test Before Use... In the forex market, a range refers to a period of time during which the price of a currency pair remains relatively stable, fluctuating within a narrow band. This can be contrasted with a trend, which refers to a sustained movement in the price of a currency pair in a particular direction. During a range, the price of the currency pair may move up and down within a defined range, but it is not trending strongly in any particular direction. This can be a good time for the rang
FREE

AlphaTrader Pro 전문가 고문
개요:
AlphaTrader Pro는 금융 시장에서 10년 이상의 경험을 보유한 팀이 꼼꼼하게 제작한 정교한 전문 자문입니다. 우리는 즉각적인 부에 대한 비현실적인 주장을 하지 않지만, 거래자가 정보에 입각한 결정을 내리는 데 도움이 되도록 설계된 신뢰할 수 있는 도구를 제시합니다.
주요 특징들:
전략적 접근 방식: AlphaTrader Pro는 노련한 팀의 전문 지식과 고급 지표의 힘을 결합하여 거래에 대한 전략적 접근 방식을 사용합니다.
다중 지표 분석: EA는 다양한 지표를 활용하여 시장 상황을 종합적으로 분석합니다. 이 다중 지표 접근 방식은 보다 강력하고 정확한 거래 신호를 제공하는 것을 목표로 합니다.
EURUSD 및 GBPUSD 초점: AlphaTrader Pro는 EURUSD 및 GBPUSD 통화 쌍 거래에 최적화되어 있으며 이러한 시장의 고유한 특성에 맞는 전문 전략을 제공합니다.
위험 관리: EA는
FREE
The Indicator tendency trader EA can trade with 12 top indicators. The following indicators are integrated: 1 Adaptive Moving Average 2 Average Directional Movement Index 3 Bollinger Bands 4 Double Exponential Moving Average 5 Envelopes 6 Fractal Adaptive Moving Average 7 Ichimoku Kinko Hyo 8 Moving Average 9 Parabolic SAR 10 Standard Deviation 11 Triple Exponential Moving Average 12 Variable Index Dynamic Average. All standard indicators trade with simple strategies that are understandable for
FREE
SignalDeMarker - stable in its work automatic adviser. The algorithm of the adviser's work is based on the definition of overbought / oversold market zones, built on the basis of an assessment of the current demand and the level of risk. The indicator is installed in the usual way, on a chart with a time period of D1 and works with any trading instrument. Options Expert_MagicNumber = 1234 - magic number
Signal_StopLevel = 50.0 - level of stop-loss (in points)
Signal_TakeLevel = 50.0 - Level
FREE

The indicator displays the size of the spread for the current instrument on the chart. Very flexible in settings. It is possible to set the maximum value of the spread, upon exceeding which, the color of the spread label will change, and a signal will sound (if enabled in the settings). The indicator will be very convenient for people who trade on the news. You will never enter a trade with a large spread, as the indicator will notify you of this both visually and soundly. Input parameters: Aler
FREE

Relative Volume or RVOL is an indicator that averages the volume of X amount of days, making it easy to compare sessions volumes.
The histogram only has 3 colors:
Green - Above average volume
Yellow - Average volume
Red - Below average volume
The default setting is 20 days, which corresponds more or less to a month of trading.
In this version is possible to choose between tick and real volumes (if you are using a broker which offers future contracts)
With the data obtaine
FREE
MetaTrader 플랫폼 어플리케이션 스토어에서 MetaTrader 마켓에서 트레이딩 로봇을 구매하는 방법에 대해 알아 보십시오.
MQL5.community 결제 시스템은 페이팔, 은행 카드 및 인기 결제 시스템을 통한 거래를 지원합니다. 더 나은 고객 경험을 위해 구입하시기 전에 거래 로봇을 테스트하시는 것을 권장합니다.
트레이딩 기회를 놓치고 있어요:
- 무료 트레이딩 앱
- 복사용 8,000 이상의 시그널
- 금융 시장 개척을 위한 경제 뉴스
등록
로그인
계정이 없으시면, 가입하십시오
MQL5.com 웹사이트에 로그인을 하기 위해 쿠키를 허용하십시오.
브라우저에서 필요한 설정을 활성화하시지 않으면, 로그인할 수 없습니다.