MetaTrader 5용 무료 Expert Advisor 및 지표 - 14

The indicator allows you to simplify the interpretation of signals produced by the classical ADX indicator.
The position of the hight bars of the histogram relative to zero and the histogram coloring indicate the direction of price movement determined by the intersection of DI+ / DI-.
The position of the hight bars of the histogram relative to zero and the color indicate the strength of the price movement.
The indicator is a logical continuation of the series of indicators using this class
FREE

The utility draws pivot levels based on a selection from day week month The previous candlestick of the selected timeframe is taken and the values for the levels are calculated using the following formulas:
Pivot = (high + close + low) / 3 R1 = ( 2 * Pivot) - low S1 = ( 2 * Pivot) - high R2 = Pivot + (R1 -S1) R3 = high + ( 2 * (Pivot - low)) S2 = Pivot - (R1 - S1) S3 = low - ( 2 * (high - Pivot));
The style and thickness for all lines are adjusted.
The colors for the R, Pivot and S line
FREE

Daily pivot are relatively important in trading.
This indicator have options to select 5 commonly use pivot point calculations.
User input Choose Pivot Point Calculation (Method Classic, Method Camarilla, Method TomDeMark, Method Fibonacci or Method Woodies.) Choose Applied Timeframe for the calculation (M5, M15, H1, H4, D1, W1 etc) Can be attached to any timeframe Choose color of Pivot point Note:
For MT4, please refer here : https://www.mql5.com/en/market/product/22280
FREE
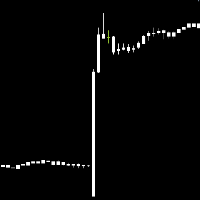
Have you ever seen Long candle sticks, quick price movements on the chart and feel like you missed out on a good trade. You can kiss that feeling goodbye with this Fundamental Expert. The ability to trade Economic events while asleep or watching Netflix or at work, has arrived. You will never miss out on big movements in forex trading with trading the news.
Why is the economic calendar important?
Economic indicators and events have the potential to significantly impact financial markets.
FREE

Session Average Date Range: Analyze and average the low - high of specific trading sessions within custom date ranges, offering insights into price movements and market behavior over selected periods. The "Session Average Date Range" tool is an advanced analytical utility designed to empower traders and analysts by allowing them to dissect and evaluate the volatility of specific trading sessions within a user-defined date range. This tool provides a flexible and precise approach to analyzing pri
FREE

Convenient drawing of parabolic channels by four points (two lower and two upper extremums). Additional control keys: N (New) - Start drawing a new channel. C (Clear) - Deletes the current channel. By default, the current channel is the last channel. But you can click on the line of any channel to make it current. Click on the gear in the upper right corner to set some parameters for all channels or the current channel. All work is visible from the animated Gif.
Do not forget to express your
FREE
This EA trades using the Stochastic Indicator. It offers many trading scenarios and flexible position management settings, plus many useful features like customizable trading sessions, a martingale and inverse martingale mode. [ Installation Guide | Update Guide | Troubleshooting | FAQ | All Products ] Easy to use and supervise It implements three different entry strategies Customizable break-even, SL, TP and trailing-stop Works for ECN/Non-ECN brokers Works for 2-3-4-5 digit symbols Trading can
FREE

Indicator IRush uses a modified version of a popular indicator RSI (Relative Strength Index) to look for entries on a daily chart or lower. The indicator has been set up and tested with the major symbols: AUDUSD, EURUSD, GBPUSD, USDCAD, USDCHF, and USDJPY. An automated trading with this indicator is implemented in the expert advisor Intraday Rush . This expert advisor can open, trail and close its trades. Check it out, it may be exactly what you are looking for!
A Correct Reading of IRush
Th
FREE
The RMI Scalper EA is a fully automated Expert Advisor that trades pullbacks from the major trend using RMI and limited averaging. The EA trades using market orders and uses averaging to safely turn otherwise negative trades positive. This EA works best on USDJPY, EURUSD, GBPUSD, USDCAD, USDCHF, AUDJPY, EURCAD, EURGBP and EURJPY using the M30 timeframe and has the option to trade multiple pairs but only one pair at any one time to increase trade frequency without increasing draw down.
Please no
FREE

1. The Expert Advisor built with a basic, simple and stable trading strategy that is highly effective and accurate with a sniper entry system with a good money management.. 2. The expert advisor works best as from 15 minutes time frame and above.... 3. The expert advisor work with all broker and all currency pair and synthetic indices... 4. Use a reasonable lot size and correct settings if you want to get the best of the Expert Advisor.. Note: To enjoy the full working ability of this Expert Adv
FREE

Expert capable of generating profit by opening positions randomly. Shows good results in long-term trading – on timeframes from H12.
Features Fully automatic mode is available. Positions are opened randomly. Martingale is applied – if the previous position closed with a loss, the current one is opened with a volume that compensates for that loss.
Parameters Mode – Expert's operating mode: Automatic – automated (recommended); Manual – manual. In automatic mode, the Expert does not require any
FREE
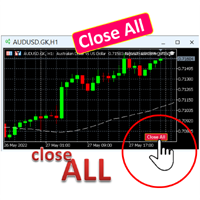
A simple button to completely close all existing open trades (both Buy and Sell) on the current chart .
Warning : Once the button is pressed, all open trades on the current chart will be deleted immediately without any more questions or dialogue.
Use this utility very carefully. We recommend that you do a trial of removing open trades on a demo account first, before trying to use this utility on a real account.
FREE

이 계정에서 무료 제품을 지원하세요. 이 링크를 사용하여 저희 추천 브로커 에 등록하세요.
진화된 트레이딩 솔루션 소개: 16개 이상의 전략을 갖춘 전문가 어드바이저 자동화된 거래의 잠재력을 발휘하기 위해, 우리는 16가지 이상의 수익성 있는 전략을 하나의 견고한 도구 안에 포함한 전문가 어드바이저(EA)를 자랑스럽게 소개합니다. 이 EA는 그리드(grid)나 마틴게일(martingale) 전략과 같은 위험한 전술을 사용하지 않으면서도 안전하고 신뢰할 수 있는 거래 경험을 제공합니다. 안전 우선: 이 EA의 디자인 철학의 기반은 안전성에 있습니다. 공격적인 거래 방식의 위험을 최소화하기 위해 그리드나 마틴게일 전략을 사용하지 않고 운영합니다. 더불어, 임베디드된 자본 보호자는 대규모의 손실을 방지하여 자산을 보호하는 중요한 기능을 합니다. 맞춤형 유연성: 적응성의 중요성을 인식하며, 우리의 EA는 사용자 맞춤형 설정을 제공합니다. 이는 원하는대로 동시에 개방할 포지션 수나 거래
FREE

You may find this indicator helpfull if you are following a session based strategy. The bars are colored according to the sessions. Everything is customisable.
Settings: + Asia Session: zime, color, high, low + London Session: zime, color, high, low + US Session: zime, color, high, low
Please feel free to comment if you wish a feature and/or give a review. Thanks.
FREE

Highly configurable Bollinger Bands indicator. Features: Highly customizable alert functions (at levels, crosses, direction changes via email, push, sound, popup) Multi timeframe ability Color customization (at levels, crosses, direction changes) Linear interpolation option Works on strategy tester in multi timeframe mode (at weekend without ticks also) Parameters:
Bollinger Bands Timeframe: You can set the lower/higher timeframes for Bollinger Bands. Bollinger Bands Bar Shift: Y ou can set t
FREE

DailyBox2 is an advanced automated trading system designed based on trend-following and hedging strategies. This EA executes up to two trades per day and utilizes a smart recovery feature to minimize losses and maximize profits. Its risk management feature ensures safe trading by aligning with the user’s specified risk levels. When used in conjunction with IAMFX-Agent , it can achieve both risk management and profit maximization. Additionally, when used alongside our BandPulse , it can lead to
FREE

It makes it easier to see where there have been consolidation zones for previous prices and allows you to highlight the histogram where there is the biggest consolidation zone.
Input parameters Intervalo de preço Is the price between the histograms
Periodo Number of candle sticks to be analyzed
Porcentagem Highlights the histogram where there is minimal consolidation in relation to the analyzed period
FREE

The TrendFusion trading robot is designed to operate on the GBP/JPY currency pair. Optimized for an H4 (4-hour) trading timeframe, it offers a strategic approach for traders aiming to combine precision with adaptability in their trading. TrendFusion has demonstrated a high accuracy rate in past performance, making it a reliable choice for traders. Technical Indicators Used Bull and Bear Trend Analysis : TrendFusion analyzes both bullish and bearish trends to identify potential trading opportunit
FREE

Простой советник основанный на сигналах индикатора Relative Strength Index (RSI) в зоне перекупленности - продаем, в перепроданности - покупаем. Моя версия всем известного "Dynamic". Я рекомендую использовать этот советник в полуавтомате.
Добавляйтесь в друзья, присылайте свои интересные стратегии. Возможно после обсуждения всех нюансов напишу советника бесплатно . Параметры: "_Slippage" - Проскальзывание; "_
FREE

ПОСМОТРИТЕ НАШ НОВЫЙ СОВЕТНИК : : https://www.mql5.com/ru/market/product/95095?source=Unknown#description
Индикатор стрелочник идеален для торговли в боковике, очень точно показывает моменты перекупленности и перепроданности инструмента, с дополнительными фильтрами также можно использовать для торговли по тренду. На экран выводятся стрелки сигнализирующие о развороте тренда, направление стрелки показывает дальнейшее направление торговли, также имеется звуковое оповещение. После закрытия бар
FREE

Wyckoff fans, enjoy!
Ideally to be used with the Weis Waves indicator, but it can be easily used alone, the Waves Sizer puts the range (in resulting Price movement) done by the Price on its market swings. You can control how accurate or loose will be the swings. This tool is very helpful for visually know how much the Price has traveled in your Timeframe. This way you can confront this level of effort with the resulting Volume, etc... Weis Waves indicator:
https://www.mql5.com/en/market/pro
FREE

The Pirates MACD is a Momentum Indicator that shows us not just the Classical MACD, it also shows us high priority trades. the user has an option of selecting among several options the best settings that suits their trading style, even if one has no trading style, Pirates always find a way to survive hence the Pirates MACD is equipped with easy to understand tools. that reduce the strain on ones analysis giving them visual advantages over classical MACD techniques.
This product is made as an
FREE

The purpose of using Smart money index (SMI) or smart money flow index is to find out investors sentiment. The index was constructed by Don Hays and measures the market action. The indicator is based on intra-day price patterns. The beginning of the trading day is supposed to represent the trading by retail traders. The majority of retail traders overreact at the beginning of the trading day because of the overnight news and economic data. There is also a lot of buying on market orders and shor
FREE

The Fisher Transform is a technical indicator created by John F. Ehlers that converts prices into a Gaussian normal distribution. The indicator highlights when prices have moved to an extreme, based on recent prices. This may help in spotting turning points in the price of an asset. It also helps show the trend and isolate the price waves within a trend. The Fisher Transform is a technical indicator that normalizes asset prices, thus making turning points in price clearer. Takeaways Turning poi
FREE

OHLC Magnet adds the missing magnet points for Horizontal Lines and Price Labels. If you liked this utility, please rate, comment, and check out my other programs.
Instructions:
Simply drag one of the aforementioned objects to the desired Open, High, Low, or Close, within the Pixel Proximity, and OHLC Magnet will automatically attach the object to the exact price point you chose. Parameters:
Proximity (Pixels): The proximity, in pixels, to how close your mouse cursor must be to the Open/High/
FREE
Simple program to automatically close positions by profit or loss.
User can select "Total Profit" to close all positions at the same time, once the total profit or loss is reached.
User can select "Single Profit" to close one by one positions, once single profit or loss is reached. Notes: 1. The assistant will not open any position.
2. The assistant only provide market orders, so due maket volatility positions can suffer slippage.
FREE

The indicator shows the price or volume in milliseconds, great for identifying entry patterns by price or volume aggression, and fast scalping. Features Timeframe in milliseconds Price aggression oscillator Customizable screen The indicator can indicate entry movements, such as: Crossing with a high slope before the first 500 ticks of the chart Identifying wave patterns
The speed of the chart display will depend on your hardware, the lower the milliseconds the more it will require from the har
FREE

알고리즘은 Currency Power Meter 표시기의 아이디어를 기반으로 합니다. 이 버전에서 표시되는 값의 수는 무제한이며 코드가 더 간결하고 빠르며 현재 막대의 값은 표시기 버퍼를 통해 얻을 수 있습니다. 표시가 보여주는 것 : 얇은 밴드와 통화 앞의 위쪽 숫자는 지난 N시간 동안의 상대 강도 지수를 보여주고(N은 변수 '시간'의 매개변수에서 설정됨), 더 넓은 밴드는 일일 지수를 보여줍니다. 입력 매개변수에서 지정하는 이 통화를 사용하는 통화 쌍이 많을수록(중개인이 쌍에 대한 견적을 제공한다고 가정) 인덱스에 가중치가 더 많이 부여됩니다(그러나 "비주요" 또는 이국적인 통화 쌍에 주의할 수 있습니다. 전체 그림을 왜곡). 예를 들어 EURUSD만 지정하면 유로에 대한 상대 지수는 이 쌍만을 기준으로 계산되고 EURGBP를 추가하면 유로 지수는 두 쌍을 기반으로 계산되어 더 많은 가중치를 얻게 됩니다. 데이터 활용 방법 : 지수 값이 낮거나 높을수록 중요한 뉴스가 없을
FREE

En esta versión, las alertas están funcionando y en la versión que publicó, la zona muerta de atr era solo una zona muerta sin atr, por lo que también la convirtió en una zona muerta de atr.
Indicator input parameters input int Fast_MA = 20; // Period of the fast MACD moving average input int Slow_MA = 40; // Period of the slow MACD moving average input int BBPeriod=20; // Bollinger period input double BBDeviation=2.0; // Number of Bollinger deviations input int Sensetiv
FREE

Jackson Support and Resistance it a powerful advance support and resistance indicator which provide signal base on price action, it Design to make things easy for everyone to draw support and resistance. we believe most strategies are built with support and resistance as a foundation .Having support and resistance perfect can be a game change to you way of trading. It flexible to all instrument .don't forget to watch our video on how to us this indicator prefect and progressive.
FREE

Highly configurable Williams %R indicator. Features: Highly customizable alert functions (at levels, crosses, direction changes via email, push, sound, popup) Multi timeframe ability Color customization (at levels, crosses, direction changes) Linear interpolation and histogram mode options Works on strategy tester in multi timeframe mode (at weekend without ticks also) Adjustable Levels Parameters:
Williams %R Timeframe: You can set the current or a higher timeframes for Williams %R. Williams
FREE

Investment Castle Support and Resistance Indicator has the following features: 1. Dictates the direction of Buy or Sell trades based on Support and Resistance Levels automatically . 2. Candles stick colors will change to Red for Sell and Blue for Buy (Default settings, user can change from the inputs). 3. This indicator is built-in the Support & Resistance based Investment Castle EA which works with Psychological Key Levels "Support & Resistance".
FREE

Velas Multi Time Frame
Las velas multi time frame, también conocidas como "MTF candles" en inglés, son un indicador técnico que permite visualizar velas japonesas de un marco temporal diferente al marco temporal principal en el que estás operando. Este enfoque ofrece una perspectiva más amplia del comportamiento del precio, lo que resulta especialmente útil para los traders que emplean estrategias de acción del precio. A continuación, se detallan los conceptos clave relacionados con este indi
FREE

Trend Panel은 사용자가 선택한 10개 쌍을 사용하여 시간 프레임 M1 - D1의 확인된 추세 방향을 표시하는 간단하고 편리한 도구입니다.
이 표시기는 모든 전략/템플릿에 방향 확인을 추가한 다음 차트를 다른 쌍 또는 기간으로 빠르게 변경하기 위한 깨끗한 대화식 인터페이스로 작동하도록 설계되었습니다. 그룹채팅 : https://www.mql5.com/en/users/conorstephenson
구매 후 설정 조언과 무료 전문가 고문을 위해 저에게 연락하십시오! 내 제품은 MQL5에서만 판매되는 제품입니다 . 다른 곳에서 이 제품을 본다면 모조품입니다. 속지 마세요. 주요 특징들 차트 패널을 정리하면 시간 프레임의 추세 방향을 빠르게 결정할 수 있습니다. 대화형 기능. 차트에 있는 양초의 색상을 변경합니다. 현재 및 과거 추세를 쉽게 볼 수 있습니다. 페어 및 타임프레임 버튼은 클릭 시 작동하여 현재 열려 있는 차트를 변경합니다. 템플릿 설정에 가장 적합한 위치로 차트
FREE

King Trader EA is based on candlestick formation and trading time. King Trader EA's strategy to recognize the candle formation and position yourself approximately 5 minutes after the opening of the New York Stock Exchange. The positions that are in plus are accompanied by additional purchases and tight traillingstop! EA was tested in EURUSD, GBPUSD, USDCAD, USDJPY and XAUUSD H1 in the strategy tester and defaulted to these symbols. Please suggest your ideas in discussion. I will i
FREE

Defining Range ( DR ) and Implied Defining Range ( IDR ) indicator
New Pro version here :
https://www.mql5.com/en/market/product/91851?source=Site+Profile+Seller
Show DR and IDR ranges on the chart for Regular , Overnight and After Sessions
for more information how DR and IDR work and the high probability watch : https://www.youtube.com/@themas7er or https://twitter.com/IamMas7er
Remember to set set your chart TimeZone when you attach indicator to the chart under indicator set
FREE
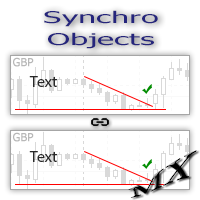
The SynchroObjects utility is designed to facilitate and speed up the work with graphic constructions on different charts of one symbol. The SynchroObjects utility clones the created objects to all charts on which the utility is running and which have the same symbol. And also synchronously changes their properties. The utility is easy to use and requires no configuration. Tip: If you view the history frequently - we also recommend you to also install the free Smart AutoScroll utility. It automa
FREE

The Williams Conditional Range (WCR) is a technical analysis indicator used to determine the oversold / overbought condition of the market by examining the position of the closing price in a given range formed by the extremes in the past and looking for divergences that indicate the likelihood of a reversal. It allows you to assess whether buyers or sellers have had a stronger influence on the price over a certain period of time, and to suggest further developments. The indicator is easy to inte
FREE

The technical indicator Wave Vision measures the relative strength of the trend movements of the price from its average values over a certain time period. The histogram shows price movement strenght relative to the zero level line. Histogram values close to zero indicate the equality of forces between buyers and sellers. Above the zero level line - bullish trend (positive values of the bar chart). Below the zero level line - bearish trend (negative values of the bar chart).
Settings:
Smoo
FREE

Mostra a média móvel quando ADX > 20 e pinta de verde ou vermelho quando os valores de ADX estão subindo indicando tendência. Quando o ADX é menor que 20 indica movimento lateral consolidado. O indicador não define pontos de entrada, somente mostra a média colorida quando a tendência está se fortalecendo. Faz parte do grupo de indicadores do Indicador Tavim.
FREE
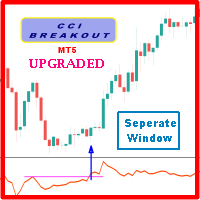
Probability emerges to record higher prices when Commodity Channel Index breaks out oscillator historical resistance level when exhibit overbought values. Since, oscillator breakout of support and resistance have similar effect as price breaks support and resistance levels, therefore, its highly advised to confirm price breakout with oscillator breakout; certainly, will have the same output in short trades. Concept is based on find swing levels which based on number of bars by each side of peak
FREE

Alert Indicator for exponential moving average cross blue arrow for buy alert , fast ema 14 crosses above 50 pink arrow for sell alert , fast ema 14 crosses below 50 Default 14 ema fast & 50 ema slow add these indicators to chart Full Alerts , push, email, phone inputs for moving average lengths and alarm on off settings Please contact for help of an indicator alert suggestion
FREE

XE Forex Strengh Indicator MT5 displays visual information about direction and strength of a signal for current pair and chosen timeframes (M5, M15, M30 and H1). Calculations are based on multiple factors and results are shown as a colored panel with scale bar, numerical values and arrows. There are also displayed values of current price and spread on the pair. There can be activated an alert (as a mail or pop-up window with sound) for each available timeframes which send a message when the dir
FREE

The Expert Advisor for this Indicator can be found here: https://www.mql5.com/en/market/product/115564 The Contraction/Expansion Breakout Indicator for MetaTrader 5 (MT5) is a powerful tool designed to identify and signal the breakout of bullish and bearish contraction or expansion formations in financial markets. Utilizing advanced algorithmic calculations, this indicator helps traders spot significant price movements that often accompany these formations, providing valuable insights for stra
FREE

Koala Trend Line Upgraded To Version 1.2 Last Upgrade Improvement : New Parameter Added that allow user to connect trend line to 2nd or 3th or Xth highest or lowest point.
My Request :
**Dear Customers Please Release Your Review On Koala Trend Line, And Let Me Improve By Your Feed Backs.
Join Koala Trading Solution Channel in mql5 community to find out the latest news about all koala products, join link is below : https://www.mql5.com/en/channels/koalatradingsolution
WHAT ABOUT OTHER
FREE
Indices Scalper EA provides functions: Start Trading, End Trading, Сlose Order(Time), Pending Order Placement (Time), Tralling stop (automatically according to strategy), trading can be switched off, daily range (strategy), stop loss per day (risk management), Stop loss (risk management), take profit (money management), tracking stop and tracking step (strategy), Risk per order (risk management) and much more! Through a newly developed stop system and with an algorithm never known before, Indic
FREE
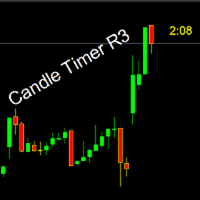
Timer remaining to finish the candle. A simple informative indicator of how much time is left until the current candle ends. In a simple, easy and objective way. In the input parameters, enter the desired color of the clock, the font size and the displacement to the right of the candle. I hope I helped with this useful and free tool. Make good use and good business.
FREE
This indicator monitors the vital constants of your trading account to keep it healthy and away from excessive risks. It monitors all trades, absolute exposure, account floating point and leverage currently in use, using different color codes for your interpretation. [ Installation Guide | Update Guide | Troubleshooting | FAQ | All Products ] Amazingly easy to understand The indicator is clean and simple It calculates exposure by pairs and currencies Keep your used leverage controlled at all t
FREE

In this indicator, Heiken Ashi candles are calculated with the most optimal method. You can also customize the results by adjusting the amount of period and method input. But the most important advantage of this indicator is the adjustment of the time frame value. You can use this to calculate the Heiken Ashi chandels to See in time frames with lottery in the lower time chart. In this case, you get the best signal to buy or sell using two or more Heiken Ashi indicators with different timeframes
FREE

(USDCHF,CADCHF,GBPCHF) 5MINUTES TIMEFRAME MIN 50$ ACCOUNT (EA IS IN LOW LEVEL RISK SETTING SO PROFIT WILL LOW.AFTER PURCHASE CONTACT OUR TEAM TO GET SETUP) Introducing "Grid Trend Reversal" Expert Advisor! Are you tired of manually analyzing market trends and waiting for the perfect moment to enter or exit tr
FREE

The indicator is designed for displaying the following price levels on the chart: Previous day's high and low. Previous week's high and low. Previous month's high and low. Each of the level types is customizable. In the indicator settings, you set line style, line color, enable or disable separate levels.
Configurations ----Day------------------------------------------------- DayLevels - enable/disable previous day's levels. WidthDayLines - line width of daily levels. ColorDayLines - lin
FREE

The DE_30_803015187_S_Ke_CF_SQX is an algorithmic trading strategy for MetaTrader, tested on DAX using the M30 timeframe from December 7, 2017, to June 2, 2023. There is no need to set up parameters, all settings are already optimized and fine-tuned.
Recommended broker RoboForex because of EET timezone.
You can find the strategy source code for StrategyQuant at the link: http://quantmonitor.net/listing/dax-keltner-channel-breaker/
Key details are:
MagicNumber: 803015187 Main Chart: Cur
FREE

Necessary for traders: tools and indicators Waves automatically calculate indicators, channel trend trading Perfect trend-wave automatic calculation channel calculation , MT4 Perfect trend-wave automatic calculation channel calculation , MT5 Local Trading copying Easy And Fast Copy , MT4 Easy And Fast Copy , MT5 Local Trading copying For DEMO Easy And Fast Copy , MT4 DEMO Easy And Fast Copy , MT5 DEMO Fibo: from KTrade 1. Automatically calculate and analyze the band. -> Get the desired band 2.
FREE

This indicator is especially for the binary trading. Time frame is 1 minutes and exp time 5 or 3 minutes only. You must be use martingale 3 step. So you must put lots size is 10 % at most. You should use Mt2 trading platform to connect with my indicator to get more signal without human working. This indicator wining rate is over 80% but you may get 100% of profit by using martingale 3 step. You should use MT2 Trading Platform to connect meta trader platform and binary platform . You can get mt2
FREE

The "SyntheticaFX Power Indicator" is an exceptional trading tool designed to offer valuable insights into market strength and potential changes, without revealing its proprietary methodology. This powerful indicator is ideally utilized in conjunction with our specialized tools, the " SyntheticaFX CrashSlayer and " BoomSlayer " Spike Indicators, to provide traders and investors with a comprehensive and dynamic trading experience. When employed alongside our SyntheticaFX CrashSlayer and BoomSlaye
FREE

John Bollinger created this indicator in 2010 as a way to read the original indicator (Bollinger Bands) in a more "technical" way, shown as an oscillator. The typical range of the Bollinger Bands %B is 0 - 0.5 - 1.0, where "0" represents the lower band, the "0.5" the middle band, and "1" the upper band. The line on the indicator represents the Closing prices. As simple as that.
SETTINGS
Bollinger Bands period of analysis Standard Deviation multiplier Shift Price type to be analyzed
If you
FREE

이 계정에서 무료 제품을 지원하세요. 이 링크를 사용하여 저희 추천 브로커 에 등록하세요.
공급자의 테스트를 구매하고 손실을 경험하는 것에 지치셨나요? 더 이상 찾지 마세요 – Funding EA가 상황을 바꿉니다! 이 EA는 프로프 회사의 테스트를 성공적으로 통과할 수 있을 뿐만 아니라, 테스트에 실패할 경우 환불을 보장합니다. Funding EA를 사용하면 추가 비용 걱정 없이 원하는 만큼 많은 테스트를 시도할 수 있습니다. 어떻게 작동하나요? Funding EA는 고급 헤지 전략을 사용합니다. 이 EA는 프로프 회사의 테스트를 성공적으로 통과하거나, 문제가 발생했을 때 비용을 보장하기 위해 설계되었습니다. 즉, 첫 번째 시도가 실패하더라도 새로운 테스트를 위한 비용을 지불할 필요가 없습니다. Funding EA를 사용하려면 두 가지 유형의 계정이 필요합니다: 프로프 회사의 테스트 계정과 실제 계정입니다. 테스트를 구매한 금액의 두 배를 실제 계정에 입금해야 합니다. 예를 들
FREE

The MP Andean Oscillator is used to estimate the direction and also the degree of variations of trends. It contains 3 components: Bull component, Bear component and Signal component. A rising Bull component indicates that the market is up-trending while a rising Bear component indicates the presence of down-trending market. Settings: Oscillator period: Specifies the importance of the trends degree of variations measured by the indicator. Signal line per: Moving average period of the Signal line
FREE

Envelopes & RSI Scalper EA
Introducing the Envelopes & RSI Scalper EA, a cutting-edge expert advisor designed to make precise, high-frequency trades using advanced technical indicators and smart risk management techniques.
Key Features:
Envelopes Indicator Integration: The EA leverages the Envelopes indicator to identify optimal entry and exit points. By detecting price levels relative to moving average bands, the Envelopes indicator helps pinpoint potential breakouts and reversals, cruc
FREE

Candle Counter This product counts the candles and shows the result according to the configuration defined by the user. Professional traders use it to emphasize a specific candlestick.
Settings Position - Choose whether the numbers will be displayed above or below the candle Distance - The distance that the number will have from the candle, referring to the minimum or maximum Font Size - Font Size Color - Font Color
FREE
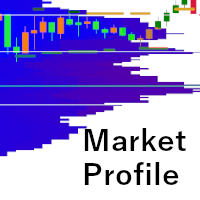
HiperCube Market Profile ! A Market Profile is a graphical representation that combines price and time information in the form of a distribution . It displays price information on the vertical scale (y-axis) and volume information on the horizontal scale (x-axis). This chart type provides insights into market activity, allowing traders to visualize and evaluate fair market value in real-time.
Features: Custom Colors Custom Chart Clearly info on Chart Graph and attractive interface Setting t
FREE
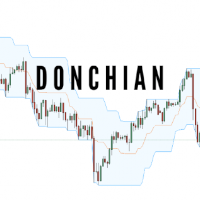
HiperCube DonChain is here!
This indicators helps you to know when one active will be a oppossite moviment.
FEATURES: Custom Period Custom Color to Bands
Price Off Set Custom Your Chart !
For Developers: If you are developer and want use this is your code here you have a guide to integrate HiperCube DonChain to your code
Read Guide
Feel free to ask me any question after purchase
FREE

The traditional Money Flow Index indicator, this time, EA friendly . There are 3 buffers exposed that can be used by EAs to automatically analyze the Overbought and Oversold conditions of the quote. Just use the traditional iCustom() function to get these signals. This Money Flow Index calculation is based on the traditional Metaquote's MFI indicator.
SETTINGS
MFI Period Volume type to analyze (Real Volume or Ticks) Starting Overbought region Starting Oversold region
USING WITH EAs
Buffer
FREE

VWAP RSJ is an indicator that plots the Hourly, Daily, Weekly and Monthly VWAP Lines.
Large institutional buyers and mutual funds use the VWAP ratio to help move into or out of stocks with as small of a market impact as possible. Therefore, when possible, institutions will try to buy below the VWAP, or sell above it. This way their actions push the price back toward the average, instead of away from it. Based on this information I developed this indicator that combines 4 types of VWAP T
FREE

ForexBob Candle Timer Is an amazing countdown time indicator which shows the time remaining for next candle to open. It can be used on any timeframe. It helps to plan your next trading action.
Inputs are simple Color - To change the color of displaying time. Size - To set the size of font Next for settings are used to set the location of time Font - To change the font type.
Please check my other products here https://www.mql5.com/en/market/my
FREE
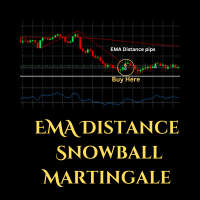
Expert Advisor (EA) that utilizes the basic EMA Distance strategy along with RSI for take profit, and employs support and resistance levels from the Zigzag indicator as stop-loss and take-profit points, you can follow these guidelines: Dow Theory Strategy : This involves analyzing trends using the Dow Theory principles, mainly focusing on identifying primary trends (bullish or bearish) and secondary trends (corrections). You'll need to implement rules for identifying these trends based on price
FREE

In which direction should I trade today? For “TREND followers”, we need to determine the TREND . This indicator determines the Trend based on the price High, Low and Close of every bar, for a given period and timeframe. Calculating and plotting the Trend UP and Trend DOWN lines. If the: “Trend UP” line (Green) is above the “Trend DOWN” line (Red), then it is a BULLISH Trend (see "Screenshots" tab). “Trend DOWN” line (Red) is above the “Trend UP” line (Green), then it is a BEARISH Trend (see "
FREE

계정 대시보드 통계
계정의 이익과 손실을 파악하기 위해 집중적으로 볼 수 있도록 도와주는 도구이므로 이를 추적할 수 있으며 손실 분석을 통해 얻은 위험도 알 수 있습니다. 계정에서 다운로드하고 활성화한 후 EURUSD H1과 같은 기호에 연결해야 합니다. 그러면 이 순간부터 도구가 통계 모니터링을 시작합니다.
패널이 완전히 고급이므로 숨기고 원하는 위치로 이동할 수 있습니다. 주요 특징은 계정 운영에 따라 다음과 같습니다. 일일 기간(매일 갱신되는 일일 손익) 주간 기간(매주 갱신되는 주간 손익) 월간 기간(매월 갱신되는 월간 손익) 연간 기간(매년 갱신되는 연간 손익) 최대 드로다운(잔고에 따라 도달한 최대 위험을 모니터링하는 매초 제어) 예를 들어 잔액이 1000 USD이고 드로우다운 표시가 10%인 경우 어느 시점에서 계정의 총 위험이 100 USD에 도달했음을 의미합니다.
FREE

This is the Bill Williams Awesome Oscillator indicator calculated from Heikin Ashi candles. Here you find multi-colored histogram which is helpful when identify weakness or strength of trend in the market. To use it, just simply drop it on the chart and you don't need to change parameters except one: switch between Heikin Ashi or normal candles (see attached picture).
FREE
MetaTrader 마켓은 거래 로봇과 기술 지표들의 독특한 스토어입니다.
MQL5.community 사용자 메모를 읽어보셔서 트레이더들에게 제공하는 고유한 서비스(거래 시그널 복사, 프리랜서가 개발한 맞춤형 애플리케이션, 결제 시스템 및 MQL5 클라우드 네트워크를 통한 자동 결제)에 대해 자세히 알아보십시오.
트레이딩 기회를 놓치고 있어요:
- 무료 트레이딩 앱
- 복사용 8,000 이상의 시그널
- 금융 시장 개척을 위한 경제 뉴스
등록
로그인
계정이 없으시면, 가입하십시오
MQL5.com 웹사이트에 로그인을 하기 위해 쿠키를 허용하십시오.
브라우저에서 필요한 설정을 활성화하시지 않으면, 로그인할 수 없습니다.
