MetaTrader 4용 유료 Expert Advisor 및 지표 - 88

The Illusion EA uses the probability theory - after a series of consecutive virtual losses - i.e. right during a flat the EA already starts trading in the trend. In addition, the EA considers the ratio of bullish/bearish candles on the higher timeframes to determine the greatest probability of the price movement direction. Only 1 order can be opened at a time. In case of a loss the following order will be placed with an increased lot (the multiplication coefficient is set in the parameters). The
Tipu Parabolic SAR Dashboard is based on the Tipu Parabolic SAR indicator. Please contact me here at MQL5 if you would like to use this panel for your custom signals. Tipu Parabolic SAR Dashboard is a multi-currency, multi-timeframe panel created to help traders in analyzing the markets quickly using the Parabolic SAR indicator signal. The dashboard panel is designed to help traders quickly change symbols and periods. If you are constantly missing trade opportunities while browsing through the

Enhance your trading precision with our revolutionary product, Trade Time Master Pro. This indicator provides unique insights into the duration of your active trades, offering a comprehensive view of their time in Days, Hours, Minutes, and Seconds. Indicator Features:
Time Display:
Indicator shows first 3 active trades (buy/sell trades) time duration in Days, Hours, Minutes, Seconds. Time duration means how long the order is active in the market, how long the order is running. Indicator shows

Taranus is a multifunctional EA, a universal assistant to a trader, designed to work under the control of a trader. The EA has a large set of tools and can work: by indicators, by trading levels, by trend lines, by martingale strategy, trade on news. It has: several filters to determine the trend, a multi-level risk management system, money management, virtual stop loss, universal trailing stop, can work with any type of orders. Set files and a guide to the Taranus EA can be found in the "Commen

The CCI FIBO trend indicator displays the real sentiment of the market. Does not redraw. The CCI FIBO indicator is based on the processed values of the standard CCI indicator. The indicator is able to display the slowing\reversal of the price during the trend movement (for exiting the position, and with some experience to display the opening in the opposite direction, for example, to use in scalping). It shows spikes in a flat. The idea of the indicator was that there are indicators that are goo
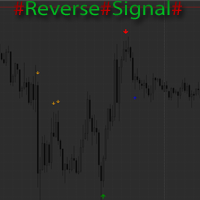
The indicator marks the estimated market reversals in the form of arrows. The indicator is able to detect 3 types of reversals. The primary reversal signal. It is a stronger and more important reversal. Denoted by the largest arrow. Alternative signal - additional signal without additional filters in contrast to the primary. Suitable for scalping on small timeframes. A mixture of the primary and alternate reversals, but with the addition of the trend filter. Also shows good results on small time

CIS is designed for trading a basket of correlating currencies, as well as single instruments: indicators
VSA indicator which draws arrows (does not redraw). Its signals indicate the price reversal on a calm market or decrease of the rise or fall rate during strong movements. Works fine in the flats. As the indicator uses volumes in its calculations, be careful during evenings and night times, when there are very small volumes. It is recommended to be used only on multiple currencies or at l

As the proper trading using CCI indicators requires the trader to monitor multiple timeframes and CCI indicators with different periods. For example - monitor the trend using CCI with the period of 100 or 200 ( slow CCI period ) on the H4 timeframe, and make entries based on the CCI with the period of 13 ( fast CCI period ) on the H1 timeframe. To facilitate this task, the Delta CCi MTF7 indicator was created, which implements monitoring the changes of the price movement trends as well as marks

The Five Minutes indicator is a ready TRADING SYSTEM for binary options. The system is designed specifically for the EURUSD M5 currency market with at least 80% payout and for trades who operate on the web-terminals and the MetaTrader 4 platform. This is a counter-trend system, i.e. it expects the price of traded asset to reverse. Signals of the system are not redrawn, they appear once the formation of the previous bar is completed, and are equipped with a sound notification. For decision-making

The Z-Compass is part of a suite of four indicators called the Z-Tools Black you can buy separately in the MetaTrader Market. The Z-Compass is one of the most important indicators, because it serves as a compass in the market and is composed of the following elements A histogram and zero line. The histogram is plotted with each candle and changes depending on the selected time frame. When the histogram is above the zero line, we say the trend or momentum is bullish and when it is below the zero

It is good to know the presence of a trend on multiple timeframes at once. And even better - on multiple currency pairs at once. This indicator allows to quickly determine the presence of a trend or a flat on 8 timeframes and from 1 to 15 currency pairs at once. Multi Alligator Signals analyzes the signals of the Alligator indicator by Bill Williams on every timeframe (from M1 to W1) and multiple currency pairs (up to 15) simultaneously. If there is a buy signal, a green upward arrow is drawn, i

Two Dragon is an advanced indicator for identifying trends, which uses complex mathematical algorithms. It works in any timeframe and symbol. Indicator is designed with the possibility to customize all the parameters according to your requirements. Any feature can be enabled or disabled. When a Buy / Sell trend changes the indicator will notify using notification: Alert, Sound signal, Email, Push. МetaТrader 5 version: https://www.mql5.com/en/market/product/14906 Parameters Max_Bars_History —

Advanced and affordable momentum indicator that fade the fake move of market. It is smoothed because of special sophisticated exponential averaging calculation. It is also similar to special type of CCI with more tolerance to overbought or oversold conditions with built-in momentum indication. This indicator is able to empower your trading as a trend detector, CCI and market momentum scale measurement.
Features Smoothed to filter uncomfortable noises. Non-Lagging Exponential averaging. Line or
It is based on Surfing strategy. DOES NOT USE MARTINGALE. The EA catches the moments when the previous candle crosses the moving average indicator and eliminates the false breakouts using the RSI+MA indicator, and at the same time analyzes the trend direction. The EA trades pending orders, which also allows to avoid false movements. If the pending order was not triggered and the chart reversed, then the EA deletes the pending order. Also, according to the strategy, the EA uses the Trailing Stop,
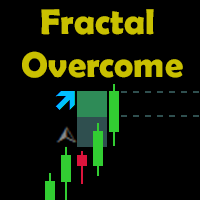
Indicator Description The indicator shows the breakout of the last fractal in real time. It considers the buy fractals above the balance line and sell fractals below the balance line (according to the Bill Williams' strategy), and also the fractals that are independent of the balance line. The direction and the distance of the fractal level breakout are displayed in real time. When a candle closes outside the suitable fractal, the levels of the specified offset, the distance to the candle closur

Master Trend Dashboard is a new generation indicator, compact, light and efficient. Each element of this Dashboard is designed to return specific signals as: Price Action, Breakout, Net Change (performance of the instrument), algorithmic studies, correlations and statistical calculations. This tool will change your way of trading allowing you to receive important information. See the Graphic Signals to understand every single signal below:
Graphic Signals Symbol name and arrow color Green = Cu
The BOSS (Binary Option Super System) indicator is a ready TRADING SYSTEM for binary options. The system is designed specifically for the currency market and for the traders who operate on the web-terminals and the MetaTrader 4 platform. This is a counter-trend system, i.e. it is based on the assumption that the price of a traded asset revert sooner or later, and the final trade will cover the previously incurred losses and make a profit. Signals of the system are not redrawn, they appear once t
The indicator calculation is based on the analysis of the price characteristics of bars and is adjusted by the ATR value. The degree of the ATR influence is determined by the ratio. The color scheme of the indicator depends on the direction of the current trend. A change in the trend is displayed by an arrow and a corresponding message. Depending on the strategy chosen by the trader, this indicator can be used to generate market entry signals, to place stop loss or close trades, and can also be

Arrows appear after Reversal-Pattern and when the confirmation-candle reaches its value, it won't disappear (no repaint). but with fix settings no additional settings necessary Entry : immediately after arrow Stop loss : a few pips above the high of the arrow - candle / below the low of the arrow - candle Take Profit : at least the next candle / move to break even after candle closed / trail the SL works on : Major Forex-pairs / M15 and higher time-frames The Value of the confirmation-candle =>

Volume Volatility is an indicator which analyzes currency pairs, indices, commodities etc. in terms of extremely high and extremely low accumulation to distribution ratio in comparison to values from past. The most important parameter is "Volume Volatility Factor" - this parameter, in big simplification, determines how far distance in the past is analyzed. The lower value of the parameter, the indicator analyzes less data from the past. I recommend you to set and test e.g. 3, 5, 15, 35, and 48 w
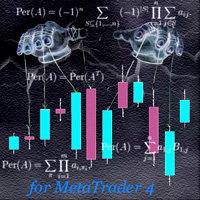
Universal adaptable indicator. It determines the estimated trading range for the current day based on the available history a real data, and displays the area of the probable price rollback on the chart. All this thanks to the built-in algorithm that automatically adapts to any behavior models of the market quotes. With the parameters adjusted, the indicator shows its effectiveness on most of the currency pairs, that have a rollback from the reached extremums during the current or the next tradi

FoxTrotTWO EA is a scalper Expert Advisor intended for EURUSD. It is also available for other major pairs and cross currency pairs. Recommended timeframe is M15. FT2 trades a narrow range at night. At the top and bottom of the range, FT2 will try to generate trades in the opposite direction. To open suitable trades, the Expert Advisor uses several indicators and analyzes several timeframes. But the trades are generated by price actions and are not opened by the indicator. FT2 requires a modera
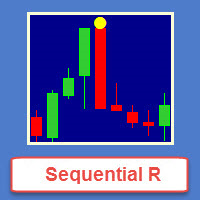
Sequential R is a powerful indicator from the set of professional trader. In today’s market, an objective counter trend technique might be a trader’s most valuable asset.
Most of the traders in the stock market must be familiar with the name "TD Sequential" and "Range Exhaustion". The Sequential R is a Counter-Trend Trading with Simple Range Exhaustion System. TD Sequential is designed to identify trend exhaustion points and keep you one step ahead of the trend-following crowd. The "Sequentia

WARNING: Product is out of support! Don't buy it unless you know how it works! Please download free version and test it heavily - it is enough for most uses. MT5 version is highly recommended due to superior back-tester.
This is PRO version of famous (or infamous) grid strategy used by social traders.
It contains YourAI module that lets you construct your own logic with almost every indicator from the market or code base! Use it in classic Grid Trading style or build your logic from scratch
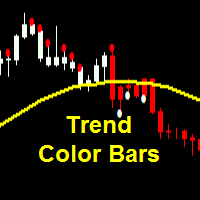
Parameters SoundAlerts = true – play sound alerts, true or false (yes or not) UseAlerts = true – use alerts, true or false (yes or not) eMailAlerts = false – use alerts via email, true or false (yes or not) PushNotifications = false – use push notifications, true or false (yes or not) SoundAlertFile = "alert.wav" – name of alerts sound file ColorBarsDown = clrRed – color body of bearish candlesticks (default – red) ColorBarsUps = clrBlue – color body of bullish candlesticks (default – blue) Colo

In the stock market technical analysis, support and resistance is a concept that the movement of the price of a security will tend to stop and reverse at certain predetermined price levels. Support and resistance levels can be identified on any timeframe. However, the most significant ones are found on the higher time frames, such as daily, weekly, and monthly. This indicator using the weekly OHLC data to identify the relevant levels. This is a support and resistance indicator and providing majo
This indicator analyzes how efficient is the current market movement based on the true high-low ratio of a certain number of bars. [ Installation Guide | Update Guide | Troubleshooting | FAQ | All Products ] The ratio is the effectiveness of the market movement A ratio below 1 means the market is going nowhere A ratio above 1 means the market is starting to show directionality A ratio above 2 means the market is showing effective movement A ratio above 3 means the market moved too much: it will

This indicator anticipates price reversals analyzing bullish and bearish pressure in the market. The buying pressure is the sum of all the accumulation bars over a certain number of days, multiplied by the volume. The selling pressure is the sum of all of the distribution over the same number of bars, multiplied by the volume. [ Installation Guide | Update Guide | Troubleshooting | FAQ | All Products ] The indicator ratio gives you a measure of the buying pressure as a percentage of the total ac

Movement Index was first proposed by Steve Breeze and described in his book "The Commitments of Traders Bible: How To Profit from Insider Market Intelligence". It quickly gained popularity among the traders who analyze the CFTC reports, and became a classic and a unique tool in many aspects, which can be used for finding rapid changes, leading to an imbalance of positions between the market participants. The indicator displays the change in the relative position of the participants as a histogra
Introduction to Support Resistance Indicator Support and Resistance are the important price levels to watch out during intraday market. These price levels are often tested before development of new trend or often stop the existing trend causing trend reversal at this point. Highly precise support and resistance are indispensable for experienced traders. Many typical trading strategies like breakout or trend reversal can be played well around these support and resistance levels. The Precision Sup
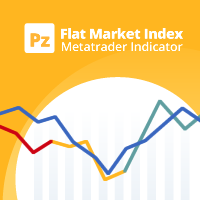
This indicator calculates how much has a symbol moved in relative terms to find trending or flat markets. It displays what percentage of the latest price range is directional. [ Installation Guide | Update Guide | Troubleshooting | FAQ | All Products ] A value of zero means the market is absolutely flat A value of 100 means the market is totally trending The blue line means the price range is healthy The red line means the price range is narrow The moving average is the flat market index (FMI)
The BG Grid is a new generation grid EA. It can also be used for trading single orders without a grid and lot increase. It is most efficient on cross pairs on the М30 and Н1 timeframes. AUDCAD M30, GBPCAD M30, NZDCAD H1, GBPCHF H1. This is a counter-trend EA and it enters the market at the time of a possible correction of the trend. Entries are based on the standard MT4 indicators. As any other grid EA, during a drawdown, the BG Grid places an order grid and eventually closes it in net profit by

A very powerful tool that analyzes the direction and the strength of the 8 major currencies: EUR, GBP, AUD, NZD, CAD, CHF, JPY, USD – both in real time, and on historical data. The indicator generates a sound signal and a message when a trend changes. Never repaints signal. The strength of the signal is calculated for all pairs which include these currencies (28 pairs total), can have value from 0 to 6 on a bullish trend, and from 0 to -6 on a bearish trend. Thus, you will never miss a good move

결과 라인의 다층 평활화 기능과 다양한 매개변수 선택 기능이 있는 고유한 "스케일링" 추세 표시기. 그것은 추세의 가능한 변화 또는 거의 움직임의 시작 부분에 가까운 수정을 결정하는 데 도움이됩니다. 전환된 교차 화살표는 고정되어 새 막대가 열릴 때 표시되지만, 충분한 경험이 있으면 표시선이 완료되지 않은 막대에서 교차하는 즉시 진입 기회를 찾는 것이 가능합니다. 신호 표시 제한 수준은 추가 필터링으로 표시기에 추가됩니다. 매개변수: PeriodMA - 기본 이동 평균 계산 기간 MethodMA - 기본 이동 평균 계산 방법 PriceMA - 기본 이동 평균 계산 적용 가격 BasePeriod - 기본 추세 기간 BaseMethod - 기본 추세선의 평균화 방법 BasePrice - 기본 추세선의 적용 가격 PowerPeriod - 추세 강도 계산 기간 PowerPrice - 추세 강도 계산 가격 PeriodBaseSmooth - 추세선의 추가 평활 기간 BaseLineSmoothM
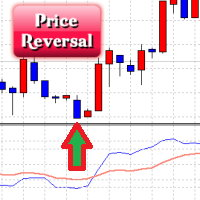
The Price Reversal oscillator identifies the potential price reversal points, while being in the overbought/oversold zones. It also displays the entry signals against the trend (sometimes these points coincide with the beginning of a new trend) (blue and red zones) and the entry points by the trend (gray areas). It consists of two lines. The blue line is the fast line, the red line is the slow one. The market entry is recommended if the value of the fast line is greater than 60 or less than -60,

This is a powerful system for binary options and intraday trading. The indicator neither repaints, nor changes its readings. Binary Reverse is designed to determine the points where the price reverses. The indicator fixes both reversals and roll-backs considerably expanding your analytical capabilities. It not only clearly shows correction and reversal points, but also tracks the overall trend dynamics.
Trading recommendations Coincidence of two signals (arrow and cross) is a strong entry sign

COSMOS4U Adaptive MACD indicator is a very simple and effective way to optimize your trade decisions. It can be easily customized to fit any strategy. Using COSMOS4U optimized AdMACD parameters, you can ensure confirmed buy and sell signals for your trades. In addition, the AdMACD displays divergence between the security and MACD trend, in order to provide alerts of possible trend reversals and it is also enhanced with a Take Profit signal line. We suggest trying out the optimized parameters tha

By purchasing this indicator, you have the right to receive a free copy of one of my other indicator's or advisor’s! (All future updates are included. No limits) . To get it , please contact me by mql5 message ! The Trend Scanner trend line indicator displays the trend direction and its changes. The indicator works on all currency pairs and timeframes. The indicator simultaneously displays multiple readings on the price chart: the support and resistance lines of the currency pair, the exist

The Expert Advisor is based on the indicator - DeMarker . The Demark indicator was developed by Thomas R. Demark. Demark tried to create an overbought / oversold indicator, which would not have most of the shortcomings of the traditional indicators, the purpose of which was to identify the potential minimums and maximums of the market, based on the demand for the asset and an indication of the extent of riskiness of buying and selling the asset in the current situation. The EA implements two str

This indicator depends on Fibonacci lines but there is a secret lines i used them, by using FiboRec indicator you will be able to know a lot of important information in the market such as:
Features You can avoid entry during market turbulence. You can enter orders in general trend only. You will know if the trend is strong or weak.
Signal Types and Frame used You can use this indicator just on H1 frame. Enter buy order in case Candle break out the square area and closed over it, at least 20

This EA uses most popular Indicators to test your own strategy and use it to trade. You can combine each Indicator to match your strategy. Many features included like Auto Stop Loss, Take Profit, Trailing Stop, Profit Lock, Pending Orders, Etc. Each Indicator has additional parameters eg. TimeFrame, Signal Method, Reverse Signal.
Indicators Moving Average 1/2/3 Parabolic SAR MACD Envelopes Bollinger Bands Alligator Fractals ADX Stochastic RVI RSI CCI DeMarker Momentum ATR
Additional Indicato

The Market Follower indicator displays two types of potential entry points on the chart (by trend and absolute reversal points). The entry point by the trend is displayed by a circle. The indicator qualifies the presence of a trend at a certain interval by a certain algorithm. Then it displays a potential entry point after a rollback (correction). For the successful use of these entry points, it is recommended to use at least M30 timeframe with a confirmation on smaller timeframes. The Absolute

Ultimate Divergence Scanner (Multi Pair And Multi Time Frame) : ---LIMITED TIME OFFER: NEXT 25 CLIENTS ONLY ---46% OFF REGULAR PRICE AND 2 FREE BONUSES ---SEE BELOW FOR FULL DETAILS It is a widely known market principle that momentum generally precedes price.
Making divergence patterns a clear indication that price and momentum are not in agreement.
Divergence patterns are widely used by institutional traders around the world. As they allow you to manage
your trades within strictly de
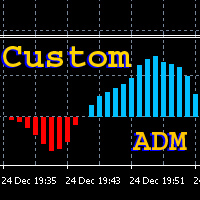
The indicator shows the direction of the current trend based on the calculation of the Average Directional Movement Index, but has two important differences from the standard ADM indicator: it presents the results as a simple and intuitive oscillator, and allows to set a custom sensitivity threshold to cut off the market noise. The histogram shows the value and sign of the difference between the +DI and -DI lines: on an uptrend the +DI is higher, the difference is positive, and its value is disp

The Expert Advisor only sells. Recommended currency pairs : EURUSD; GBPUSD; USDCHF; USDJPY; USDCAD; AUDUSD; EURGBP; EURAUD; EURCHF; EURJPY; GBPCHF; CADJPY; GBPJPY; AUDNZD; AUDCAD; AUDCHF; AUDJPY; CHFJPY; EURNZD; EURCAD; CADCHF; NZDJPY; NZDUSD. Timeframe: H1. Percent% manages closing both loss-making and profitable deals based on the account overall status. Using the EA on 23 symbols mentioned above allows the robot to cope with the drawdown in case of a long trend. While positions on some pairs

If you wish to draw Support and Resistance lines, view: daily market opening, classical pivot levels, Fibonacci pivot levels, trend lines, Fibonacci levels, the remaining time to candle closing, and current spread. If you seek to place your orders with the exact lot that meets your desired stop loss risk. If you wish to do all this and more with just one click, then this is the perfect tool to use. This tool will allow you to feel more relaxed when deciding to open orders, as well as predicting
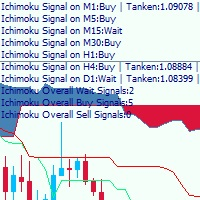
This is a multi-timeframe Ichimoku Kinko Hyo signal analyzer indicator. As you know, Ichimoku consists of 5 lines (Tenkan-sen, Kijun-sen, Chikou Span, Senkou Span A & B which create the Kumo Cloud). Ichimoku is a simple indicator like Moving Average, but the method they use makes it a very good tool in detecting market conditions and trend with which you can open trades in the best location and stay in the trade till the most profitable price. As this indicator has lots of lines and we should co

The Smooth Price technical indicator is used for plotting a smoothed line as close to the price of the financial instrument as possible, and serves to eliminate its noise components. The indicator is part of the Monarch trading system, but here it is presented as an independent technical analysis tool. The indicator is based on the cluster digital filter , which, unlike the ClusterSMA , is applied directly to the price time series. Smooth Price does not redraw (except the very last, zero bar) an

The indicator is a full-fledged trading system based on four indicators. It consists of several lines indicating trend direction and power. Smooth lines mean strong trend, while broken lines indicate a weak one. Sell if the line appears above the price and buy if it appears below the price. Absence of lines indicates flat market. If the market is uncertain, there are no indications, or the line is yellow. This is a good period for closing orders or waiting for an opposite signal. The indicator h

The one and only function of this indicator is to show a moment when the price trend has changed. If a Green line is crossing a Red line down up then the price trend will go up with a very high degree of probability. If a Red line is crossing a Green line down up then the price trend will go down with a very high degree of probability. The indicator can be used on any time frames and currency pairs.
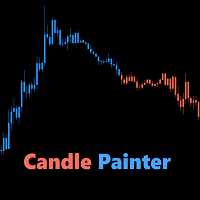
Candle Painter is a 13 in 1 indicator that paints indicators such as all the oscillators, right on top of your chart candles. You can choose from a long list of indicators and follow the trend of the colored candles, or get warned by the overbought/oversold color on the candles. Uptrend and downtrend levels can be set for the oscillators. Oscillators with main and signal lines, such as MACD, Stochastic and RVI, also have the option to follow trend by crossings. Overbought and oversold levels can

Ultimate Pivot Point Scanner (Multi Pair And Multi Time Frame) : ---LIMITED TIME OFFER: NEXT 25 CLIENTS ONLY ---46% OFF REGULAR PRICE AND 2 FREE BONUSES ---SEE BELOW FOR FULL DETAILS For over 100 years (since the late 19th century), floor traders and market makers have used pivot points
to determine critical levels of support and resistance. Making this one of the oldest and most widely used
trading approaches used by traders around the world.
Due to their widespread adoption, pivot point

Ultimate Consecutive Bar Scanner (Multi Pair And Multi Time Frame) : ---LIMITED TIME OFFER: NEXT 25 CLIENTS ONLY ---46% OFF REGULAR PRICE AND 2 FREE BONUSES ---SEE BELOW FOR FULL DETAILS Unlike the equity markets which tend to trend for years at a time, the forex market is a stationary time series.
Therefore, when prices become severely over extended, it is only a matter of time before they make a retracement.
And eventually a reversal. This is a critical market dynamic that the institution

Ultimate Range Trade Scanner (Multi Pair And Multi Time Frame) : ---LIMITED TIME OFFER: NEXT 25 CLIENTS ONLY ---46% OFF REGULAR PRICE AND 2 FREE BONUSES ---SEE BELOW FOR FULL DETAILS The FX market is range bound at least 70% of the time. And many of the largest institutions
in the world focus on range trading. Such as BlackRock and Vanguard , who have a combined
$15 TRILLION under management.
Range trading has several distinct advantages that make it safer and more predictable
than
Object Synchronizer : Better focus/analysis of the price chart in many time frames. Are you bored to save and load template many times for the same symbol for many chart time frames? Here is the alternative. With this indicator, you enjoy creating objects across many charts, you can modify the same object in any chart, you can delete the same object in any chart. All objects that you created/modified always are synchronized across all chart windows (with same symbol). Save your time, you can foc

Ultimate Reversal Scanner (Multi Pair And Multi Time Frame) : ---LIMITED TIME OFFER: NEXT 25 CLIENTS ONLY ---46% OFF REGULAR PRICE AND 2 FREE BONUSES ---SEE BELOW FOR FULL DETAILS Reversal patterns are some of the most widely used setups in the institutional trading world.
And the most (statistically) accurate pattern of them all is called the ' Three Line Strike '. According to Thomas Bulkowski ( best selling author and a leading expert on candlestick patterns ),
the ' Three Line Strik

Searches on every symbol on MT4 MarketWatch. System Stoller% uses Williams% and StarcBands to calculate trend, entries and exits. Works only for H1 timeframe.
Input parameters: Period: Number of bars to search. Refresh_min: Number of minutes to wait between searches. ShowTrendChanges: Signals on trend changes. ExtendPeriod: Extend period to calculate signals order. UseADXFilter: Confirm entry using ADX on M15. BullColor: Font color on buy entries BearColor: Font color on sell entries.
Result

ADX Pointer is an indicator which is based on "Average Directional Index" and draws three numbers in chart window depending on the value of ADX. In ADX Pointer you can set "ADX_Period" which is of course period of Average Directional Index and you can also set 3 levels. When ADX value exceed first level ("ADX_Level1") in chart window appears number "1", when ADX exceed second level ("ADX_Level2") appears "2" and when ADX exceed third level ("ADX_Level3") appears "3". Simple. ADX Pointer works on

CCI Pointer is an indicator which simply draws arrows on chart window when value of CCI (from parameter CCI_Period) is above CCI_Level (red downward pointing arrow) or below negative CCI_Level (green upward pointing arrow). CCI Pointer works on all timeframes and all currency pairs, commodities, indices, stocks etc. CCI Pointer has only two parameters, CCI_Period and CCI_Level . For example, if you set CCI_Period=25 and CCI_Level=200 indicator will draw arrows for values below -200 (oversold) an

RSI Pointer is an indicator which simply draws arrows on a chart window when the value of RSI (from parameter RSI_Period) is below RSI_Level (green upward pointing arrow) or above 100-RSI_Level (red downward pointing arrow). RSI Pointer works on all timeframes and all currency pairs, commodities, indices, stocks etc. RSI Pointer has only two parameters, RSI_Period and RSI_Level . For example, if you set RSI_Period=7 and RSI_Level=20, the indicator will draw arrows for values below 20 (oversold)

The Price Action Dashboard is an innovative tool to help the trader to control a large number of financial instruments. This tool is designed to automatically suggest signals and price conditions. The Dashboard analyzes all major Time Frame suggesting price action conditions with graphic elements. The Dashboard can suggest you the strength of the trend identifying directional movement, it is an indispensable tool for those who want to open position themselves using market trends identifiers. The

OBV Divergence Formation (hereinafter "Diver") is based on On Balance Volume technical indicator (OBV) that is a momentum indicator that relates volume to price change. Classic (regular) and Reversal (hidden) Divergences - at your choice. Adjustable sizes and all parameters Flexible settings including VOID levels (additional alert function, arrows on price-chart show in which direction to trade) No re-paint / No re-draw (set CalcOnOpenBar =false) "SetIndexBuffer" available for all variable

The MACD Turbo indicator provides a highly configurable enhanced MACD indicator with histogram, push notifications, pop-up and email alerts. Traders can customize the MACD calculation parameters to meet their needs and also control the alert system based on their requirements. The alert module produces alerts when the MACD line crosses the 'Watermark' or zero level and also when the MACD and Signal lines crossover. Traders can choose the nature of the crossover modes which can be 'Printed' - whe

The RBCI hist indicator is an adaptive trend histogram, that eliminates noise using a Low-pass filter, which passes the lower frequencies and cuts off hight frequencies of the price fluctuations. The signal (depending on the strategy chosen by trader) is the intersection of the zero line by the indicator, as well as the change in the histogram color. The change in the histogram color serves as an early signal for opening positions towards the trend. The position of the indicator relative to the

Hello, I am Ayman from Egypt, I want to present an interesting indicator to you. It depends on Ichimoku Kinko Hyo, but there is a secret that i use in it. By using my indicator, you will be able to know a lot of important information in the market such as: Live Signal : https://www.mql5.com/en/signals/821024
Features You can avoid entry during market turbulence You can enter orders on the general trend only You will know if the trend is strong or weak If you entered an any orders by the help o

Full Market Dashboard (Multi Pair And Multi Time Frame) : ---LIMITED TIME OFFER: NEXT 25 CLIENTS ONLY ---46% OFF REGULAR PRICE AND 2 FREE BONUSES ---SEE BELOW FOR FULL DETAILS One of the biggest advantages the institutions have, is their access to enormous amounts of data.
And this access to so much data, is one of the reasons they find so many potential trades.
As a retail trader, you will never have access to the same type (or amount) of data as a large institution.
But we created this

The indicator displays trend strength, including showing the transition from buy to sell and visa versa. It is ideal for trend following strategies and also highlights possible reversals/flattening trend with a yellow X on the indicator window. By default, the indicator does not repaint/flicker, however, there is an option to calculate on the live candle but even then the indicator will not repaint unduly. The indicator can also be used for exit.
Usage Enter long/buy trade when the indicator t

Divergence Formation BBands (hereinafter "Diver") is based on Bollinger Bands Technical Indicator (BB). Classic (regular) and Reversal (hidden) Divergences - at your choice. Adjustable sizes and all parameters Flexible settings including VOID levels (alert function in place, arrows to show in which direction to trade) No re-paint / No re-draw (must set CalcOnOpenBar =false) "SetIndexBuffer" available for all variables (can be used in EA) Auto-detect 4- and 5-digit price function Lite (does not
This is a medium-term conservative system. It tracks quote movements and defines entry points. The Expert Advisor is completely automated and features the unique algorithm. It has been designed for trading CHFJPY, EURCHF, and USDJPY.
Features It does not use Martingale; No grid; No scalping; No excessive parameters; Fixed lot; No complicated settings. Trades are usually opened infrequently. Orders may remain open for a few days for obtaining greater profit. Amount of trades per month – from 5

Divergence Formation Hurst (hereinafter "Diver") is based on Hurst exponent used as a measurement of long term memory of time series. Classic (regular) and Reversal (hidden) Divergences - at your choice. Adjustable sizes and all parameters Flexible settings including VOID levels (alert function in place, arrows to show in which direction to trade) No re-paint / No re-draw (must set CalcOnOpenBar =false) "SetIndexBuffer" available for all variables (can be used in EA) Auto-detect 4- and 5-digit p
MetaTrader 마켓은 과거 데이터를 이용한 테스트 및 최적화를 위해 무료 데모 거래 로봇을 다운로드할 수 있는 유일한 스토어입니다.
어플리케이션의 개요와 다른 고객의 리뷰를 읽어보시고 터미널에 바로 다운로드하신 다음 구매 전 트레이딩 로봇을 테스트해보시기 바랍니다. 오직 MetaTrader 마켓에서만 무료로 애플리케이션을 테스트할 수 있습니다.
트레이딩 기회를 놓치고 있어요:
- 무료 트레이딩 앱
- 복사용 8,000 이상의 시그널
- 금융 시장 개척을 위한 경제 뉴스
등록
로그인
계정이 없으시면, 가입하십시오
MQL5.com 웹사이트에 로그인을 하기 위해 쿠키를 허용하십시오.
브라우저에서 필요한 설정을 활성화하시지 않으면, 로그인할 수 없습니다.