MetaTrader 4용 유료 Expert Advisor 및 지표 - 47

The parabolic SAR indicator, developed by J. Wells Wilder, is used by traders to determine trend direction and potential reversals in price. The indicator uses a trailing stop and reverse method called "SAR," or stop and reverse, to identify suitable exit and entry points. Traders also refer to the indicator as the parabolic stop and reverse, parabolic SAR, or PSAR.
The parabolic SAR indicator appears on a chart as a series of dots, either above or below an asset's price, depending on the d

Flag Pattern pro is a Price Action (PA) analytical tool that scans the continuation patterns known as "Flag and Pennant Patterns" .
Flag and Pennant patterns are continuation patterns characterized by a move in a previous trend direction after a shallow retracement usually below 50% of the original move . Deep retracements can however be sometimes found at the 61.8 % levels. The original move is know as the flag pole and the retracement is called the flag.
Indicator Fun

Just download the Quarter Strike indicator and embrace your dream. Trading within the volatility range has always attracted traders, because most often it is simple instruments that turn out to be the most profitable. The Quarter Strike indicator is a variant of constructing a price channel that gives signals of sufficiently high accuracy on any instruments and time periods. Bias or other additional parameters are not applied, that is, the indicator evaluates only the real dynamics.
By defaul

The Channel Arg Control indicator, in addition to lines, reflects entry signals in the form of arrows. But how to do that? At first glance, this is not an easy task. But not for the Channel Arg Control indicator, this indicator will tell you whether you have configured the indicator correctly, while you can specify the history interval in the bars that interests you. And yet, how does the indicator tell you? Look at the numbers on the chart near the arrows! This is exactly what you thought, the

EA Type : Martingale Multiplier : Hard multiplier but with lot size limitation Main Features of this EA: 1) Scalp and Swing EA. EA Keep last order for swing. 2) Last order will be set SL Positive or I called it BEP (Breakeven Position) 3) EA can floating on profit 90% most of the time. 4) Target per month : 10 to 30% is Achievable 5) Comes with Smart Safety - to avoid account from Marginal Call too fast when market in trending. 6) Lot Size Management - EA Open order base on lot sizing and risk.

The Channel Full Control indicator, in addition to lines, reflects input signals in the form of arrows. Also, next to each arrow, the pips of profit are displayed which are calculated for the specified interval, the interval for calculation is set in the indicator, as a rule, 1000 bars are enough for this. You can adjust the channel settings for any symbol and timeframe.
American traders say: “Trend is your friend”, which means “Trend is your friend”. And indeed it is! By trading with the tre

Intel Trend is a forex trend indicator based on all the usual SAR, using differential calculus to generate a signal not directly from the price but from the derivative of the function. Also, when using the SAR indicator, the first point often changes, which is why the default parameter ShiftBar = 1. To skip the first baoa and read information directly from the second bar. If you set ShiftBar = 0, there will be perfect signals, but they are false. real signals for each timeframe and for each cur

The EA uses cross-trading for several currency pairs at the same time, taking into account the total profit. Trade is seen in groups, in each group there can be 2 - 8 currency pairs at the same time. Trading signals come from 6 timeframes: М1, М5, М15, М30, Н1, Н4. The EA uses the following indicators: MACD, Standard Deviation, Commodity Channel Index. The EA uses a hidden one: stop loss, take profit, breakeven, trailing and the minimization of stop loss towards profit. The EA does not re

Trading is an art. This EA is developed based on the idea of the book of changes. Everything in heaven and earth is in constant development. It expounds this "natural" law. This law reveals the characteristics of the whole universe, including the attributes of all things between heaven and earth. Therefore, the author finds the law of Yin-Yang transformation through the assignment of the double average, so as to be close to the trend of the market and seek profits in the interval. This EA is bas

Virtual Exchange Reserve In an environment where exchanges offer increasingly high leverage ratios, it is all the more important for traders to tightly regulate their level of equity . This software is designed to be run in the background on any virtual private server that can run Meta Trader 4/5. It implements basic equity control functions ahead of the broker---allowing users to set their own equity trailing stop, an equity limit to lock-in a certain profit margin, and a universal stop tha

️️️ Market Steps Indicator ️️️ YOU CAN FIND US HERE FOR BEST PRICES: it is moved here https://www.mql5.com/en/users/pipcrop/seller Still old customers can install their old purchases from here!
The Market Steps indicator is designed and built based on Gann Time/Price correlations and optimized by Price Action specific rules for Forex Market. It uses Market order flow concepts to predict potential price zones for high volume of orders. Indicator Levels can be used for tradin
Milch Cow Harmonic EA "Tool designed to trade 28 currency pairs according to 88 harmonic patterns plus one customized according to your parameters The expert graph interface guides you to the pattern names when passing over the pattern circle You can activate or disable any number of currency pairs and patterns for your trade by clicking on the currency pair circle or the harmonic pattern (green = activate red = disable) You can set more than one time frame within which the expert will look f

Trend First Derivative RSI is a Forex trending bot based on the First Derivative RSI indicator.
In the screenshots you can see tests that show the bot can work for 1,3,6 years, the timeframe is one hour. These are demo tests that show that it is realistic to go through significant sections of history with a different indicator and simple rules. Below in the text you will see a description of the rules of work. For real work, optimization is proposed for 3-12 months and work up to 1-2 months.

Trend First Derivative RSI is a Forex indicator based on all familiar RSI, based on the first derivative of the price function. On the chart itself, trend signals will be displayed by arrows, they are filtered by the algorithm and always alternate buy / sell. It also shows the number of profitable pips that the indicator can give at the specified interval (LimitCalcHistory). The indicator has a parameter (Spread), which deducts a part of the profit per spread for each signal.
To control the p

After months of hard work and development, we are delighted to release Cloud 9 into the MQL4 MarketPlace! Cloud 9 is a unique fully-automated trend robot designed to work on a variety of currency pairs. It utilizes moving averages and a complex theory of the ichimoku cloud, catching strong trends in currency markets. Historically, manual traders have lacked patience and discipline. Cloud 9 has no such problem. It scan the markets 24/5 searching for its specific entries without any need for huma
First Derivative RSI is a forex indicator based on all familiar RSI, based on the first derivative of the price function. The indicator combines the functionality of an oscillator and a trend indicator. At the bottom of the chart, a part of the indicator similar to the RSI will be displayed, but only calculated as the first derivative of the price. On the chart itself, trend signals will be displayed by arrows, they are filtered by the algorithm and always alternate buy / sell. It also shows th

The Ikka Martingale Strategy The EA is design to trade on the basis of martingale with average TP, but here it start from two type of initial trades " Limit Orders and Stop Orders Pending" for determination of trend direction so You should be want to run different different settings for every pair as you will Optimize the that pair and it will make Profit as It only closes the Open trades on specified Take Profit value in Points.

Renegade The indicator generates arrows (red and blue by default). The indicator is installed in the usual way on any trading symbol with any time interval. It is an auxiliary tool that is used for technical analysis of the price movement chart in the Forex market. Novice traders have difficulties both with finding an indicator and with its application. Their reason is the lack of technical awareness of ordinary users and the lack of basic knowledge about good trading programs.
In Forex trans
Calc Trend Ex is a forex trending bot based on the Calc Trend indicator.
A bot created on the basis of this Calc Trend indicator and working on the principle - if there is an indicator signal, then the bot has closed an opposite deal and opened a new deal in the specified direction, it can be downloaded and used for work. The bot is as simple as possible! The bot fully reflects the work of the indicator. Moreover, the bot can be optimized (by optimizing the parameters of the indicator itself)
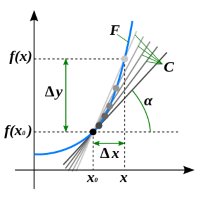
Calc Trend is a Forex trend indicator based on the familiar RSI, but there is one "but"!
We display RSI indicator signals on a price function chart using a mathematical approach. As you know, the overbought and oversold zones that the standard RSI fixes are often broken by the price and the price goes the other way. This makes the standard indicator inapplicable for real work in its pure form. Also, for sure, each user has noticed that at any part of the history, it is possible to change the

Modify Trend - Unique indicator for identifying trends. The indicator has a complex algorithm of work. But for the user there are only two colors of arrows, red indicates a sell trend, blue indicates a buy trend. Thus, it is quite easy to interpret the indicator signals. The indicator works on different timeframes; to work with lower timeframes, it is recommended to decrease the indicator period for more frequent entries. To work on higher timeframes, on the contrary, increase. The new system ad

Projection Trend - a Forex arrow indicator without redrawing does not change its signals when the market situation changes, does not adjust to the chart. The signals given by him are unambiguous. Traders build a trading system that provides good signals 80-90% of the time.
The indicator showing the points of entry and exit from the market with arrows is able to bring results not only in the Forex market, but also when working with binary options. You can buy it and install it in MetaTrader yo

PX Trend is a technical indicator that mathematically transforms the price of a currency pair in the form of signaling arrows on the chart, it is used to predict the direction of the market movement. This tool is basic for the interpretation of the parameters of the graphs in technical analysis.
PX Trend refers to an arrow indicator Forex - a tool that gives unambiguous signals to buy or sell currencies using arrows. An arrow directed upwards recommends buying, downward - selling. The indicat
Forex Roulette - Trend Following Strategy! The most reliable indicator is used for the trend - the moving average. Only for the global trend, then the strategy itself is implemented. On screenshots, testing from $ 10,000, but the bot works without problems with $ 100. The first graph is optimization, the second is forecast. You can repeat yourself on another period, observing the principle indicated below.
How the bot works. Optimization for the m15 period, after which works for 3 months. Ver

EA KOGORO TREND
PROFITABLE HIGHER, FLEXIBLE AND SAFER EA KOGORO is a robot that operates on the most basic principle of the market: "Trend is Friend" combined with the improved Martingale principle with many times more safety than conventional Martingale. - EA KOGORO is a fully automatic EA robot for established pairs. - The principle of order balancing, low DD protects accounts better for high profits. - Opening and closing orders is really flexible. - Safer, high profit. - Manage

Steady Flow is a fully automated system which has been developed to make strategies compatible with price action patterns. Protected by stop loss and take profit The Expert Advisor does not use martingale, grids, hedging, averaging and other risky strategies Enable or disable news filtering according to user needs Continuously generating profits Can trade full time in all conditions Works well in all market conditions, either trend or sideways This EA has passed 18 years back test of tick data

The Trend Long indicator accompanies long trends. It can be used only to determine the global trend, but not as an entry point. Any reliable entry indicator can be used for the entry point. Or the standard RSI, based on overbought / oversold levels.
The indicator can be used without restrictions on instruments or timeframes. Experiment with the parameters! The parameters are not linear! When you specify a period, you only specify a period to determine the price range for a certain interval. T
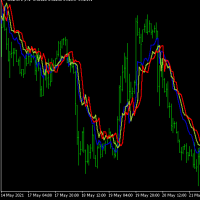
Forex strength meter is a useful indicator with which novice traders and professionals can analyze the market and see when and where to open a deal. Forex strength meter is an analytical complex for Metatrader4 which, in the form of lines on the chart, shows the trader the direction of the trend and its reversals. The interpretation of the indicator is very simple. When the indicator draws a red line above the blue line on the chart, it means that the trend is now going down. At this point, it

The CCI Divergence is a reasonably useful indicator in itself, but it is even more effective when used with divergence pattern trading. The CCI Divergence indicator signal is one of the most potent signals among the indicators that exist in the market.
Here is new version for Divergence Indicator using CCI method, with more improvements.
Divergences indicate a potential investment point because the directional moment does not confirm the price. A bullish divergence occurs when the underlying

Planned transition is a trend indicator that will help a trader to determine the direction of trade. The indicator has a complex algorithm of work. But for the user, only two lines remain, the red line indicates a sell trend, and the blue line indicates a buy trend. Thus, it is quite simple to interpret the indicator signals. The indicator works on different timeframes; to work with lower timeframes, it is recommended to decrease the indicator period for more frequent entries. To work on higher

Trend Improved - Arrow trend indicator, without lagging and redrawing, is used by traders in trending strategies in trading on financial markets (Forex, CFDs, binary options).
Key parameter MinAngle - The parameter is set in pips. For each instrument, select individually, start from scratch. If the parameter is too large then there will be no signals.
The tool, at the very least, deserves attention for its signal accuracy and intuitiveness. Increasing the Period parameters decreases the num
Non-Repainting Indicator dont; s forget this;s work well stronger trend fast markert lower time frame How to trade with SL Scalping Arrow * this system trend trading system we trade 15M chart using day tp,if you want identify Accumulation Distribution (H4) i am reccomend my SL Currency Strength Meter 28 Pair monthy weekly strenght you can easy filter best rank symbol list weekly monthy * we dont;s trade trend change time waiting trade next day pullback * if you want golden entry find. SL Cur
Simple Trading System Update !!! Follow this link to see our 2024 Strategy !!! ( Download the EAs scanner )
Deal trading trend indicator is a useful indicator tool predicting the market movement, easy-to-use due to obviously showing trend line, arrow and target point. You can consider the direction of the market for going up or going down by using this indicator.
Parameters In this section, we are explaining the main parameters including; Period bar : The number of history bars are us
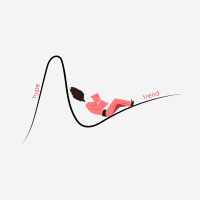
Trend VS is a simple indicator with simple and reliable signals. The high speed of reading signals from the chart is an advantage for a trader using this type of analysis. What could be faster than a visual signal from a chart? Only software reception of such signals. But we trade manually and receive signals visually. Everything happens quickly - they saw a signal, opened a deal, placed stop orders.
Also an important advantage of using the Trend VS indicator is the fact that it does not redr

Trend Simon - allows you to determine the current trend. Using the algorithm implemented in this indicator, you can quickly understand which trend is currently developing in the market. The indicator ignores sharp fluctuations and market noise and monitors market trends. Trend Simon indicators can be used along with oscillators as a filter. Flexible settings of Trend Simon indicators allow you to receive more accurate signals for opening positions on different instruments.
For calculations, t

The Trend movement indicator calculates the saturation levels of the price chart. A signal to exit the oversold area is a buy signal. A signal to exit the overbought area is a sell signal. Usually, you need to set the relative values for the overbought and oversold levels Bottom and Top - for this indicator.
Most often, a good trend is visible on a price chart visually. But an experienced trader should clearly understand the current balance of power in the market before entering. And the in

The bot uses 4 MACD indicators and two MAs in its work, thus a zone is formed for trading on the breakdown of the Bands channel and, accordingly, with a minimum stop level and only one deal. The bot also takes into account parameters such as slippage, spread and volatility. Entry is made only when there is sufficient volatility. Thus, the bot works using sharp tick movements. It is recommended to work on liquid Forex pairs with a low spread. The lower the commission and the spread, the greater

Ea uses a price action trading system. Ea will check the important keylevel and wait for the price to break through the keylevel and come back to test again to make sure the price will follow the trend. This is a price action trading robot, the EA will stick to the medium term trend and price to deliver trades. Orders are always protected by the user set stop loss points. With the capital management system, it will help that EA operates in accordance with its purpose. Telegram : https://t.me/t

Control Shot - Unique indicator for identifying trends. The new system adapts to the market, eliminates additional conditions and copes with its task. A revolutionary new way to identify the start of a trend early. The trend indicator, shows signals, can be used with an optimal risk ratio. It uses reliable algorithms in its calculations. Shows favorable moments for entering the market with arrows, that is, using the indicator is quite simple.
Tired of adjusting the indicator settings, wasting

Half Trend TPSL Buy Sell Indicator calculates the open and close of the price bars over the selected period of time and applies its own calculation method to find an average line of the price movement. ATR based Take Profit and Stop Loss ATR is a measure of volatility over a specified period of time. The most common length is 14, which is also a common length for oscillators, such as the relative strength index (RSI) and stochastics. A higher ATR indicates a more volatile market, while a lowe

For This Indicator 'WL Percent R'
This indicator is an upgrade of traditional Williams %R on MT4. 1. Up trend : indicator is above -50 and strong trend is above -20. 2. Down trend : indicator is below -50 and strong trend is below -80.
How to use... 1. You can be customize color and level of indicator. 2. You can be customize alert and define alert on next bar or instant bar.
Williams Percent R (Williams %R) credit : https://www.investopedia.com/terms/w/williamsr.asp
Williams %R, also
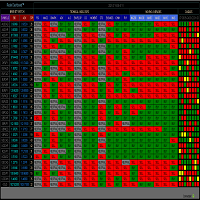
RADAR DASHBOARD
The Radar Dashboard shows the current "Trend Feeling" of each symbol based on the key indicators from the Classic Technical Analysis. As more indicators shift from Sell to Buy, it is suggested that the Trend is now Up (buy). As more indicators change from Buy to Sell, it is suggested that the Trend is now Bearish (sell). The interpretation by the columns of "CANDLES" can also show us possible reversals or pullbacks. For example: A large amount of red squares in H4 (bear candle

This indicator is designed to identify trend reversal points. Its main difference from others is that it does not use moving indicators such as MA and built on its basis, namely, it does not show a trend reversal after the fact of a reversal, but tries to predict a trend reversal even BEFORE the reversal begins. The indicator is based on many different author's developments that allow you to minimize the number of false signals.
The Trend Predictor indicator will be a very good helper in your
Buy The Dip Util is an halfautomatic expert advisor (EA), to buy on dips (days lows) and sell on spikes (days highs). A profit can exceed a loss trade up to 10 times , so the user can have several loss trades and still make profit.
Orders are opened at the change of the hour , if a button in the chart is pressed. The Buy The Dip as EA does this automaticly.
The order stoploss is automaticly set right below the low of the former hour (buy) or right over the high (sell). The position s

It is a trading "engine" and an open platform with free settings and a scalable trading system, which is a template and basis for creating and adding new trading algorithms. The EA's base already includes several variants of trading robots, and there will be more of them in the future.
The openness of the project and the trading system will unite users into a community to develop the base of algorithms and find the best options for the expert advisor. (The trading system is new and work

Concept : Sto Extreme Entry order point is a set of Stochastic oscillator (5,3,3) (customizable). There are 4 types of entry points: 1. Main line cross above/below Signal line : Main line Intersect Signal Line (2 lines intersect) 2. Main line line or Signal line cross out OVB/OVS : Main line /Signal Line (Optional) cross above OVB and cross below OVS 3. Main line line or Signal line cross in OVB/OVS : Main line /Signal Line (Optional) cross below OVB and cross above OVS 4. Main line line or S

Safe Trend Indicator works on M1, M5, M15, M30, H1 and H4 timeframes. It confirms trade directions. Scalpers, Intraday, especially swing, intermediate and long term traders will especially find this indicator useful. On chart edits and other show/hide buttons make possible clarity of chart while Sate Trend Indicator remains active even when hidden. Send an order not far from any of the most current circular colored spot that you see on the chart. Also if any additional same order in the c

Finding the right trend is always one of the most important points of trading
If you agree with me then let's move on
How do we recognize the trend?
As you well know, one of the best and most widely used standard indicators is the ATR. There is no special magic
We try to identify the trend by calculating the amount of ATR and the amount of Multiplier.
You can use this indicator in all currencies and all time frames. Of course, note that the purpose of this indicator is to show the t

Trend Bilio - an arrow indicator without redrawing shows potential market entry points in the form of arrows of the corresponding color: upward red arrows suggest opening a buy, green down arrows - selling. The entrance is supposed to be at the next bar after the pointer.
The arrow indicator Trend Bilio visually "unloads" the price chart and saves time for analysis: no signal - no deal, if an opposite signal appears, then the current deal should be closed. It is Trend Bilio that is considered

Perfect Entry Indicator MT4 DETECT THE TREND AND THE BEST PRICE TO ENTER A TRADE
Trend Detection for perfect entry - Distinguish the direction of the trend and its strength , showing a line of different colors depending on whether the trend is strong bullish, weak bullish, strong bearish or weak bearish.- Best Entry point for perfect entry - Shows an area with the best entry in favor of trend. Never trade against the trend again.
Entry signals and alerts - When the price is in a vali

MT4 trend indicator with a probability of reaching a profit of 70-90%! Works without redrawing and delays. Trend Master PRO shows good results on all trading instruments: currencies, metals, indices, stocks, cryptocurrencies. Recommended timeframe: H1-H4.
More information about the indicator is here: https://www.mql5.com/en/blogs/post/744748
Recommendations for use
Use automatic period detection The main feature of the indicator is the self-optimization function.

FBO Trend Momentum FBO Trend Momentum is a simple to use trend following system. It detects the prevailing trend and gives entry points when there is momentum in the direction of the trend. Suitable for defining entry points for scalping as well as for intra-day trading. Features Works with the prevailing market trend. Suitable for all markets (currency pairs, metals and indices). Ideal for trading on the H1, H4 and D1 time frames. Does not redraw/repaint the arrows. Arrows are confirmed at t

Joe Expert Advisor is a scalper’s delight and level tranding strategy based on ZigZag , Stochastic and RSI indicator . This EA is designed to track and link extreme points on the activity chart , offering one of the easiest ways to plot trend lines and places market orders based on the combination of 3 indicator , buying low and selling high with Recovery Settings. Profit Money: 5

This indicator tracks the market trend with an unmatched reliability, by ignoring sudden fluctuations and market noise. It has been designed to trend-trade intraday charts and small timeframes. Its winning ratio is around 85%. [ Installation Guide | Update Guide | Troubleshooting | FAQ | All Products ] Amazingly easy to trade Find oversold/overbought situations Enjoy noise-free trading at all times Avoid being whipsawed in intraday charts The indicator analyzes its own quality and performance It

Moving Average Crossover Scanner and Dashboard Advanced Moving Average Scanner Moving Average Crossover Dashboard The indicator scans the market and sends signals and alerts for Moving Averages crossovers, death cross and golden cross. Crossovers are one of the main moving average ( MA ) strategies. MA Crossover ( cut ) strategy is to apply two moving averages to a chart: one longer and one shorter. When the shorter-term ( fast MA ) MA crosses above the longer-term ( slow MA ) MA, it's a buy sig
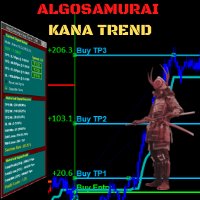
Cutting-edge solution for Trend Trading with statistically robust signals! Kana Trend’s smart algorithm detects the trend on any instrument, any timeframe, and gives powerful entry signals with exit levels. Its advanced statistics gives you deep insight as to success and profitability of its signals -- while being fully transparent on any potential for loss. Because this is an indicator, not an EA, you cannot see it in action in visual tester if you download the Free Demo. Instead, please down

Madx Cobra Indicator. Create to traders both experienced and inexperienced to use it because it is a basic indicator
How to use : Setting Indicator 1. MA Fast : Moving Average fast (10) 2. MA Slow : Moving Average Slow control trend markets.(200) 3. ADX : Control trend(5) 4. For alert you can set to alert Next bar or instant bars.
When arrow sky blue show or arrow up, you can entry order "Buy" or "Long" and arrow red show or arrow down, you can entry order "Sell" or "Short"
Setting s

COLLAPSE STAR is an EA based on a contrarian trading system but still takes advantage of the accelerations in favor with an intelligent trailing system. COLLAPSE STAR is always on the market, accumulating earnings every day. With composite interest it allows an exponential growth of your capital. It is a mediated system but it is not a grid system. COLLAPSE STAR enters the market when the trade is most likely to be profitable. COLLAPSE STAR is not a martingale: an increase in volumes is planned

The Wombat-EA based on the Bollinger Bands & Envelopes Indicators. It is a pure Trend Follow Robot
NO use of:
️ Grid
️ Doubling
️ Martingale
️ Averaging
Recommended pairs are: AUD/USD, AUD/CAD, AUD/CHF, AUD/JPY, AUD/NZD Timeframe H1
Hi there,
I am a 51 year old, young at heart trader who has been involved in active trading since 2009. In the beginning I had a lot of different strategies. Sometimes more, sometimes less successful. I honestly admit th
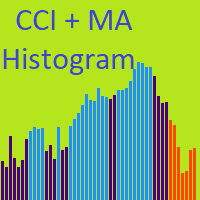
The indicator consists of a base of the standard CCI and levels calculated on the basis of MAs, which move following the price. To strengthen the trend movement, the deviation coefficient is used. To exclude triggering in a flat, the minimum trend limiter is used. Signal arrows are displayed on the indicator chart and the price chart - everything is turned off. There is an arrow trigger function - the arrows alternate when it is turned on. You can display signals on a chart, on e-mail and on a m

The regression channel is one of the most popular technical analysis tools among traders. First, the indicator draws a trend line between two points, then on its basis it builds a channel of two parallel lines, which will be at the same distance from the regression line.
The term linear regression belongs to the field of statistics. The center line of the channel is the trend line. To calculate it, the least squares method is used. The line above the center line acts as resistance for the pri
Introduction
The Convergence Divergence Suite contains 17 indicators , built-in MT4 technical indicators and custom ones . The list will be increased in subsequent versions as per users' requests. Any selected indicator is loaded on your chart then automatic Convergence and Divergence trend lines are drawn on the chart and indicator. This tool is important if you use any of the listed indicators or convergence/divergence in your strategy. Advantages With the Convergence Divergence Suite you

Lizzy Broken is a financial market indicator for META TRADER 4.
LizzyBroken's function is to show the daily channels on the graph of the inserted pair. Through the channels, Lizzy does a brief breakout analysis and provides you with a BUY and SELL area followed by TAKE PROFITs (TP) and also StopLoss (SL).
Lizzy Broken also provides a stat on the upper left side showing the previous day's high/low and also as text showing the BUY/SELL areas with TP/SL.
LizzyBroken indicator is perfect to b

Indicator Help to Show About CCI Multi Timeframe. ( 1M , 5M , 15M , 30M , 1Hr, 4Hr, 1D)
You can change period as you want.
CCI indicator
The commodity channel index (CCI) is an oscillator indicator that helps show when an asset has been overbought or oversold.It helps you identify peaks or troughs in an asset's price and can indicate the weakening or end of a trend and a change in direction.This means a you can, in theory, enter a trade right as a trend is beginning, or exit an existing tr

Footmarks trend MQ4 (FTMQ 4) Footmarks trend MQ4 ( FTMQ 4 ) is a MetaTrader 4 Expert Advisor that allows you to use a combination of "Price Trend Method" and "Time allow to trade" to fully automate your trading with Dynamic Grid Strategy. This is a GOLD / XAUUSD trader's expert. Real-time results can be viewed here . Unique Features Dynamic GRID MARTINGALE allows Set SMART-Loss turn ON allow Recommended Info Symbol
XAUUSD / GOLD Timeframe
M15 Settings
Default Lots Size 0.01 Minimum Dep

MA Cross indicator by 4Umbella
Create for traders both experienced and inexperienced to use it because it is a basic indicator
How to use : 1. MA Fast : Moving Average fast (Period 4 upto 50) 2. MA Middle : Moving Average Middle (Period 10 upto 100) 3. MA Slow : Moving Average Slow (Period 50 upto 200) to control trend markets.
and trader can be set for Apply to price (Close, Open,Low,High,Median,Typical,weightd)
For alert you can set to alert Next bar or instant bars.
The work is

Description
Trend Influencer is an indicator that determines the potential dynamics of the influence of trend wave movements on the market. The indicator is based on the value of moving averages corrected by the standard deviation. The indicator is displayed as a main dash-dotted moving average and a signal solid moving average. The signal moving average is colored blue or red depending on what type of trend is currently observed in the market. The indicator also draws inhibition levels - blue

This EA is an EA that let you decide the risk.
Currency pairs and timeframe Recommended pair: AUDUSD Recommended timeframe: M30
EA is working with trend that is build with a complec system of different indicators and priceaction. It protects your account with a safe stoploss, and ofcourse take profit level. There is also an Autolot function that lets the EA adapt to your account size when it grows.
We developed this EA for 10 month ago, and nothing is changed since. In other words, th

Sniper Mania Pro is an automated expert advisor that specializes in the basics of relative strength index in the market. It can be used in the MT4 platform. If you enjoy trading with an EA that is equipped with a relative strength index indicator, this robot may be useful to you. With proper sniping, you get to trade with a relative strength index in the market. It can be used for major currency pairs such as EURUSD, USDJPY, GBPUSD, NZDUSD, AUDUSD, etc. It can also be used for minor currency pai

The arithmetic mean or median can be used to determine the measure of the central trend of a time series. Both methods have some disadvantages. The arithmetic mean is calculated by the Simple Moving Average indicator. It is sensitive to emissions and noise. The median behaves more steadily, but there is a loss of information at the boundaries of the interval. In order to reduce these disadvantages, pseudo-median signal filtering can be used. To do this, take the median of a small length and rec
MetaTrader 플랫폼 어플리케이션 스토어에서 MetaTrader 마켓에서 트레이딩 로봇을 구매하는 방법에 대해 알아 보십시오.
MQL5.community 결제 시스템은 페이팔, 은행 카드 및 인기 결제 시스템을 통한 거래를 지원합니다. 더 나은 고객 경험을 위해 구입하시기 전에 거래 로봇을 테스트하시는 것을 권장합니다.
트레이딩 기회를 놓치고 있어요:
- 무료 트레이딩 앱
- 복사용 8,000 이상의 시그널
- 금융 시장 개척을 위한 경제 뉴스
등록
로그인
계정이 없으시면, 가입하십시오
MQL5.com 웹사이트에 로그인을 하기 위해 쿠키를 허용하십시오.
브라우저에서 필요한 설정을 활성화하시지 않으면, 로그인할 수 없습니다.