MetaTrader 4용 유료 Expert Advisor 및 지표 - 222
MACD Swing Low Multi Time Frame Indicator is one of the most advanced indicators based on both Swing Low and MACD trading strategies. It supports multiple timeframes, i.e. by attaching the indicator on a single chart, one can see the MACD Swing Low values for all the other timeframes on a single chart. One would just have to select the timeframes, for which he wants to see the calculated values.
Features On the chart, one can set the option to view the MACD Swing Low calculated values and the
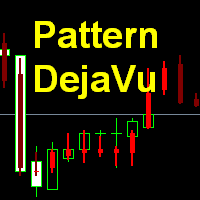
This indicator predicts the nearest candles of the chart based on the search of up to three best coincided patterns (a sequence of candles of a given length) in the history of the current instrument of the current timeframe. The found patterns are aligned with the current pattern at the opening price of the current (last) candle . The predicted candles are candles following immediately for patterns found in history. Pattern search is performed once every time a new candle of the current tim

The ' MTF MA Cross ' indicator comes from the time tested 'Moving Average Cross' strategy with several options available. The strategy in itself is one that was derived from rigorous testing on what was profitable in a moving average cross.
Key Features This indicator contains a fast and slow Moving Average cross with MTF & filtering settings. There are additional settings to filter signals out with how many bars and how many points. Indicator can be no-repaint when set with open prices & NewB

The 'OHLC Breakz ' indicator was developed to show breakouts of reversals with custom price action patterns. The arrows show price action of reversal conditions with trendlines which indicate long term trend formations.
Key Features Custom price action pattern indicating a reversal/breakout from the prior bar. There are visual options available as well as modes which are all non-repaint. Non-repainting signals presented at the beginning of a new bar and at bar 0. Showcasing support & resistanc

The indicator shows the levels of the past week and day. In addition, it draws a level in percentage. This level is specified relative to the difference between the High and Low of the past month and week. For the daily levels of the past day, the Close levels are additionally displayed. All you need to do is configure the display parameters of the levels to your liking.
Parameters Over the past months installations - settings for the last months;
PasteMonthsLines - the level display mode is

MACD BBands is a trading system based on MACD and Bollinger Bands placed in a single window. The indicator shows moving average slope angle (trend) change, compares their ratio (convergence/divergence) and allows sorting out signals using Bollinger Bands. The indicators are calibrated in such a way that the middle Bollinger Bands line is the zero level of the MACD indicator.
Parameters
Period - Bollinger Bands period; Deviations - number of standard deviations; Shift - shift relative to price
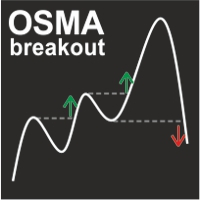
OSMA Breakout indicator displays signals formed at the time of overcoming the previous extremum of OSMA while simultaneously forming the extremum point on the price chart. If the extremum of the previous wave is punched, but the price remains in flat (in a narrow range), the signal is not displayed. This approach allows you to reduce the number of false signals in a long trend and the divergence of the indicator. The indicator works on any trading instrument and timeframe.
Parameters Fast EMA

This indicator displays the ZigZag Pointer Fibonacci Expansion Triangle movements timeframes only M1-W1.
Parameters InDepth: Displays the Depth movements. InDeviation: Displays the Deviation movements. InBackstep: Displays the Backstep movements. Fibonacci Expansion: Displays the Fibonacci Expansion movements. Fibonacci Expansion true.(false) Triangle: Displays the Triangle movements. Triangle true.(false) How to understand the status: If the Triangle is green, trend is up. If the Triangle is

The indciator helps you find a broker with the best spread. This is a tool for monitoring a spread continuously on the chart. The tool records the spread value on each bar and re-draws the chart line in the bottom window. The best feature of the tool is that it recalculates the percentage and re-draws the bar chart of each spread value to identify the spread values that appear most during the monitoring period. In addition, the tool saves the diary into the csv file. Please watch the instruction

This indicator displays in a separate window the difference between the number of points which increased the price, and the number of points that decreased the price during the time interval specified in the settings. The time interval for calculation is expressed as the number of bars of the chart the indicator is attached to. This approach allows you to evaluate the movement direction (growth or fall) of the instrument's price, the strength of the movement and the size of the movement in point

This Stacker EA will: Automatically set Stop loss on a new order Automatically set Take profit on a new order Stack (or open up to 4 additional orders at the same time) when a new order is placed, the SL/TP can be preset individually for each order. Provides a transparent replacement for the standard 1-click trading buttons in MetaTrader 4 (1 click still works and SL/TP will automatically be set as well as Stacking). Automatically calculate lot order size according to preset risk management perc

This panel is a one stop solution to all your trading problems Trading made easy. This panel allows trader to place orders (instant or pending) and close the respective orders (ALL, PROFIT, LOSS) just from one panel Traders can use it to make any type of trade on the chart itself
Description Close Order All - close all open orders. Profit - close profitable ones. Loss - close loss-making ones. Select Order Amount type (Lots, Money, Risk%) Select Stop Loss Price SL Pips - distance in pips to s

This utility was designed for those traders who usually have several charts open at the same time. Rather than having to individually change the timeframe on each chart you can drop the "timechanger" on one chart and then with the simple press of a button, change the timeframe on all charts simultaneously. This will enable the trader to go through his charts much more quickly as he studies the markets. Of course you must be careful if you have experts or indicators that are timeframe dependent r

This indicator will show Buy (color Aqua) or Sell (color Magenta) arrow at the moment when a Long or a Short local trend (local to the current TimeFrame) is expected. The huge advantage is that the indicator does not have any input parameters. So, you will not waste your time and will not struggle to change them for different TimeFrames and currency pairs. This indicator is universal, but it will work better on H1 and lower TFs.

Every indicator has its advantages and disadvantages. Trending ones show good signals during a trend, but lag during a flat. Flat ones thrive in the flat, but die off as soon as a trend comes. All this would not be a problem, if it was easy to predict when a flat changes to a trend and when a trend changes to a flat, but in practice it is an extremely serious task. What if you develop such an algorithm, which could eliminate an indicator's flaws and enhance its strengths? What if such an algori

This Expert Advisor sends an email notification, generates an alert or outputs a message to the journal (depending on the settings) every time a new order is opened (buy, sell, limit, stop). It also sends a similar message about closure of orders. The EA can be useful for those who want to always be informed of which orders had been opened/closed on the account.
Expert Advisor Settings Notification_for_new_open_orders - sends notifications about new opened orders; Notification_for_new_closed_o

The Super Cross Trend indicator is designed for trend and signal trading. This indicator generates trend signals. It uses many algorithms and indicators to generate this signal. It tries to generate a signal from the points with the highest trend potential. This indicator is a complete trading product. This indicator does not need any additional indicators. You can only trade with this indicator. The generated signals are displayed on the graphical screen. Thanks to the alert features you can ge

Pivots Points are significant levels traders can use to determine directional movement, support and resistance. Pivot Points use the prior period's high, low and close to formulate future support and resistance. In this regard, Pivot Points are predictive and leading indicators. Pivot Points were originally used by floor traders to set key levels. Floor traders are the original day traders. They deal in a very fast moving environment with a short-term focus. At the beginning of the trading day,

Front running is a high frequency trading method of placing orders before large orders available in market book. This increases your chances to hit small take profit and eliminate stop loss behind the large order. This technique is highly profitable in comparison to most others, and is often considered to be illegal, if used by agents to make a profit at the expense of the client. Unfortunately, Forex does not provide the order 0book. Nevertheless, large orders influence price action in a simila

The I Return Signal indicator is a product designed for signal trading. This indicator works by using a number of factors such as a set of indicators, recent history data, bar combinations, price movements, custom filtering system and various algorithms. It uses all of these factors at the same time and generates turn signals. The signals are generated by calculating from the highest possible points of the signal. This indicator is easy to use and understandable. Thanks to the warning features,
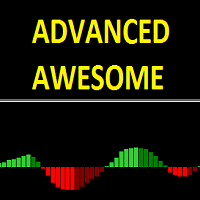
Advanced awesome indicator is a modified and advanced version of the standard awesome oscillator. With this indicator you can now make adjustments that you can not do on the awesome indicator. You can change and edit this indicator to suit your strategy. You can easily use it to recognize large and small trends.
Features The period can be set to define larger and smaller trends with the fast and period slow feature. You can change the input mode with the price mode. You can use Simple, Exponen

The Basket expert advisor can open up to 10 trades at once. It was developed for basket traders who need to open a lot of trades on many different pairs. Expert advisor allows to set a take profit and stop loss as a value in money for each basket trade. This EA is also equipped with hedge functions and allows traders to use the Classic hedge strategy or Sure-Fire strategy, also known as "Always in profit".
Main features Opening multiple trades simultaneously EA Works on any market (forex,

This is professional fractals indicator able to work "on several screens" while on a single chart. The product has been developed for scalpers and those relying on "accurate" entries. The indicator shows fractals from six timeframes and displays the distance between the price and a new emerging fractal on lower timeframes showing the price behavior more clearly and making its analysis more accurate on reversal points. The indicator displays fractals from the D1, H4, H1, M15, M5 and M1 timeframes

This powerful indicator intercepts 21 patterns simultaneously on 28 Pairs and on all timeframes. Just put the indicator on a single chart to see all patterns that appear on all pairs in all timeframes The patterns found are: For Bearish: Bearish Abandoned Baby; Bearish Engulfing; Bearish Harami; Bear Kicker; Dark Cloud Cover; Evening Doji Star; Evening Star; Shooting Star; Three Black Crows; Three Inside Down; Three Outside Down; For Bullish: Bullish Abandoned Baby; Bullish Engulfing; Bullish Ha
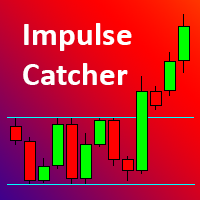
The Impulse Catcher Expert Advisor is based on the Impulse Checker indicator. The main operation principle lies in utilization of strong directional price movements. The EA opens positions the moment a strong directional price movement appears. The EA does no use hedging, martingale, grid and other risky strategies. The EA uses only tick data in its calculations, so changing the timeframe does not affect the entry and exit points. Use the timeframe, where you can easily monitor trading on the ac

Shark Surfer is a new generation indicator applying a well-established trend-following trading. The product is good both for scalping, as well as medium- and long-term trading. Shark Surfer analyzes a selected symbol and shows the recommended market entry, take profit and stop loss levels. Shark Surfer trades on all symbols and timeframes. It also features email and push notifications concerning the new trading signals. The indicator searches for suitable market entry points on an already formed
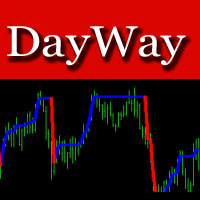
The DayWay indicator shows the current trend direction on the chart as a colored line. The best timeframes for operation are M5 and higher. Works on all currency pairs. Suitable for any scalping strategies. Quite easy to use.
Recommendations on usage When a blue line appears, wait for a candle to close and open a buy order. When a red line appears, wait for the current candle to close and open a sell order.
Parameters Periods - period of the indicator.
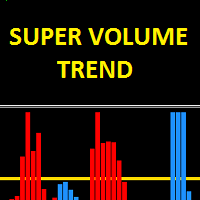
The Super Volume Trend indicator uses a set of algorithms and indicators. The purpose of this indicator is to find healthy trends with specific volume movements. It uses some filtering systems to find these trends. The indicator is easy to use, simple and understandable. This is a standalone trend indicator which does not need additional indicators. Users can apply it together with other indicators that are appropriate to their strategy.
Suggestions and working style The period settings have b

Hello, this EA is designed to scalp the market in the direction of the trend. I give you the ability to modify a lot of parameters in order to optimize the EA on different assets and timeframes. As a matter of fact, I noticed that the strategy is relatively adaptable among some Forex pairs and some assets from the daily timeframe to the 5 minutes one. I hope that you will be able to diversify your portfolio thanks to this skill. All backtests are done with a real tick database.
Parameters OBlo

Market Statistic Dashboard is an interesting tool for statistic analysis. This indicator scans the market and returns very accurate statistical analysis. The analysis is based on historical data. For example: it analyzes monthly chart and compares all the monthly charts in the past. The statistical analysis is run also on other TFs: weekly and daily ones. It is necessary to wait for the confluence of all timeframes to have a higher statistical certainty for the trading signal. Note: refresh your

Buy Market Scanner is a ready-made trading system, which shows the moments when it is necessary to open or close deals. Buy arrows appear on the zero bar without delay and redrawing. The same applies to signals for closing orders. They appear on the zero bar and are not redrawn. The number of profit or loss in points for a certain time period is displayed in the top right corner of the indicator. The indicator works best on the EURUSD currency pair with the H1 timeframe.
Operation Principles I

Smart order management during an account drawdown and competent exit from difficult situations and full control of positions - all this is Jupiter FX . The Expert Advisor is based on the original strategy, which allows you to efficiently take advantage of the price fluctuations. The EA buys low and sells high. If the price starts moving against the order, the EA tries to gradually close the losing orders. The EA does not use martingale, it gradually opens more orders with a fixed lot. If the pos
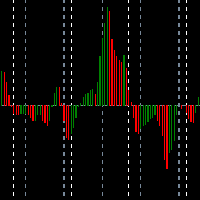
This indicator displays in a separate window the difference between the number of ticks which increased the price, and the number of ticks that decreased the price. This approach allows you to evaluate the movement direction (growth or fall) of the instrument's price and the strength of the movement. Set the time interval for calculation, expressed in the number of bars. The in real time uses only the ticks that arrive in real time, the history data are not analyzed.

This is a versatile Expert Advisor for trading on any currency pairs. The EA applies only Moving Average in trading. When a price retreats to a preset distance, the robot places a grid of pending orders and averages the profit while they are opened. A news filter has been added to the Expert Advisor! Recommended Usage Low spread; Currency pair - any (recommended - EURUSD and GBPUSD); Timeframe - М30; In the news filter settings, it is recommended to set 30 minutes before and 30 minutes after the

The indicator is designed for binary options. It produces a sound alert, after which you should instantly enter the market. The indicator operates based on signals form RSI and CCI, as well as support and resistance levels. When the chart is in overbought and oversold zones, the indicator finds a level in this zone and notifies you using a sound and a message.
Indicator Parameters dist - the number of points to generate a signal. Suitable values are from 21 to 50. Filtr_SMA - the filter, use
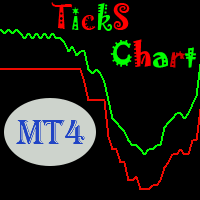
Ticks Line Chart is a professional indicator for the MetaTrader 4 platform. This indicator allows displaying a tick chart in a separate window, so that you can see price changes inside bars. Note that the Strategy Tester of the MetaTrader 4 trading platform only shows the static spread, that is why in in the tester the distance between the ASK and Bid prices will always be the same.
Indicator Benefits Perfect for scalping. A unique indicator, there are no free analogues. Using the flexible ind
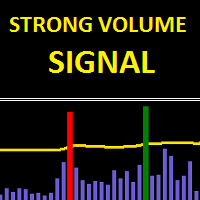
The Strong Volume Signal indicator is an indicator designed to generate trading signals. Using a number of price movements and a set of indicator properties to generate these signals. The purpose of this indicator is to generate signals from the highest probability of trading. Easy to use, simple and understandable to the user. Visually the user can easily recognize the signals. With alert features, user signals can be reached quickly. This indicator will not be repainted.
Features and Suggest
The WWCS Trade Information Indicator is designed to assist you with money management and provide you with important information about a currency pair both before taking a trade and after your trade is in progress. The trade information (such as recommended lot size for a desired percentage of your account equity, the amount of money at risk, etc.) takes quite a bit of time and knowledge to calculate and, because of the speed at which prices change, is out of date as soon as you've calculated it.

The Expert Advisor consists of four popular indicators: MovingAverage Stochastic MACD ZigZag It is possible to use all four indicators both together, and individually, selecting the necessary combination.
Basic settings of the Expert Advisor Magic - order magic number Volume - volume for opened trades Slippage - price slippage when opening orders. StopLoss - close orders after reaching a certain loss in points, TakeProfit - desired profit in points. TrailingStop - move StopLoss to order's open

This indicator is constantly calculating the probability of a trend. The result of those calculations is shown in the upper left corner of the chart. It is shown in a green color text if the trend is expecting to go Up, in a red text if the trend is expending to go Down, and in a white text if "no trend" is calculated. It can show cross lines in color of your choice or you can delete those cross lines by setting Cross color to "None". This indicator can show a radar vector in color of your choic

The Tick Vision indicator is a convenient tool for manual scalping. The indicator plots a tick chart in real time in a separate window. It is also possible to plot 2 additional ЕМА's of the price. Period for the ЕМА is the number of ticks. The indicator does not overload the system. You set the number of ticks to be displayed by the indicator. For even greater visual control, a grid with adjustable step is set, similar to the main chart. There are also period separators (1 minute) to control the
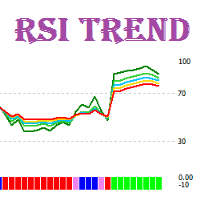
RSI Trend is a trend indicator that interprets the current market situation based on multiple RSI indicators with different periods.
Indicator Benefits Displays zones of an evident trend movement, overbought/oversold zones, as well as transition zones; Can be used in scalping strategies, as well as medium-term and long-term strategies; Has a minimum of settings; The standard line colors and selected for a comfortable operation with the black and white styles of the chart; Can be used in Expert
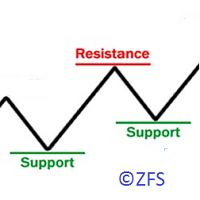
The indicator displays the resistance/support levels based on the history data of price action. It requires a depth of history to calculate the levels. The tool has been developed using an original proprietary technique. The resistance and support levels indicate the accumulations of orders.
Indicator Parameters Start Data/Time - initial date/time of the history data for calculation of levels Width of Lines Resistance/Support in Points - thickness (density) of lines in points, it is recommende

Expert Advisor based on the statistical analysis of price data.
Why Helios? No risky trading strategies. Works with 4 and 5-digit quotes. Multiple risk management profiles. No sudden deposit loss. Option to trade a fixed lot. Artificial intelligence processes the statistical analysis data. Few input parameters. No need to configure and optimize - the genetic algorithm has already done it for you.
How to use? Attach Helios to 6 charts with the M15 timeframe set: EURUSD, GBPUSD, NZDUSD, AUDUSD

The RSI.MACD Warden is a powerful indicator for MetaTrader 4 that uses a versatile algorithm to identify RSI, MACD, and Stochastic divergences. This indicator is designed to look back at a set number of bars and draw lines when a normal or hidden divergence is identified. The smaller the lookback period, the faster the indicator will be. The indicator can identify both normal and hidden divergences and is more accurate in identifying normal divergences. We've conducted a great number of tests t

This EA will open reversal order if the price hit the red line. eg: Buy ticket opened, if price hit below red line, buy ticket will be close and sell ticket will be open (lot size based on EA parameter setting)
Parameters Setting Monitor order with StopLoss set: if set to TRUE , order on same symbol with stoploss level will be closed if the stoploss line is hit if set to FALSE , order on same symbol with stoploss level will be ignored LotSize: Lot size for trade by EA new StopLoss position ran
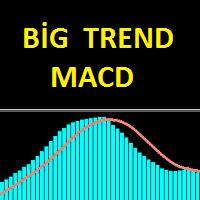
The Big Trend MACD indicator is an advanced model of the standard MACD indicator. It is very easy and simple to use. The main purpose of the indicator is to find great trends. With this indicator you can easily detect in small trends. This indicator can be used as two different trend finding tools for big trends and small trends. Try to use the big trends suggested, or with other suitable chart-appropriate indications.
Features and Trends This indicator has period, signal, period color, signal
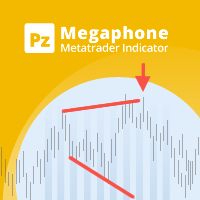
The megaphone pattern is another chart pattern used for technical analysis. There is usually a lot of volatility happening when you spot it in the wild….and volatility equals opportunity in the world of trading. This pattern is famous for its “broadening formation” and the price action also warns of the increased risk ahead. The megaphone chart pattern provides unique entries and exits off different sides of its structure.
[ Installation Guide | Update Guide | Troubleshooting | FAQ | All Pro

The EA is optimized for trading #FTSE and it is fully prepared for installation in the MetaTrader 4 terminal. No additional settings are required. The initial deposit must be at least 5000. The EA trades a fixed lot based on two indicators, Moving Average and Fractals. Deals are closed by TraillingStop or StopLoss. There are only two input parameters: MaxRisk - default is 70 Slippage - default is 3 For the correct operation of the Expert Advisor, an uninterrupted Internet connection is required

This indicator allows you to measure the profitability of each specific transaction (the ratio of Stop and Profit). The indicator allows you to adjust the ratio by step size and number of steps. You can build an unlimited number of ratios to compare the risks from different movements.
Note: in MT4, the number of horizontal lines in a single ratio cannot exceed 32.
Building a line : click the " Ratio " button and draw a line (mouse click - the first point of the line, where the mouse is relea

This StrongCurrency is a complete trading system based on a variety of technical indicators, moving averages and pivots. Each of those elements can be assessed in defined rules and coefficients (depending on the indicator) providing limitless optimization scenarios for the StrongCurrency. In order to work the StrongCurrency creates a trend strength and entry point signal list display by evaluating these data, that takes data from all symbols. It extrapolates all the information in order to get t

Forex Hunter a fully automated Expert Advisor. This EA based on Engulfing signal and Moving Average, Have a good winning percentage.The Engulfing signal means that current candlestick patterns fully covered previous candlestick. If the market and the order of the opposite direction, you can set the stop loss parameters. If you want to enable Martingale system, set the stop loss parameter above 1000 points. This EA have dynamic lot sizing (something like DynamicLots =10000, equity = 1000 > lot =
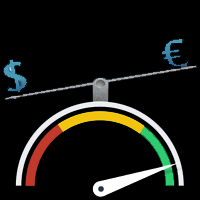
Strongest and Weakest Currency Analysis This product shows the strength of the main currencies in FOREX based on average pip gain/loss in different time-frames! Depending on the strength of the currency, the indicator colors changes from blue to red also the orders may also be changed, allowing you to find the strongest and weakest currency at a glance!
Advantages Whatever your trading method and strategy are, it is always important to choose the correct pairs, so this indicator will help you

The Expert Advisor consists of three popular indicators: MovingAverage; Stochastic; MACD. It is possible to use all three indicators both together, and individually, selecting the necessary combination.
Basic settings of the Expert Advisor Magic - magic number of orders; Volume - trade volume; Slippage - slippage when opening orders; Stop Loss - close order at a certain loss in points; Take Profit - desired profit in points; Trailing Stop - move StopLoss to order's opening price when a positiv

The Expert Advisor uses a trading strategy based on Fibonacci levels. On the levels of ~38.2,~50.0 and ~61.8, it sets virtual pending orders (Buy Limit, Sell Limit). A grid of virtual pending orders is built in trend direction. Trend is determined using the ZigZag indicator. Orders are closed at a total virtual take profit or a total virtual stop loss. The EA makes a decision at the opening of a new candlestick, so optimization can be performed using open prices.
Settings and Input Parameters

Background The EA trades a grid of orders using the martingale technique. It is designed for multi-currency trading. It opens and closes a large number of orders. My account monitoring: https://www.mql5.com/en/signals/author/mizrael
Advantages Trading results are visible every day. The EA works 24/5. Is not sensitive to trading conditions. Suitable for a rapid deposit boost. Ease of use.
Recommendations Use the EA on several pairs simultaneously. Recommended deposit 500 $. When using the EA

This indicator studies the price action as a combination of micro-trends. All micro-trends are analyzed and averaged. Price movement is filtered based on this averaging. IP_High and IP_Low (blue and red dashed lines) show the instantaneous price movement. They display the forecast only for the current price values, taking into account only the number of bars defined by the 'Filter level' parameter. SP_High and SP_Low (blue and red solid lines) smooth the price movements with respect to history.

The Signal MACD product is an indicator that works with the standard MACD indicator. This indicator is designed to do signal trading using the objective MACD indicator and a set of algorithms. This indicator can be used both as an oscillator and as a signal producing product. So you can use this indicator in two goal. When the indicator finds a signal, it shows arrow marks on the oscillator. These arrows allow investors to trade.
Trade Rules "Buy" action when you see a green arrow and receive

A powerful assistant for manual trading. Execute a deal with one click and manage the trade volume, stop loss and take profit, according to your trading strategy, without being distracted from the chart. The product can also visually preview your levels of entry into the market, stop loss and take profit before placing an order.
Advantages easy and intuitive interface the control panel in real time 3 modes of setting the order volume 6 stop loss setting modes 5 profit take setting modes calcul

This EA is the 28-common-pairs Scanner in the Forex Market. It based on the theory of 123 Pattern with a set of SMAs, Heiken Ashi for detecting Trade signals. You can choose any time frame to scan as you like.
123 Pattern Theory Buy Condition: Fast MA is above Slow MA (Uptrend confirmed) while Heiken Ashi pull back and begin to continue going up with the trend. Sell Condition: Fast MA is below Slow MA (Downtrend confirmed) while Heiken Ashi pull back and begin to continue the downtrend. (Attac

이 다중 기호 및 다중 시간 프레임 표시기는 다음 촛대 패턴을 스캔합니다(패턴 설명은 스크린샷 참조). 백병 3명(역전>연속 패턴) 검은 까마귀 3마리(역전>연속 패턴) 강세 및 약세 쓰리 라인 스트라이크(역전 패턴) 지표 설정의 엄격한 옵션이 활성화된 경우 패턴이 더 높은 기간에 자주 나타나지 않습니다. 그러나 그렇게 할 때 그것은 매우 높은 가능성의 설정입니다. Thomas Bulkowski(국제적으로 알려진 촛대 패턴의 저자이자 선도적인 전문가)에 따르면 Three line strike는 모든 촛대 패턴의 전체 성능 순위가 가장 높습니다. 고유한 규칙 및 기술과 결합하여 이 표시기를 사용하면 강력한 시스템을 생성(또는 강화)할 수 있습니다. 특징 Market Watch 창에 표시되는 모든 기호를 동시에 모니터링할 수 있습니다. 하나의 차트에만 지표를 적용하고 전체 시장을 즉시 모니터링하십시오. M1에서 MN까지 모든 시간 프레임을 모니터링할 수 있으며 패턴이 식별되면 실시간 경

MIRA is an Expert Advisor built according to the principles of indicator-less short-term trading based on martingale with different protection levels and customization. It provides methods for reducing risks by fixing a part of profit by trailing stop, smoothing out the gaps by means of dynamic locking, automatic recovering from drawdowns, buying out losing positions. A strict risk management system allows setting a limit on the allowed drawdown both as a percentage and in the deposit currency.

The indicator operates based on a unique candlestick pattern. When the indicator generates a signal, there is a high probability of price reversal, and we can use it in trading.
Indicator use strategy Market entry should be performed at the closure of the signal candlestick. Stop Loss should be set behind the signal cloud. We will have two take profits, the first one is equal to the stop loss value, 50% of lot amount should be closed at this level, and stop loss should be moved to breakeven. T

Signal Lock Scalper is a signal-based scalper with locking of unprofitable orders , followed by subsequent transfer to breakeven using profitable orders . The EA trades the trend strategy with the use of original built-in indicator for opening and closing orders. To protect the deposit from unexpected circumstances, the EA provides the ability to either lock all orders when reaching the specified drawdown levels, as well as setting a fixed stop order as an oppositely directed pending order. Ther

Samurai Scalping Indy is indicator signal strategy trading with Heiken Ashi, Smoothed Moving Average, and Ichimoku. It'll alert signal with an audio or pop up on the chart for Entry BUY/SELL and Exit BUY/SELL alert signal. Helpful for your system trading. Its easy use to filter major trend and help for scalping strategy to follow the trend. You can ON/OFF audio alert signal on the chart, Notifications alert on mobile, Email message alert. (Setting the alert on Mobile/Email in MT4. Go to Tools >>
Introduction to Double Harmonic Volatility Indicator Use of the Fibonacci analysis for financial trading can nearly go back to 85 years from today since the birth of Elliott Wave Theory by R. N. Elliott. Until now, traders use the Fibonacci analysis to identify the patterns in the price series. Yet, we could not find any one attempted to use Fibonacci analysis for the Volatility. Harmonic Volatility Indicator was the first technical analysis applying the Fibonacci analysis to the financial Volat

It is a simple indicator showing the moments of intersection of two Moving Averages, and it can be an indefensible tool for use in some trading systems. When the MAs intersect, the indicator draws arrows in accordance with the crossover direction and generates and alert.
Indicator parameters Period Fast MA - fast Moving Average period; Period Slow MA - slow Moving Average period; Method MA - Moving Average method; Apply to - price used for MA calculation; Alert - alert; Number of history bars
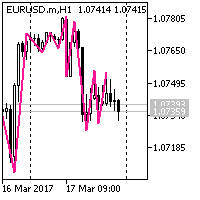
The ZigZag works as follows: On the left part of the chart, it finds a pivot point with the NumderOfBars parameter, which is a bottom. If the price action draws a top with the NumderOfBars parameter after this bottom, then the ZigZag draws a line from the bottom to the top. If the price action makes a new deeper Low, without forming a top, then the ZigZag extends the descending line to the new bottom. If the pivot point with the NumderOfBars parameter on the left side of the chart is a top, the
Ultimate Pips Recovery ( UPR ) is a unique, high quality and affordable trading tool, which is easy to use because knowledge of Forex trading is not much required to use this Expert Adviser. UPR does not require a specific time frame because it uses the technique that at every point, market will either go bearish or bullish. It opens a trade(say a buy trade) and immediately opens a sell stop position with a higher calculated lot size whose take profit is the same as stop loss of the previous ope
Price Line EA is an utility designed for manual trading. This expert advisor offers the ability to trade in automatic on your favorites levels. Default levels are created on chart when you upload the expert and after you can move them to your selected levels. When the market reaches the price levels, it opens orders. This algorithm allows an increase on risk management to grow your exposure. The utility opens operations with stop and reverse strategy, so place the levels on an important market r
MetaTrader 마켓은 과거 데이터를 이용한 테스트 및 최적화를 위해 무료 데모 거래 로봇을 다운로드할 수 있는 유일한 스토어입니다.
어플리케이션의 개요와 다른 고객의 리뷰를 읽어보시고 터미널에 바로 다운로드하신 다음 구매 전 트레이딩 로봇을 테스트해보시기 바랍니다. 오직 MetaTrader 마켓에서만 무료로 애플리케이션을 테스트할 수 있습니다.
트레이딩 기회를 놓치고 있어요:
- 무료 트레이딩 앱
- 복사용 8,000 이상의 시그널
- 금융 시장 개척을 위한 경제 뉴스
등록
로그인
계정이 없으시면, 가입하십시오
MQL5.com 웹사이트에 로그인을 하기 위해 쿠키를 허용하십시오.
브라우저에서 필요한 설정을 활성화하시지 않으면, 로그인할 수 없습니다.