MetaTrader 4용 Expert Advisor 및 지표 - 91

Tiger Grid EA is an expert advisor using trading strategy which has been developed by using machine learning concepts. It has passed 14 years of backtest of real tick data and real variable spread (with commission) from 2004 to 2018. The entries are usually accurate and in case if the trend signal has a delay the positions will be managed by a smart grid system. This system uses a grid of orders which increases lot size. A new order is added into the grid only if the EA notice a potential reve

The utility TradeKeeper Pro allows you to open a trade manually with a magic and a volume of your choice. It does not open its own trades, it can only open a trade by your command.
TradeKeeper Pro can trail any open trades by the iSAR (parabolic) indicator, and a simple trail. It can set the stoploss level at the open price as soon as possible. To trail any open trades for any instruments, it suffices to launch the utility in one chart. TradeKeeper Pro can close any trades or pending orders of

KT Auto Fibo draws Fibonacci retracement levels based on the ongoing trend direction. The Highs and Lows are automatically selected using the Maximum and Minimum points available on the chart. You can zoom in/out and scroll to adjust the Fibonacci levels accordingly.
Modes
Auto: It draws the Fibonacci levels automatically based on the chart area. Manual: It draws the Fibonacci levels only one time. After that, you can change the anchor points manually.
Usage: Helps to predict the future pr

KT Trend Magic shows the trend depiction on chart using the combination of market momentum and volatility. A smoothing coefficient is used to smooth out the noise from the signal.It can be used to find out the new entries or confirm the trades produced by other EA/Indicators.
Usage
Drag n drop MTF scanner which scans for the new signals across multiple time-frames. Find new entries in the trend direction. Improve the accuracy of other indicators when used in conjunction. Can be used as a dyna

Dark Sniper pointer indicator.
Complete absence of redrawing
The percentage of correct indicator forecasts depends on your settings; the default is period 7 (performed better)
The arrow indicates the direction of the next candle and the possible direction of the trend in the future. Suitable for small timeframes m1 and m5 It is recommended to open transactions from 1 to 2 candles. The signal appears on the current candle. Open a trade on the next one since the signal is being ge

Trump Day Indicator for Effective Profitable Binary Options Trading
complete lack of redrawing
The arrow indicates the direction of the next candle and the possible trend direction.
Percentage of correct indicator predictions from 80%.
its benefits:
signal accuracy. complete lack of redrawing. You can choose absolutely any tool. indicator will provide accurate signals.
It is recommended to open trades for 2 - 3 candles. Pros indicator: 1. forward signals. 2. high accuracy of the repo

KT Pin Bar identifies the pin bar formation which is a type of price action pattern which depicts a sign of reversal or rejection of the trend. When combined with support and resistance, BRN and other significant levels, Pin Bar pattern proved to be a very strong sign of reversal.
Basically, a pin bar is characterized by a small body relative to the bar length which is closed either in upper or lower 50% part of its length. They have very large wicks and small candle body.
A pin bar candlest

This indicator displays XR Power Trend movement.Indicator displays Moving Average period 5,Moving Average period 26,Moving Average period 52,Commodity Channel Index,MACD,Average Directional Movement Index,Bulls Power,Bears Power,Stochastic Oscillator,Relative Strength Index,Force Index,Momentum,DeMarker,average movement.Indicators period is standard period.
Features X - move the trend left and right. Y - move the trend up and down.
How to understand the status: If the Trend color is green

This indicator helps you to find price that may cause MACD Signal crossover on the current bar.. These crossover points are depicted in form of stars (like Parabolic SAR).
prevEMA line also helps you to decide the trend.
Get 20% OFF for rents for 1 year! How to use:
MACDSignalStars (Violet) stars displayed are the the prices that make the MACDmain = MACDsignal.
If the close price is higher than the star, then MACDmain > MACD signal. If the close price is lower than the star, then MACDmain

Scalping Trender ***Specialized for scalping trading on timeframe 5m & 15m***
work best with: **USDMXN m5 **USDMXN m15 **GBPJPY m15 **EURJPY m15 **USDTRY m15 **EURTRY m15
Scalping Trender use smart algorithm detects the price circles with time . give strong signals at the right time as result of combine the price and time.
our team spent months to develop this indicator specially for Scalping..with high success rates about 89% win trades .
Advantages Easy, visual and effective

This indicator displays entry and exit points in the market. The indicator is based on Parabolic and various mathematical and statistical methods to increase profitability and reduce the number of losing trades. The indicator helps in many cases to skip false inputs, the support and resistance lines go around the price in a certain mode, reducing losses. The dashboard shows the results of the indicator so that you can adjust it more accurately and see how the parameters affect the result. The

LeopardAdaptive is an advisor that works on the basis of candlestick analysis with simultaneous dissonance of three different embedded algorithms that determine the trend direction. The default settings of the advisor are optimal for working with four recommended trading instruments. The lot size or risk percentage can be selected by the trader. Every trade order has a stop loss and take profit. Recommended: EURUSD 15m, GBPUSD 15m, USDCAD 15m, USDJPY 15m. Settings:
Comment to order - comment

The Sensitive Signal ( SS ) indicator, using the filtering methods (which includes cluster multicurrency analysis) developed by the author, allows, with a high degree of probability, to establish the beginning of the true (filtered from interference - random price walks) trend movement. It is clear that such an indicator is very effective for trading on the currency exchange , where signals are highly distorted by random noise. The filtration developed by the author is carried out
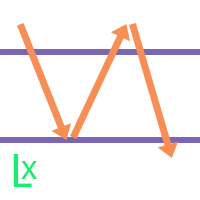
Hedge EA is developed to capitalize the market regardless of the direction it is moving. It starts with user-defined lot size for example 0.1, and gradually increase to 0.2 and so on (according to multiplier and maximum level setting) if the market reverse. The EA has several modes of entry for fine-tuned timing for example Trendline Buy that activates the first position only after price crosses the line. More importantly, the EA is equipped with a recovery management system that gradually close
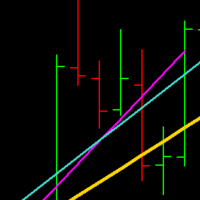
TrueRegression will calculate the linear regression of a given sequence of bars, and display the line of best fit on the chart. Regression is used to determine whether a market is currently trending, and whether sub-trends are occurring, which can hint at a potential breakout situation. The indicator will recalculate every 'n' bars (defined by the user input). When the indicator re-draws, it will keep the original lines on the chart, unmodified, so they can be referenced by a custom EA, or by th

Currency Dashboard Trader is a multi-currency trading system. It uses two sets of indicators across multiple time frames. Each set can be evaluated for trend following or reversal. The system calculates strength/weakness of currency pairs , and generates a list of pairs eligible for trading. The system also incorporates a trade manager that supports currency basket management.
Trading Modes:
Manual Mode: Dashboard in manual mode is used as an indicator for trade signals. Clicking a pair fro

This indicator will generate signal from other indicators like RSI, MA, Force Index etc into one confluent signal.
Which indicators to be used is up to the users to decide. You can add a simple MA, OsMa, RVI and ADX to see how these indicators will work out when combined together, an arrow will be drawn onto your chart where confluence happens.
And if that combination doesn't seem so good, then tweak the setting a little bit or remove it completely or add another different indicator, as you

This EA combines two built-in combined indicators (Bollinger Bands breakout and EMA Cross) to check the trends before performing any trading action. It is provided with: trailing Stop Loss; bad time to trade filter for each day of the week; define in minutes the profitable orders duration; define in currency values the profit to be taken; enable and disable martingale mode; define the maximum spread value to trade; define the minimum equity percentage to allow trading; the input values are alre

KT COG is an advanced implementation of the center of gravity indicator presented by John F. Ehlers in the May 2002 edition of Technical Analysis of Stocks & Commodities magazine. It's a leading indicator which can be used to identify the potential reversal points with the minimum lag. The COG oscillator catches the price swings quite effectively.
MT5 version of the same indicator is available here KT COG Advanced MT5
Calculation of COG The COG indicator is consist of the two lines. The mai

This indicator will allow you to evaluate single currency linear regression.
WHAT IS LINEAR REGRESSION?(PIC.3) Linear regression is an attempt to model a straight-line equation between two variables considering a set of data values. The aim of the model is to find the best fit that can serve the two unknown values without putting the other at a disadvantage. In this case, the two variables are price and time, the two most basic factors in the Forex market. Linear regression works in such a wa
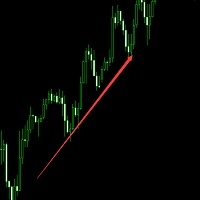
This is an automated Expert Advisor . EA uses advanced algorithms to find entry points and several additional filters to enter and exit the market. EA does not require optimization or any other configuration. parameter MagicNumber - EA ID to avoid interference with other EAs. Lots - Fixed single lottery UseMoneyManagement - Automatic order number MaxRisk - Risk as a percentage of the account's available margin MaxLotsPerOrder -MaxLotsPerOrder TakeProfit - Maximum Take Profit Points StopLoss - t
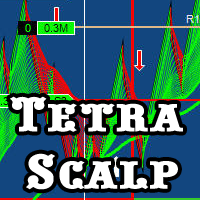
TetraScalp is an automated trading system using a smart scalping strategy. The basis of the system is fixing the fact of price consolidation in certain price channels with the definition of false punctures and straight-line trend movement.
The complex mathematical algorithm of the adviser allows you to work completely autonomously without additional manipulations. ECN-performance and VPS recommended.
Recommended use: EURUSD 15m, GBPUSD 15m, USDCAD 15m. Settings:
Comment to order - comments
Or (KVO) determines the long-term trend of money flow while remaining sensitive enough to confirm short-term reversals.It u ses the key price, and increasing and decreasing bars compared to the prior bar's key price and increasing and decreasing bars to assign volume and the trend as positive or negative values. Volume is a measure of how many units of a pair are trading per unit of time, while the increasing and decreasing bars are a measure strength of the trend the trend .The Klinger Volume O

This is a dial indicator for trading from the level of support resistance
--- complete lack of redrawing ---
He is able to determine the levels of support resistance
Finds the best entry points and shows them with arrows.
If a trend is forming, the indicator will always notify with a arrow signal.
buy signal blue arrow for sale red arrow
This signaling tool can also be used on a sideways market. The main thing is that it is volatile.!!!!!!
Good percentage of correct indicator pr

Brilliant Wall Street is a professional arrow indicator. It is based on a mathematical calculation. thanks to a special calculation algorithm that was developed by the best specialists
he is not late, moreover, he gives advanced signals.
-----------almost complete absence of redrawing------------. signals appear with the advent of the candle.
It is recommended to enter a trade for at least 1-2 candles on the next candle, but you can also use a signal...
The red down arrow indicates

Almas Wall Street is a professional arrow indicator with no repainting. Signals appear simultaneously with the formation of a candle. Trading Guidelines: Enter a trade for at least 2 candles or on the next candle after the signal for 1 candle. Screenshot 5 . A red arrow pointing down suggests considering sales, while a blue arrow suggests buying. All you need to configure are the colors of the signal arrows. It is recommended to apply this indicator in scalping on timeframes M1-M5. Signals occur

Introduction Professional traders use pivot points as support/resistance levels or as an indicator of a trend. Basically, a pivot point are areas at which the direction of price movement can possibly change. What makes pivot points so popular is their objectivity as they are recalculated each time the price moves further. The pivot points indicator implements 5 popular pivot points calculation and drawing: Standard – The most basic and popular type of the pivots, each point serve as an indica
Or (KVO) determines the long-term trend of money flow while remaining sensitive enough to detect short-term fluctuations.It u ses the key price compared to the prior bar's key price to assign volume as positive or negative value. Volume is a measure of how many units of a pair are trading per unit of time.You can choose between a KVO line, histogram, or both combined with this Klinger Volme Oscillator.The Klinger Volume Oscillator is a trend reversal indicator. It relies on the concept of a vol

Price Momentum Index (PMI) Price Momentum Index (PMI) is a powerful and easy to use indicator. It can use for any currency and timeframe. Features Noise reduction. Trend detection. No lag. Good entry point detection. Good TP guide line. All in one window, easy to use and make decision. How to Use Prepare entry - When the PMI line (aqua) is between Signal (yellow) and Sinal2 (red) line. Entry - When the PMI (aqua) line breaks through Signal1(yellow) or Signal 2 (red) line. Exit - When the PMI li

This indicator displays the histogram and arrows on chart. When Simple The Best Pro are placed on a chart, they identify the trend. The color of may be blue or red. The blue color stands for upside moves and the red color stands for downside trends. The indicator offers to set Stop Loss (SL) and Take Profit (TP) setting. The default value is ATR. Indicator has automatic optimization. The STB is a unique indicator that shows the tendency (button Bars) of a particular signals. The STB tells us

Duality is an autonomous automated trading system that does not use dangerous methods of trading (no martingale, no averaging, no increase in the lot).
The basis of the adviser's strategy is the correlation difference between candlestick formations and average price values at different points in time relative to the main points of the report.
Recommended use: EURUSD 5m, GBPUSD 5m, USDJPY 5m. Settings: Risk for Lot - risk percentage for the calculation of the trading lot; If MaxRisk = 0, lo

Foreign Currency Robox EA - the robot was created for traders who trade EURUSD. The default settings in the robot are for EURUSD. If you wish to trade on a different currency pair, you need to select other parameters in the settings of the robot. With the help of the new Stels_FX function, this robot is able to accurately determine the current price direction and predict the future trend direction. This robot is able to automatically adapt to the current market conditions using the averaging coe

Strong Scalper Pro by LataLab - scalper Expert Advisor is based on the author's formulas for analyzing volatility and the strength of price movement. This allows the flexibility to determine global and local trends in the market and their correction, to obtain the most accurate entry points. All of the basic algorithms of the adviser have passed multiple tests on historical data over the past 10 years, the principle of operation is maximally adapted to the dynamics and volatility of today's mark

MARKET PREDATOR 1 --------------------------------------------------- This powerful and reliable indicator is based on a custom trend following strategy. It does not signal against the obvious trend. No fancy and clouded charts. It is a simple but powerful BUY and SELL signals indicator. It is great for Day Traders and Scalpers too. Each currency pair works better with a specific timeframe so use the recommended timeframes with their respective pairs as below:
PAIR || TIMEFRAME =

This indicator allows you to analyze the hidden trends and correlations between the 8 most traded currencies via unique strength meter which creates multiple charts in a single window based on the price action of each currency in relation to all other currencies. The indicator also includes interactive panel where you can see the trends for all 28 pairs as well as the distance to the highest and the lowest price for the selected period. With this panel you can switch between currency pairs with

BeST_Trend Scanner is an MT4 Indicator that uses a proprietary algorithm in order to identify the most likely levels and probable moment for an upside or a downside trending price move.
BeST_Trend Scanner is a very useful tool that defines in advance and with a high statistical percentage of accuracy the subsequent Resistance & Support Levels of the anticipated upside or downside trending move of price and so
When used at its Reverse Entries Mode :
It generates Buy or Sell arrows at the

This is a Virtual Grid EA with positive (for traders) slippage. I recommend it for pair EURUSD. EA may be use as Rebate generator. Works ok during news and gaps (with depo >1000$). Working timeframe M1 .
Strategy The system does not use regular takeprofits and stop loss. Martingale is not used. EA use unique indicator (for open "Zero"). Monitoring (5EAs)
_ https://www.mql5.com/en/signals/508303 Parameters (one of the safest) Rebate Virtual Grid MM_Type 0 MM: 0-

Nemo Wave is a fully automated Expert Advisor with no use of martingale. It s base on Trend Averaging Strategy.
Set File : https://drive.google.com/open?id=1zZm8UgoiKEViWFJv_xCcv98HMpnWHu8W by Stunning EA (www.stunningea.com)
General Recommendations The minimum deposit is 10,000 Cent or USD1,000, recommend pair USDJPY or any pair with JPY . Use a broker with good execution and with a spread of 1-4 points. A very fast VPS is required, preferably with a latency of no more than 10ms.

The REVOLUTION Great Achiever FT - AUTO 1000 POINTS / 10 % ANOTHER EXCELLENT EA FOR YOU TO CONSIDER USING IT TO GROW YOUR INVESTMENT !!! THE REVOLUTION Great Achiever is suitable for the investors who want to have a simple and ready to use Expert Advisor (EA). This fixed EA Setting is modified and created from The REVOLUTION Simple Trade which has free customized Setting or Strategy Build EA which is suitable for experienced/advanced traders who have many ideas and strategies innovated system

The Expert Advisor builds a grid of orders at prices near support or resistance levels. Entry points are calculated by the EA using the author's algorithm and based on a variety of factors. The EA uses several time ranges for analysis. The built-in trend filter allows to make more accurate entries with a greater likelihood of closing them with profit and thus reducing the number of simultaneously open orders. All orders are closed upon reaching the expected profit. Through the use of TakeProfit

Pivots Channels Breakouts presents 16 different formulas for Pivots Levels. It draws each one of them and also draws specific channels, trend histograms, and SL/TP levels derived from them . It includes commonly used formulas as Classic, Woodie, ATR, Fibonacci, Camarilla and Demark Pivots, and also presents never seen before formulas based on the Padovan mathematical sequence. Price often reacts at Pivots levels, and at Resistances (R) and Supports (S) of these formulas. That is why a lot of tra

This positions risk visualization indicators, indicators allow you to clearly know price go back will be generated how much account Loss Percent. This is very useful indicator for Controlling Risk when account is open positions, attach this indicator to the chart of the open positions, this indicator will draw three Lines, the three Line of Loss Percent default value is 10% 30% 50% user can define their own Loss Percent value. Loss Percent corresponding Back Point will show in the upper
Moving Average Crossover Alert
This indicator uses two moving averages, fast MA1 and slow MA2, to indicate a change in trend or direction of movement.
You change the default MA's, one fast and one slower, to your preference.
An alert and a notification is sent once MA's cross each other. Note: you can change the default settings of the 2 moving averages.
I hope you will find this indicator very useful, as I do.
Trend Zone Break Alert
This indicator uses two trend lines, T1 and T2, to create a trend channel. You can move these trend lines anywhere on the chart in order to create your Trend Channel Zone, T1 must always be above T2.
An alert and a notification is sent once the zone has been broken.
Alert:-
If the alert is set to true, then when a candle closes above T1 or below T2 an alert will be sent.
If the alert is set to false, then when the Moving Average moves above T1 or below T2 an alert

BeST_Keltner Channels Variations & Strategies is an MT4 Indicator based on the original Keltner Channels Technical Analysis Indicator and it is a very useful Visual Tool that can display in the Chart all the known Variations of Keltener Channels and also the corresponding 10 totally Strategies i.e. all ENTRY signals (BUY and SELL) and also any corresponding EXIT signal, in which the Enrty and Exit Signals are derived exclusively by using Keltner Channels Variations. Every variation of K

The Predator
The Predator is a trading robot that uses a combination of various custom indicators designed to characterize trends. The Predator uses 2 take profit and stop loss levels. The Predator continually monitors the market after an order and will seek to close the order at MinimumTakeProfit under imminent unfavorable conditions otherwise it maintains the position until MaximumTakeProfit is attained. When the price moves past the minimum stop loss level a second compensating order is
MomentumX is a great tool for traders to find possible direction change and continuation in trend. MomentumX indicator inverts momentum and is best used together with Momentum found in your MT4(See picture 2) It can be used for short term trading and mid term trading on any timeframe and instrument.
Only setting is period and color of the line.
Check out my other products: https://www.mql5.com/en/users/tkjelvik/seller#products
To spot entries, you can trade crossover between MomentumX an
The EA's algorithm determines the stop / reversal trend levels by calculating the absolute difference between the wave segments in the last 48 trading hours. The RSI indicator plays a supporting role when deciding to open a trade.
Signal advisor in real time HERE . Recommended: EURUSD 15m for default settings, VPS server. Settings: Commentary to orders - Comments to orders; Profit in points - Take profit in points; Take% if> 3 orders - Take % profit if orders are more than 3; Risk for autolot

The used timeframe is M15. The EA optimized for all pairs: This is not a scalping robot. Every trade has fixed Stop Loss and Take Profit. NO Martingale / Grid involved. The optimum Lot setting is 0.01 for every 50 USD. You must have the current version running in MetaTrader 4. Settings Lots lot size is set by a user BuyUp indent from important price level. SellDown indent from important price level. UpTF Time Frame for UP UpL indent

Wait & See
Wait & See is a fully automated Expert Advisor. No manual trading is suggested. All screenshots belong to backtests with EURUSD H1 timeframe.
WARNING: Wait & See uses 1,2,3,4 and 5 as magic numbers. If you are using other Expert Advisors to send orders at the same time with Wait & See , do not use these preserved magic numbers for other orders.
Wait & See is based on three main steps: Open a new order, martingale if needed and take profit. Open new order: Wait & See uses the

This trading system is assigned to perform the tasks of a universal instrument, which is implemented: Trading currency pairs, binary options and the main types of crypto-currency pairs More than 10 strategies, including trading from levels, PriceAction, in the trading channel, news, standard and plug-in indicators, pre-prepared Analytics file, indicating the expected levels, stop losses and take profits, switching between which is made from the trading panel Various Deposit protection algorithms

One of the main components of successful trading is the correct determination of the direction of the market. This indicator shows the general directionality of the price movement and is painted in the corresponding color. Allows you to conduct trend and counter trend trading It works on all timeframes, on any currency pairs, metals and cryptocurrency Can be used when working with binary options
Distinctive features Does not redraw; Simple and clear settings; Works on all timeframes and symbo

The Advanced Trend Scalper indicator is designed to help both novices and professional traders. The indicator analyses the market and gives you buy and sell signals. It does not use any other indicators, it works only with the market actions. The signal appears right after the candle close and it does not repaint. The efficient algorithm provides a high degree of reliability of such signals. Advanced Trend Scalpe r for the MetaTrader 5 terminal : https://www.mql5.com/en/market/product/3334
Pokilopers - the finished trading system is presented as an indicator for the Metatrader4 platform. When added to a chart, Pokilopers automatically analyzes the situation on the market, determines the direction of the trend, resistance points, the price movement channel and other market factors that affect the current and future price movements. After that, Pokilopers automatically determines the most effective point for opening a trade and gives the trader a signal in the form of an arrow. Afte

Portia is a fully automated Expert Advisor. It is based on the scalping strategies. This system is suitable for sideways market and medium trend. The mechanism of this system is based on the principle of mean reversion and momentum of market price. The system automatically adjusts its settings to stop losses and profitability. This EA has been back tested for 5 years of real tick data (2019-2024). The EA does not use martingale, grids, hedging, averaging and other risky strategies.
Key Featu
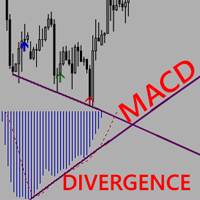
MACD Divergence with arrows complements the MACD indicator. It scans for divergence within the MACD oscillator then draws arrows on the entry points in the chart window. NB:The indicator does not bring up the MACD window nor does it draw lines on the MACD window. The screenshots are a mere description of how they work. The user will become alerted whenever a divergence is in progress and should WAIT for the perfect moment to make an entry. Perfect entries can be anything basic such as support an

Opening positions in the direction of the trend is one of the most common trading tactics.
This indicator determines the direction of the local movement and colors the candles on the chart in the appropriate color.
Allows you to enter the transaction at the very beginning of the movement
Thanks to the flexible settings you can use on any currency pairs, metals and cryptocurrency
Can be used when working with binary options
Distinctive features Does not redraw. Additional parameters for

Momentum Classic Live results: https://www.mql5.com/en/signals/579509
Momentum Classic is a completely automatic trading EA. It is a fact that market is mostly trading in range and high-power bursts are rare. These sharp movements are starting with momentum, which is a signal to trend start, increased volatility and trading volumes. We built a special algo, which seeks for such Impulse (Momentum) , to signal trade entry. Momentum Classic also has several filters, based on deviation fr

Ultimate Engulfing Bar Scanner (Multi Pair And Multi Time Frame) : ---LIMITED TIME OFFER: NEXT 25 CLIENTS ONLY ---46% OFF REGULAR PRICE AND 2 FREE BONUSES ---SEE BELOW FOR FULL DETAILS Nothing is more important than institutional price action and order flow.
And a strong engulfing candle is a clear indication that the institutions have flipped their sentiment.
Engulfing bar patterns are widely used by institutional traders around the world. As they allow you to manage
your trades with

Trend indicator with Multi-level Take Profit indication. Possibility to setting in normal or Aggressive mode. Fully customizable in color and alarm. Very useful to understand the trend and where price could go No need to explain, see the images. You'll se the trend, 3 possibly target and stop loss (or other take profit) when the trend change. You can adopt various strategy, for example. 1) Open trade and try to close it at target 1 2) Open 2 trade, close 1 at target 1, stop in profit for 2 and t

Trend Line Finder will project forward a support and resistance lines using 2 previous highs for resistance and 2 previous lows for support. It will then signal to the trader by alert making the trader more aware that a possible good move is about to happen. This is not a stand-alone trading system but is very useful in finding key areas of support resistance levels where price will usually either rebound from or breakthrough. Its down to the trader to decide what to do with use of other s

Definition Pompalamasyon is a fully automated trend trader that performs best on 1 Hour EURUSD Chart. This EA uses Simple Moving Average Indicator , Stochastic Oscilator, RSI and Ichımoku to define the trade direction and sends an order. While sending an order the EA sets the take profit and stop loss points. Pompalamasyon is not a scalper. There are no risky hedging or martingale strategies used. Recommendations EA Settings : Use default settings. Symbol : EURUSD. Time Frame :H1. Broke

This version of the indicator Floating Nest works only in the tester, on demo accounts and on real accounts on the USDCHF pair.
1. What is Floating Nest?
This indicator is designed to automate the construction of decision zones (can act as support-resistance levels) according to the Floating Socket strategy.
The same indicator allows you to significantly reduce the time when analyzing the behavior of prices in decision areas on historical data.
It works on any currency pairs. Time frame
FREE

1. What is Floating Nest?
This indicator is designed to automate the construction of decision zones (can act as support-resistance levels) according to the Floating Socket strategy.
The same indicator allows you to significantly reduce the time when analyzing the behavior of prices in decision areas on historical data.
It works on any currency pairs. Time frame: M1-H1.
The NEST trading system (Nest) is notable for its simplicity and efficiency when trading currencies, stocks, indice

The Revolution Target Achiever FT - Auto_Setting 1000 Points Hi all Investors and traders, We've just updated this EA to a new version 3.0, which has a much more benefits , for Investors who want to run this EA 24 hours using vps can try the Auto_Setting to achieved 1000 Points or 10 %, for traders who have their own set up and target 1-100% can use the manual_setting, THE REVOLUTION Target Achiever is suitable for the investor who want to have a simple and ready to use Expert Advisor (EA). Th

The MTF MA Trend indicator is an advanced model of the moving average indicator. With this indicator, you can follow the moving averge inductor in the multi time frame from a single graphical display. This indicator shows 7 different time zones on a single graphical display. This display is designed in oscillator style. It is also a new generation trend indicator.
Features It can work in 7 different time zones. different color settings can be made for each time zone. each time zone has a level

Super MA Trend indicator is an indicator designed to find trends. It uses a moving average, a set of candle combinations and High/Low levels to find trends. This indicator is a complete trading system. You can trade with this indicator as you like.
Features and Recommendations You can use this indicator on all pairs except for the volatile pairs. It is recommended to use it on M15 and over graphics. The most important element in this indicator are alerts. Do not open orders unless you receive

This positions risk visualization indicators, indicators allow you to clearly know how much price go back will be generated account Stop Out.
This is a very useful indicator for Controlling Risk when account is open positions, attach this indicator to the chart of the open positions, the indicator will draw a Line Of Stop Out Price on the chart, and output Stop Out Point Value in the upper left corner.
Stop Out Price can give you clearly know what price is Account Stop Out, can give

Arrow indicator, to determine adjustments and local trends
The arrow appears on the current bar and after closing the bar will not disappear.
Allows you to enter the transaction at the very beginning of the movement
Thanks to the flexible settings you can use on any currency pairs, metals and cryptocurrency
Can be used when working with binary options
Distinctive features Does not redraw. Additional parameters for fine tuning. Works on all timeframes and symbols. Suitable for trading c

Description: Please tick "Show object descriptions" in chart properties to enable hrays views
That utility converts a trendline into a horizontal ray known as tool for drawing supply and demand zones. Simply create a trendline on a chart and once selected, it will get converted. Ray remains horizontal while dragging.
Quick ray plot: press "R" key to create horizontal ray. It will be snapped to the nearest OHLC value
Further versions will be improved. For feature request please post new c
MetaTrader 마켓 - 거래자를 위한 로봇 및 기술 지표는 거래 터미널에서 바로 사용할 수 있습니다.
The MQL5.community 결제 시스템은 MQL5.com 사이트의 모든 등록된 사용자가 MetaTrader 서비스에서 트랜잭션을 수행할 수 있습니다. 여러분께서는 WebMoney, 페이팔, 또는 은행 카드를 통해 자금을 예치하거나 인출하실 수 있습니다.
트레이딩 기회를 놓치고 있어요:
- 무료 트레이딩 앱
- 복사용 8,000 이상의 시그널
- 금융 시장 개척을 위한 경제 뉴스
등록
로그인
계정이 없으시면, 가입하십시오
MQL5.com 웹사이트에 로그인을 하기 위해 쿠키를 허용하십시오.
브라우저에서 필요한 설정을 활성화하시지 않으면, 로그인할 수 없습니다.