MetaTrader 4용 Expert Advisor 및 지표 - 49
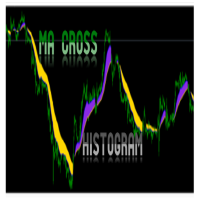
MA Histogram is MT4 Indicator for beginners which plot a histogram after Moving Average Crossover of 2 MAs. The Indicator does not have arrow or alert. It will simply plot on chart the potential Up and Down trend when trend is beginning or ending. It will show a Blue color for potential up trend and Gold color for potential down trend. Recommended pairs: All MT4 pairs including Indices You can change inputs to suit your Moving Average cross parameters and color for histogram.
Get for Forex MT
MT5 Version Advanced Range Breakout
Advanced Range Breakout allows you to trade breakouts in an impossible way for any human being. This EA focuses on entering breakouts as soon as the price moves over them, keeping a tight trailing stop loss (TSL) to catch as much as possible of breakouts' characteristic explosive price movements while protecting the trade if it turns out to be a fakeout. Feel free to get in touch we me to find out how I successfully managed to passed a prop firm challeng

Trend Lines contiuous Signal (FREE one WEEK) This indicator draws current trend line and provides Buy/Sell Signal based on calculations on Higher frame (Trend) and Lower frame(Entry signals)
* You should select the higher and lower frame for indicator calculations * You select the Trend line colors as you prefer * Enable or disable Alerts! Trend lines UP/Down are drawn when a trend is detected Wait for small arrows for entry : *Normally an UP arrow in an UP Trend is a BUY signal : ---you Clo
The Cross Period Moving Average Support Resistant Map puts multiple latest updated MA value in the same window.
Useful for trend and breakout traders to identify support and resistance at a glance. Highlighted with multiple line width for each period. MA type : SMA MA price : candle close price MA periods: H1 , H4 , D1 , W1 , MN
**if you have any enquiry, contact me at : pipsstalker1507@gmail.com
KFX RSI Dashboard uniquely monitors RSI levels on multiple currency pairs (selectable by you) at once and displays them in a two-column list of lower timeframe and higher timeframe (selectable by you). The currency pairs are the combinations of the major currencies (USD, EUR, GBP, CHF, JPY, CAD, AUD, and NZD). All the currency pairs are sorted automatically based on RSI Levels from this the indicator allows one of two output options:
1. Currency Strength OR 2. RSI Level
What's the Str

Introduction In the fast-paced world of financial market trading, success often hinges on the ability to spot and leverage trends. Among the various strategies available, momentum trading stands out as a powerful tool for traders seeking to capitalize on market movements. In this article, we will delve into the concept of momentum, its significance in trading, and the numerous benefits it offers to traders. What is Momentum?
Momentum in trading refers to the tendency of assets to continue movin

This MT4 indicator has been designed to be used on any currency pair, but not indices, on the ONE HOUR time frame only . This indicator has the highest win rate of all my indicators but it is not perfect and there is no holy grail in trading. The indicator looks for short-term high-probability trend continuations in price and will indicate you to go long (buy) or short (sell) if you see a green or red arrow next to the current candlestick respectively. The indicator paints an arrow when the spe

This MT4 indicator has been designed to be used on any currency pair or indices and on the daily time frame or higher . The indicator looks for medium-term high-probability continuations in price and will indicate you to go long (buy) or short (sell) if you see a green or red arrow next to the current candlestick respectively. The indicator paints an arrow when the specific criteria are met, however, you must wait until the current candlestick has closed until you enter a trade . Therefore you w

The Fractal U is a fractal EA based on a simple price pattern that is frequently seen in financial markets. A fractal is a recurring geometric pattern that is repeated on all time frames. From this concept, the fractal indicator was devised. The indicator isolates potential turning points on a price chart.
The Fractal U trades the possibility of a trend change. This is because fractals are essentially showing a "U-shape" in price. A bearish fractal has the price moving upward and then downw

This indicator is Strategy 2 of the Pipsurfer EA so traders can see where the EA would enter trades at and manually trade with the EA A Smart Money trend continuation strategy that's more moderate but this strategy includes candlestick price action and smart money institutional concepts to find trend continuation moves and hopefully to catch the BIG move that the Banks enter at. There are a full clues that large institutions give before entering and Pipsurfer Strategy 2 is designed to look for

This is the entry and settings for Pipsurfer EA Strategy 1 in an Indicator form. This was created to help users see the entries that Pipsurfer would take and for those who wish to manually trade the entries. Entry Strategies Strategy 1 - This strategy is a conservative strategy that incorporates trend market structure and momentum with each entry having to meet a large variety of market conditions. The goal of this entry is to buy at the lowest point of a trend pullback and sell at the highest

This is a fully automatic expert advisor. It opens trades in the direction of the trend and opens more trades in the set profit. Each trade is secured by a small trailing StopLoss. This EA achieves excellent results in many markets. The TimeFrame selected is not decisive. This EA will be profitable only with the best brokers with low fees and slippages. The maximum size of the spread is recommended at 2 points. Settings StartTrading - the start of trading every day EndTrading – end of trading

TrendPanel is an indicator that allows you to know the trend of a pair in a given timeframe using 2 moving averages. You can modify the period of the moving averages. Allows you to select which pairs you want to monitor in the input parameters. You can choose as many pairs as you like. You also decide in what time period you want to follow up, there can be several at the same time. In short, TrendPanel gives you the possibility of knowing the trend of a pair in a certain period of time without h

This indicator takes input from the RSI from multiple time frames (M/W/D/H4/H1/M30), and presents the output as lines above or below the price, on the main chart. Great for scalping. Features alerts for the current time frame's RSI (the Arrows). Settings: RSI period settings for M/W/D/H4/H1/M30/Current. (Set to your preference) PSar settings for trend determination; for current chart's time frame. How to use: Simply attach to M5 (Scalping - zoom chart out completely on M5) or use on higher time

The Fibonacci Bot uses Moving Averages working in combination with Boilinger Bands and MACD filters built in. The strategy is based on utilizing trend direction changes and optimizing order size. Whenever a trend direction change takes place, this EA would balance positive profits from the current trend orders with the negative loss orders and close all of the orders with the configurable profit in pips. This EA has flexible settings allowing you to modify: orders, lot sizes, order frequency,
Ea tw79 adx grid scalping automatic trading robot finds all healthy trading levels by putting all price movements in a cluster. The system closes with the total amount of earnings in dollars. Also, the reverse signal of the adx indicator has the ability to exit the trade with the shortest take profit target. It focuses on the grid system to work in the trend direction thanks to its control. The system works with 1-2-3-4-5.... progressive lot amount. The initial lot amount should be kept low. Opt
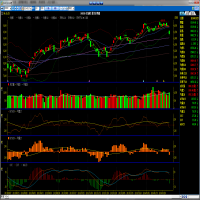
Stochastic Momentum Index is an adaptation of the classic Stochastic Oscillator that smoothes out the stochastic oscillations. This indicator is calculated by comparing the currency price relative to the average of an N number of periods. Then instead of plotting these values directly, We smooth them out using a MACD, Multiple Moving Averages and RSI indicators and then the values plotted to form the Stochastic Momentum Index. When the closing price is greater than the average of the range, the

My EA does not use any martingale or grid functionalities and follows a logical automatic concept. EA used one day one trade logic.
Forex Master EA finds its direction in the real data analysis and then follows this trend for the day. This expert advisor is designed to trade these trends especially in EURUSD pair M15. Recommended pair: EURUSD Timeframe :M15 EA also has News Filter Option for users who do not want to trade in News Times.
MT5 Version is HERE

*** This month's promotion price is $99 After that, the price will be raised to $199 FX Dragon North is an expert advisor specially designed for trading gold (XAUUSD M5). Execution is based on opening an order using the FX Dragon indicator , so the EA works according to the "Trend Follow" strategy. - Compatible with the FX Dragon North indicator for more accurate order entry. - Let this advisor profit for you (only use XAUUSD time frame with M5). - Leverage 1: 100 or more is recommended. - Lo

Displays multiple trend indicators on the main chart. Great for scalping. Settings: LWMA SMA SSMA EMA ADX (red and blue dots), and PSar Alerts for ADX crosses. How to use: Can be used on any time frame. Buy : - Blue dot first. - Then PSar and 3 MAs cross below price. **Best results when confirming the higher time frames too.
Sell : - Red dot first. - Then PSar and 3 MAs cross above price. **Best results when confirming the higher time frames too. Or backtest and use as you see fit for your str

Hello;
This indicator presents you with a power matrix of 28 cross pairs made up of the eight most voluminous currencies. Thanks to this power chart, it shows the pairs with the best trend strength and direction. The dashboard offers a basket trading method. So you can make an average profit by trading between pairs with certain correlations.
Input parameter descriptions:
Note_1: Indicates which method the dashboard will use to find the correlation.
Input parameter that allows you to se
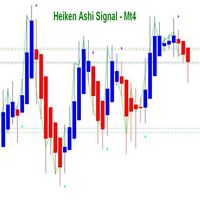
Heiken Ashi 신호 표시기는 MT4 거래 터미널을 위해 설계되었습니다. 표준 Heiken Ashi 표시기는 MT4 터미널을 기반으로합니다. 이 표시기는 매뉴얼 및 저작권 고문의 자동 거래에 사용할 수 있습니다. Heiken Ashi 신호 표시기를 사용하려면 거래 전문가에게는 시장에 진입하고 구매 및 판매 위치를 열기위한 신호 버퍼가 있습니다. 아래에 대해 자세히 읽어보십시오.
Heiken Ashi 신호 지표의 기회와 특성 : (M1, M15, M30, H1, H4, D1, W1, MN). (통화 쌍, 금속, 주식, 지수, 암호 화폐). 시장에 진입하기위한 기초로 신호를 받고 전략에 대한 고문에 신청하십시오. 시간이 지남에 따라 그는 추세가 시작될 때 가격의 전환에 반응하고 지연없이 신호를 제공합니다. 신호가 나타나면 이미 고정되어 있으며 일정에서 사라지지 않습니다. 표시기는 인근 막대에서 신호를 다시 그리지하지 않으며 막대에서 위아래로 이동하지 않습니다. 구매하기 전에

BlueZon robot mavi taralı alan içerisindeki mumları kontrol ederek işleme girer. Genelde bu alandaki mumların hareketleri BUY ve SELL girişleri tetikler. İşleme girmek için gerekli indikatörler 2MA MACD MINMAX MOMENTUM TREND1 TREND2 MA FİBONACCİ işleme (1 - 1+5) şekilde girer bunu ayarlamak kullanıcıya bağlıdır. İşlem zamanı ayarlanabilir. Kar alarak işlemden parçalı çıkılabilir.

Mumları tarayarak işlem arar yapay bir zeka gibi çalışır. (1 veya 1+5) işlem açar. Sadece BUY veya sadece SELL yönde işleme girebilir. Kullanılan indikatörler. 2MA MACD MOMENTUM FİBONACCİ MİNMAX TREND-1 TREND-2 Gerekli koşullar oluştuğunda işleme girer önce tek sonra istenilen yönde ilerliyor ise beş işlem daha açar . Parçalayarak kar alır. FİBONACCİ seviyelerini kontrol eder.
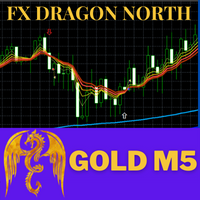
FX Dragon North Indicators is a trend indicator designed specifically for gold and can also be used on any financial instrument. Recommended time frame (XAUUSD:M5,M15,M30,H1,H4.) , (Forex: H1,H4,DAY) Can be combined with EA FX Dragon North X to increase the accuracy of EA FX Dragon North X and make more profit. ... SETTINGS Alerts - on off audible alerts. E-mail notification - on off. email notifications. Puch-notification - on off. Push notifications.

Please follow the "How To Trade" instructions exactly for best results Wycoff theory is vastly used by institutional traders but when it comes to retail traders the concept isn't well understood by most. It is even more difficult to implement in intraday & swing trading. This No REPAINT indicator helps you in analyzing the market cycles and plots buy/sell signals at the start of trending phase. It studies the market strength of bulls and bears and does a effort Vs reward matrix calculation befor
Pariteler(EURUSD M30) Fibonacci 2MA Momentum Trend1 Trend2 Support-Resistance-Pivot Parçalı kar alma Özel bir strateji ile yazılmış olan SCANNER yazılımı tarama yaparak gerekli koşullar oluştuğunda işleme girer. TakeProfit ve StopLoss bulunmaktadır. Martingalle ile işlem hacmini kar aldıkça arttırır. İşlem açıldığında dikey çubuk ile açılış tarihi ve saati ile ekranda uyarı verir. Ekranda bulunan bilgi ekranı ile kullanıcıya anlık bilgi aktarır.

Trend Capture는 고급 신경 분석 방법을 사용하여 기호의 현재 추세를 식별하고 거래를 시작합니다. 또한 Trend Capture에 의해 시작된 모든 거래를 모니터링하고 전문 거래자가 사용하는 다양한 전략을 따라 헤징을 수행합니다. 개별 포트폴리오를 관리하고 이익으로 거래를 마감합니다. Trend Capture는 귀하의 계정을 날려버릴 수 있는 Martingale, Grid 등과 같은 위험한 방법을 사용하지 않습니다. 결과는 스크린샷을 참조하고 구매하기 전에 테스트하십시오. 입력 설명 bot - Trend Capture 봇이 실행한 거래의 매직 넘버. 각 기호 및 기간 조합에 대해 항상 고유 번호를 부여하십시오. LotSize - 각 거래의 로트 크기를 실행해야 합니다. Trade_Comments - Trend Capture 봇이 실행한 거래를 식별하기 위한 주석 SpreadLimit - Trend Capture는 시장 가격으로 거래를 실행하므로 높은 스프레드에서 기호 거래를

FADI GOLD EA is a fully automated TREND BASED EA designed to trade GOLD only. After years of research and hard work this is the only profitable strategy to crush the XAU/USD PAIR. The strategy is very unique and the trade will only be in the right direction of the trend and executed once all the conditions are met. The EA is very safe to use once used with the recommended settings and you can consistently grow the account overtime (DM for special set file for maximum profit). this is a very sp

The Border Crossing expert system does not use the history stored in the database to work. For his own needs, he uploads historical data online, creating his own database. In order to achieve good results in the real ticks mode on the tester, it is necessary to carry out optimization. The expert system works with ticks on all types of accounts. For the internal algorithm, the elementary unit of analysis is a tick.
The internal optimizer, after optimizing according to the specified principle,

Idea Pro Trend Premium This EA is a Semi-auto Trading Panel with a variety of strategic settings, such as those listed below. It is excellent for scalping or long-term trading by traders. This EA is simple and convenient to trade and attach to the chart with the default settings on AUDUSD, EURUSD, GBPUSD and NZDUSD. Contact me immediately after the purchase to get the personal bonus!
How to use You can trade based on the trend that is displayed on the left-hand side of Info Panel. If the tren
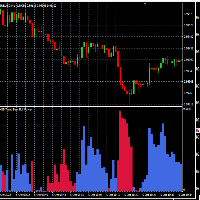
This indicator allows the visualization of the price movement in multiple chart times, as well as the Bull Market and Bear Market period and its corresponding strength.
Indicator Parameters TimeFramePeriod : Time frame TimeFrameAuto: Auto set next time frame FastPeriodCalc: Averaging fast period for calcule SlowPeriodCalc : Averaging slow period for calcule MultipleForce: force multiplier

Introducing the trend indicator! Ready trading system. The principle of the indicator is to automatically determine the current state of the market when placed on a chart. The indicator analyzes market dynamics for pivot points. Shows the favorable moments of entering the market with stripes. Can be used as a channel indicator or level indicator! This indicator allows you to analyze historical data, and on their basis display instructions to the trader on further actions. To find out how to dete

The Trend TRN trend indicator works using a special algorithm and a set of indicators. It finds the current trend based on many factors.
Trend TRN entry points should be used as potential market reversal points. The indicator works using the cyclic-wave dependence function. Thus, all entry points will be optimal points where the movement changes.
A simple and convenient indicator. The user can easily see the trends. You can use this indicator alone or in combination with other indicators ac

IMPORTANT : "Cange input Algo Mode from Testing To Scalp" Requirements Trading pairs XAUUSD Timeframe M 1, M5, M15, M30, H1 Minimum deposit $100 Leverage 1:100 Brokers Low spreads and zero stops level Features Fully automatic mode with adjustable inputs. Works by direct orders with hidden Advanced TP SL, Locking Profit, TrailingStop, Trailing Step, Trend Detect. Advanced algorithm for tracking position, time, volume, modification and exit. Filter for bad market conditions. T
Promotion $66 lifetime for you.
The principle of this indicator is very simple: detecting the trend with Moving Average, then monitoring the return point of graph by using the crossing of Stochastic Oscillator and finally predicting BUY and SELL signal with arrows, alerts and notifications. The parameters are fixed and automatically calculated on each time frame. Example: If you install indicator on EURUSD, timeframe M5: the indicator will detect the main trend with the Moving Average on this

This indicator uses 2 trend filters. Great for scalping. Features alerts Settings: TrendFilterPeriod1 TrendFilterPeriod2 How to use: Attach to any chart with default settings, or set to your preference. Can be used on any time frame. If used on lower time frames, check higher time frames too. Buy : - Blue histo color. Sell : - Red histo color. Or backtest and use as you see fit for your strategy. Best results on Major Pairs, but can also be used on other pairs (Metals, Minors).
Important to no

Main Features
Detect the best and most successful point of trend and reversal trend Easy-to-use Intuitive easy setup Scan the number of candles – Amount of history bars to evaluate Configuring not required Watches multiple timeframes for support and resistance Customizable Trailing stoploss and takeprofit Automatic Lot Size Optimization Suitable for any time frame Suitable for any currency pair
This EA is fully automated and easy to use. This robot uses Moving Averages working i

Main Features Detect the best and most successful point of trend or reversal trend Easy-to-use Stop Loss and Take Profit Scan the number of candles – Amount of history bars to evaluate Intuitive easy setup Configuring not required Suitable for any type of instrument Suitable for any time frame Suitable for any currency pair This EA is fully automated and easy to use. This robot uses Moving Averages working in combination with RSI and MACD filters built in. It is a dynamic EA that is very active
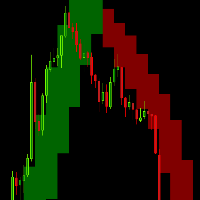
Anyone who is experienced in trading knows that longer time signals are trend signals. That's why it's always good to follow the trends of longer times to make a good trade.
With that in mind, I created the trend indicator in the background
Indicator Parameters TFBar - TimeFrame BackgroundEnabled - Enable Background NumbersOfBars - Numbers of Bar draw ColorUp - Color Up ColorDown - Color Down Smoothing - Heiken-Ashi Smoothing Average
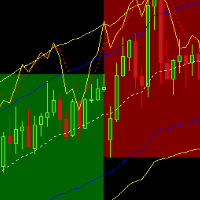
This indicator allows to observe the larger time trends and the stochastic channel on the chart
Indicator Parameters KPeriod - %K period. This is the number of time periods used in the stochastic calculation; DPeriod - %D calculation period Slowing - Slow K calculation period maPeriod - Averaging period maMethod - Averaging method maPrice - Averaging Price LineoverBought2 - line over bought 2 LineoverBought1 - line over bought 1 LineMidle - line midle LineOverSold1 - line over sold 1 LineOv

Twin Hunters is a bit risky but very profitble Expert Adviser.
Features This EA trades on both Trend Following and Contrarian Trading strategies, so it gains you profit in any market conditions. Frequent trades (it trades multiple times if the market conditions match). Weekend Filter Recommendation Symbol : XAU/USD Timeframe : 15M Minimum deposit : 5,000$ Low spread broker Settings Setting Instruction visual If TRUE, information board is activated
*When in use of strategy tester, it'll be q

What Is The Buy OR Sell MT4 Indicator? As the name suggests, the Buy-Sell Indicator is an indicator that tells traders about when to take the buy and sell position on the Forex price chart. This tool is a preference of many traders because it can provide solid indications of the trend and its reversals. In addition, it helps them simplify the hassle of choosing one or more indicators because this one tool alone is enough to provide them with a straight answer. When you apply this indicator

Hedge EA will turn your losing trades into winners using a unique hedging strategy. Once the initial trade moves into negative territory a predefined number of pips or change in signal, the recovery mechanism will kick in: it will place a limited amount of opposite trades at the signal, until all of them can be closed with a small gain. It can trade Crypto, Forex pairs, Metals, Indices but need you optimize. Fully automatic adviser, with a system for recovering from losses. You can choose to

PLEASE NOTE: You can customize the settings of all 3 EMA as per your requirement. The accuracy will change as per your settings.
100% Non repaint Pre-alert (get ready) signals Non-delay indications 24/7 signals 100% No lag No recalculating Lifetime license This is a EMA crossover indicator and its 100% non repaint indicator. The EMA_1 and the EMA_2 is based on which signal is generated. EMA_3 is a Higher EMA value which will remain below or above the candle (market) to identify the trend. M

This Robot allows the execution of orders following the trend, whether it is bullish or bearish, it has been tested in the EUR/USD pair in a time range of 8 years from from 2015 to 2022 with a few more than 1000% profit results, it has excellent capital management since it will depend on the The amount entered will also calculate the lottery to reduce the risk of loss.
The robot calculates the lottery from 100 dollars but it is recommended in accounts with a minimum of 1000 dollars The ro
MACD EXPLANATION Moving average convergence divergence (MACD, or MAC-D) is a trend-following momentum indicator that shows the relationship between two exponential moving averages (EMA's) of a price. The MACD is calculated by subtracting the 26-period exponential moving average (EMA) from the 12-period EMA. macd is one of the best momentum indicators macd is used by a lot of professional traders when it comes to continuous trade macd is the best choice if used properly even a ne
MACD EXPLANATION Moving average convergence divergence (MACD, or MAC-D) is a trend-following momentum indicator that shows the relationship between two exponential moving averages (EMA's) of a price. The MACD is calculated by subtracting the 26-period exponential moving average (EMA) from the 12-period EMA. macd is one of the best momentum indicators macd is used by a lot of professional traders when it comes to continuous trade macd is the best choice if used properly even a ne

Easy Technical Indicator is a powerful tool to detect the market trend and its strength . in addition, The signal Line reduce volatility and convert main trends to reliable Buy or Sell Signals --- Contact me in messages for free gift after purchase! --- HISTOGRAM:
It shows the main trend of the market. A histogram above zero means that the market is bullish A histogram below zero means that the market is bearish The height of the histogram bars indicates the strength of the trend weak,

Özel Stratejisi ile çalışıyor. Kullanılan işleme giriş İndikatörler(ATR-SAR-KAMA-RSI-TREND-ATR2) Lot ayarını.0. 20 başlattığınız da hedefini Kar Al giderken önce 0.10 daha sonra kalanın ardından 0.5 lot olacak 0.3 ve en son da 0.2 lot kapatır. Parçalayarak Kar alır. ATR ile takip eden Zararı durdur. Görsel Ekranda Kar-Zarar ve Sermaye -Bakiye bilgileri eklenmiştir.

Floating gain meter is the manual trading system that works with local trends and it's scalping. Histogram represents bull/bear floating trend gain. Green color histogram shows choppy market with bullish pressure, Orange - shows choppy market with bearish pressure. Lime and Red colors shows "boiled" places in market. As a rule buy arrow is placed after strong Down movement when it's power becomes weak and choppy market starts. And sell arrow is plotted after strong Up movement when it's power

Trend speed vector - is the oscillator for manual trading. System measures trend direction and it's speed. Histogram shows 4 colors: Lime --> Strong up movement with good gain speed; Green --> Up movement with low gain speed Red --> Strong down movement with good gain speed; Orange --> Down movement with low gain speed Green and Orange histograms show weak market's movements and thуese places excluded from signal points. Buy arrow is plotted during strong down movement when bearish gain speed i

Floating peaks oscillator - it the manual trading system. It's based on Stochastik/RSI type of oscillator with dynamic/floating overbought and oversold levels. When main line is green - market is under bullish pressure, when main line is red - market is under bearish pressure. Buy arrow appears at the floating bottom and sell arrow appears at floating top. Indicator allows to reverse signal types. Main indicator's adjustable inputs : mainTrendPeriod; signalTrendPeriod; smoothedTrendPeriod; tre

Precautions for subscribing to indicator This indicator only supports the computer version of MT4 Does not support MT5, mobile phones, tablets The indicator only shows the day's entry arrow The previous history arrow will not be displayed (Live broadcast is for demonstration) The indicator is a trading aid Is not a EA automatic trading No copy trading function
The indicator only indicates the entry position No exit (target profit)
The entry stop loss point is set at 30-50 PIPS Or the front

Triple trend index is the manual trading system/indicator. It looks for trend reversal points according to main trend index datas. Indicator represents 4 lines. 3 lines shows trend power by main market's parametres. 4th line (OrangeRed) is the main index. When line is above zero level - market is bullish, value below zero show bearish pressure. Indicator "looks" for weak places(reversal points) on bullish market to plot a sell arrow and weak places(reversal points) on bearish market to plot a

Impulse fractals indicator - is counter-trend oriented complex market fractal pattern. Market creates bull/bear impulse, trend starts, fractals on impulsed wave are an agressive pullback signals. Buy arrow is plotted when market is bearish and it's impulse showed up-side fractal, and sell arrow is plotted when market is bullish and it's impulse showed dn-side fractal. Main indicator's adjustable inputs : impulsePeriod - main period of impulse histogram filterPeriod - smoothes impulse accordi

TPM Cross (trend power moving cross) - is a trend following strategy based on custom signal points. Indicator consists from main custom moving chart line and trend power line. Indicator defines up and down movements by it's trend power and custom moving direction. When current market's trend looses it's power and opposite trend starts - power trend line crosses moving and indicator plots an arrow. Main indicator's adjustable inputs : movingPeriod - period of moving line trendPeriod - period

XFlow shows an expanding price channel that helps determine the trend and the moments of its reversal. It is also used when accompanying transactions to set take profit/stop loss and averages. It has practically no parameters and is very easy to use - just specify an important moment in the history for you and the indicator will calculate the price channel.
DISPLAYED LINES ROTATE - a thick solid line. The center of the general price rotation. The price makes wide cyclical movements around the

This indicator takes input from the RSI, combined with a trend filter. Great for scalping. Does not feature any alerts and is best used manually. Settings: TrendFilterPeriod RSIPeriod Set these parameters to your preference. How to use: Attach to any chart with default settings. Can be used on any time frame. If used on lower time frames, check higher time frames too. Buy : - Wait for blue histo color to cross above level 50, then open buys. **Best results when checking the higher time frames to
That is my master piece invented new Forex indicator Copyright 2010 to 2100 (316009) for Sami A. Saydam. This indicator is showing the real Support and Resistance levels in dynamical ways as movable red lines with time, also works on all time charts' intervals. The price movements are strongly respecting those red lines and either confirmed break them or just touching them and can't break them up or down then move toward the right directions. This new techniques are the real alerting system ca

EA SUPER MATAELANG PRO
See Live Result : https://www.mql5.com/en/signals/2040079?source=Site +Profile+Seller https://www.mql5.com/en/signals/2146550?source=Site +Profile+Seller
About EA:
This EA uses some very sophisticated indicators. Can detect trend direction with high accuracy. It also has a safety system to anticipate if the price direction is not in the same direction as the position. Using security in the form of an averaging or martingale system Best used in the m15 time frame. Th

The Th3Eng Ninja indicator is based on an analysis of the right trend direction with perfect custom algorithms. It show the true direction and the best point of the trend. With Stop Loss point and Three Take Profit points. Also it provides a secondary entry points in dots arrows style. And Finally it draws a very helpful lines from entry level to TP1, TP2, TP3, SL levels or the reverse signal, and all current/old signals status.
How to use the indicator
No complicated steps , Just follow 2

Taking as baseline Diamond Trend Indicator, which has provided good results so far detecting Trends , here is coming up a new Expert Advisor where DT and IHeOS Cloud indicators are working together. It is recommended to use 1:500 or above to mitigate typical margin default risks. Works in any timeframe for FX, GOLD/AUXUSD, BRENT... not tested with Indexes DIHeOST EA instance tracks its own operations, if you want to use more than one DIHeOST EA (and/or any of my other EAs) in the same accou

Advance Trend Intellegence EA is Powefull Expert Advisor base on trend following strategy. This expert using advance dynamical algorithm to cathching the market trend. With this EA orders that are made accurate entry orders in the market in tune with the trend signal. This EA have a good performance that has been tested more than 1 years with real ticks history data.
Although this EA can be use on any pairs, but please Use this EA on EURUSD Pair at M15 timeframe. Account type : HEDGE.
Adva

The KT Tether Line is a trend-following tool consisting of three indicators that work together to generate trading signals. It can correctly identify market trends while signaling trade entries. It was first introduced by Bryan Strain in the Stock & Commodities magazine in 2000 in "How to get with the trend and out at the end."
The Concept
When a market trend is confirmed, the most challenging part is determining the timing of the entries. This indicator alerts you to potential trend reversal

Robot FX-TR1 EA. examines the market.(EURUSD) There are TP and SL. First, it opens a single trade and opens other trades that you specify (1+1.1+2.1+3.1+4.1+5) at certain intervals in the direction of the trade it opens. You can set your risk ratio to 2-3-4-5%. It uses 8 indicators for profit. These indicators (BUY) or (SELL) give the same signal direction. Indicators:(MA1-MA2-RSI-MACD-TREND1-TREND2-MINMAX-VOLUME) and SUBRES instantaneously control. Period: M30 Pair: EURUSD Support-Resistance I

KT Forex Trend Rider uses a trend following algorithm developed specifically for the Forex market to provide reliable buy & sell signals across the major currency pairs. It works best on major FX pairs and all time-frames.
Features
It comes with a Multi-Timeframe scanner that can search for upcoming signals across all the time-frames. It comes with four preset profiles to facilitate trading for scalpers, tick-trend, swing, and trend traders. It marks the potential reversal points in the mark
KT XMaster Formula is a buy & sell signal indicator that works magically on most of the timeframes and currency pairs when used correctly.
The indicator uses calculations based on moving averages, RSI, and MACD. It is usually appropriate for scalping and trend trading - whether you are a novice or an experienced trader, the signals generated by this indicator are simple to understand and implement.
Overview The indicator comprises green and red dots arranged in wavy lines. These dots corre

In MetaTrader, plotting multiple horizontal lines and then tracking their respective price levels can be a hassle. This indicator automatically plots multiple horizontal lines at equal intervals for setting price alerts, plotting support and resistance levels, and other manual purposes. This indicator is suitable for Forex traders who are new and looking for chances to make quick profits from buying and selling. Horizontal lines can help traders find possible areas to start trading when the
The KT De Munyuk is a trend-based indicator that uses Parabolic SAR to identify the market direction. The indicator shows the PSAR in the form of green/red dots using a separate window. Buy Signal: When a green dot appears after a series of at least three red dots. Buy Exit: When a red dot appears on the current or next higher time frame. Sell Signal: When a red dot appears after a series of at least three green dots. Sell Exit: When a green dot appears on the current or next higher
MetaTrader 플랫폼 어플리케이션 스토어에서 MetaTrader 마켓에서 트레이딩 로봇을 구매하는 방법에 대해 알아 보십시오.
MQL5.community 결제 시스템은 페이팔, 은행 카드 및 인기 결제 시스템을 통한 거래를 지원합니다. 더 나은 고객 경험을 위해 구입하시기 전에 거래 로봇을 테스트하시는 것을 권장합니다.
트레이딩 기회를 놓치고 있어요:
- 무료 트레이딩 앱
- 복사용 8,000 이상의 시그널
- 금융 시장 개척을 위한 경제 뉴스
등록
로그인
계정이 없으시면, 가입하십시오
MQL5.com 웹사이트에 로그인을 하기 위해 쿠키를 허용하십시오.
브라우저에서 필요한 설정을 활성화하시지 않으면, 로그인할 수 없습니다.