MetaTrader 4용 Expert Advisor 및 지표 - 266

사용자 지침서 설명:
EA 툴킷을 발견하세요, 다중 통화 그리드 전략을 활용하도록 설계된 종합적인 거래 동반자로서, 실행 전략의 모든 기능을 갖춘 스위트를 강화시켰습니다. 이 정교하게 제작된 MT4 플랫폼용 전문가 자문기 (EA)는 시장의 트렌드와 뉴스에 신속하게 적응하는 지원 및 저항 지표로서 An Anchored Volume Weighted Average Price (AVWAP)를 사용하는 스캘핑 기능을 갖추고 있습니다.
주요 기능: 다중 통화 그리드 전략: 단일 그리드 설정 내에서 여러 통화 거래를 진행합니다. 스캘핑 기능: AVWAP를 지원 및 저항 레벨 식별의 지침 도구로 사용하여 트렌드 시장 조건에서 스캘핑 거래 방법을 배포합니다. 뉴스에 자동 적응: 이 EA는 시장 뉴스에 반응하도록 설계되어 있으며, 높은 변동성 기간 동안 귀하의 거래 전략이 유연하게 유지됩니다. All-in-One 실행 전략: 실행 전략 배열에서 선택하여 귀하의 위험 허용도와 거래 목표와 일치하

Break Even Trailing - A Simple Swing Trade & Scalp Trade Solution Break Even Trailing is an effective and simple program designed to enable a trader achieve break even and basic dynamic trailing stops on all positions. BET represents Break Even Trailing in the instructions below. (*) General Settings Overview: Trailing Mode : There are only two trailing modes. The Default Mode is set to Pip Based Dynamic, Mode One. This mode is the same as the typical Meta Trader Trailing feature that is
"Maxi Super Signal" - Your Ultimate MT4 Signal Indicator! Are you tired of missing out on profitable trading opportunities? Look no further! Introducing "Maxi Super Signal," the must-have MT4 signal indicator that will revolutionize your trading experience. Key Features: Accurate Signals: Maxi Super Signal employs cutting-edge algorithms to provide you with highly accurate buy and sell signals. Say goodbye to guesswork and hello to informed trading decisions. User-Friendly Interface: Our intuiti

스캘핑의 미래: Ultra Scalp FX - 이제 MT4용 우리의 전문가 어드바이저
Ultra Scalp FX로의 거래 혁명에 오신 것을 환영합니다. 이 놀라운 스캘핑 전문가 어드바이저는 이제 MetaTrader 4에서 사용 가능합니다. 주요 특징: 안전하고 고성능 전략: Ultra Scalp FX는 고확률로 서포트 및 저항 수준의 돌파 패턴을 기반으로 합니다. Martingale, 그리드 또는 헷징과 같은 위험한 전략에 안전한 모험이여서 작별!
맞춤형 자본 관리: 각 투자자는 독특합니다. 따라서 당신의 선호도와 투자 스타일에 적합한 자본 및 리스크 관리 설정을 통합했습니다. 보수적인 트레이더이든 스릴을 추구하는 트레이더이든 Ultra Scalp FX는 당신에게 적응합니다.
전문적이고 신중한 거래: 우리는 거래를 진지하게 생각합니다. Ultra Scalp FX는 기술적 분석과 지능적인 소프트웨어 개발로 뒷받침되어 있습니다. 각 결정은 철저한 데이터 및 분석으로 지원됩니다.
*** Introductory Offer! *** Ends soon - Price will increase - do not miss it!
This EA Closes ALL open trades ( with the same magic number on that same pair ) at a certain level of profit - either in money or in percentage of balance. So if you have multiple trades open, you can choose to close them all as one "basket" using this EA. For spreads from a tiny 0.1 pips RAW/ECN Accounts, click here . Check out my Waka Esque EA signal here: >> High Risk Settings or Medium Risk Settings .
Se

Global Intel Invest Gold Scalping EA work with gold scalping to give you best results.
Timeframe: Works with current timeframe you have set (BEST WITH M1 and M5) You can backtest as per your need
It will buy 0.01 lot per $100 and it will increase gradually as per the balance. ( If you have $1000 balance in your account it will trade with 0.1 lots)
If you have any questions or query reach us via skype: globaladsmedia / whatsapp: https://chat.whatsapp.com/Jn0ut8ywKLc3ES9TvC9wUJ  ; / e

Our EA works on RSI and gives you good results on below listed curreny pairs:
USDJPY USDCHF GBPUSD AUDUSD EURUSD NZDUSD EURCHF USDCAD ( These are the best pairs so far rest you can try and test )
Attach our EA on each pair manually.
Timeframe: Works with current timeframe you have set (BEST WITH M1 and M5) You can backtest as per your need.
It will buy 0.01 lot per $100 and it will increase gradually as per the balance. ( If you have $1000 balance in your account it will trade with 0.

This indicator is based on the RSI indicator
Also, some candlestick patterns are used in it to identify better signals
Can be used in all symbols
Can be used in all time frames
Easy to use method
Adequate settings
Settings: period: The number of candles used to calculate signals. alarmShow: If you want to receive an alert in Metatrader after receiving the signal, enable this setting alarmShowNoti: If you want to receive an alert on your mobile after receiving a signal, enable this setting Ala

Let us introduce you to a new era of neural indicators for financial markets! Intelligent Moving is a unique indicator that trains its neural network in real time! You no longer need to look for the optimal indicator parameters for each specific situation. No more late signals. The artificial intelligence is able to adapt itself and predict any market movements.
Visually, the indicator is drawn as a main solid moving average line, two dotted lines of standard deviations and signal arrows. For
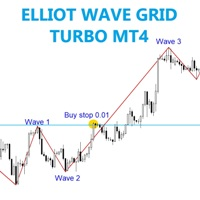
The EA trades will pending order when break price of wave 1 and run wave 3 . Best time frame 1h , Any pair any broker no limited, recommend minimum deposit 500$
SETTING Symbole - Set symbol to trade. Wave_depth - Set the wave size. Wave_deviation - Set wide of the wave. Lots - start lot. Multiple_lots - Multiply lot for next order. Max_lots - maximum lot. Grid_boost - Frequency of opening position (Less more order). Grid_minimum_pips - Check distance grid from last order. TP_pips - take

SuperOsma Arrow는 매수 및 매도 신호를 제공하는 슈퍼트렌드 osma 기반 지표이며, 지표는 다시 그려지지 않으며 신호 통계를 보여주는 대시보드와 함께 제공됩니다.
권장 기간: 15세 이상
매수: 매수 화살표가 열려 있는 막대에 표시되고, 차트에 그려진 대로 tp 및 sl을 설정합니다.
매도: 매도 화살표가 열린 막대에 표시되고, 차트에 그려진 대로 tp 및 sl을 설정합니다.
===============================
대시보드에는 내역 신호 정보가 표시됩니다.
1.승률 %
2.승자는 몇 명인가
3. 패자가 얼마나 많은가
4.연속 우승자 수
5.연패자 수
6. 핍 단위의 이익
============================
매개변수:
1.슈퍼트렌드 1주기
2.슈퍼 트렌드 1 승수
3. 슈퍼트렌드 2기
4.슈퍼 트렌드 2 승수
5. 슈퍼트렌드 3기
빠르게 변화하는 금융 시장에서 모든 초는 중요하며 모든 결정은 거래를 성사시키거나 망칠 수 있습니다. 바이너리 해커 지표(Binary Hacker Indicator)는 분 단위로 가격 움직임을 분석하는 방식을 혁신할 준비가 된 획기적인 도구입니다. 거래의 정밀도 밝히기: 바이너리 해커 지표는 일반적인 거래 도구가 아닙니다. 실시간 분석기 역할을 하며 차트의 각 분을 분석하여 트레이더에게 귀중한 통찰력을 제공합니다. 광범위한 수동 분석이 필요한 기존 지표와 달리 바이너리 해커는 거래 전략에서 추측 작업을 제거하고 순수 데이터에 기반한 계산된 접근 방식을 제공합니다. 매 분의 힘: 거래의 매 분을 분석하고 매수와 매도 압력 사이의 복잡한 균형을 이해할 수 있다고 상상해보세요. 바이너리 해커를 통해 이러한 비전이 현실이 됩니다. 이 독창적인 지표는 시장을 지속적으로 모니터링하고 매 분마다 상승 틱과 하락 틱의 수를 계산하여 가격 액션의 본질을 쉽게 이해할 수 있는 정보로 정제합니다. 독특
EA supports traders in order management. The operations to close partial and total orders are quick and convenient. You can move all profits and protect profits in $ or in points, automatically move losses and profits at will, and automatically place orders. take losses and profits. Easy-to-use interface. Streamlined design for professional investors!!!

Golden Hills FX USES THE TREND WAVE INDICATOR AND IT CAN IDENTIFY THE BEGINNING AND THE END OF A NEW WAVE TREND MOVEMENT.
AS AN OSCILLATOR, THE INDICATOR IDENTIFIES THE OVERBOUGHT AND OVERSOLD ZONES.
IT WORKS GREAT TO CATCH THE SHORT TERM PRICE REVERSALS AND USES A MARTINGALE STRATEGY TO CLOSE ALL TRADES IN PROFIT.
USE DEFAULT SETTINGS ON H1 OR HIGHER TIME FRAME ON ANY PAIR FOR MORE ACCURATE TRADES
WHY THIS EA :
Smart entries calculated by 4 great strategies The EA can be run on even a $3
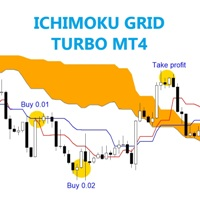
The EA trades reverse trend which T cross K line and take over from B line . Best time frame 30 mins, Any pair any broker no limited, recommend minimum deposit 500$
SETTING Symbol - Set symbol to trade. Tenkan_sen - Tenkan_sen value. Kijun_sen - Kijun_sen value. Senkou_Span_B - Senkou_Span_B value. Lots - start lot. Multiple_lots - Multiply lot for next order. Max_lots - maximum lot. Grid_boost - Frequency of opening position (Less = more order). Grid_minimum_pips - Check distance grid from la

Transform Your Trading with SmartFastTrade AI: Speed and Ease at Your Fingertips! Introduction Are you a trader struggling with slow order execution? Do you want a tool that can assist you in making quick and accurate trading decisions? If yes, then SmartFastTrade AI is the answer to all your trading needs. With its unique combination of speed, user-friendliness, and advanced features, SmartFastTrade AI will help you unlock your full trading potential. Let's delve deeper into why this innovativ

If you are good at trading at levels This indicator is all you need levels to manage your trades Market is usually follow current trend when break out some levels or reverse
Trade at the Institutional traders level with the best supply and demand zone indicator available in MT4 and MT5 The Secret Profit Levels Signals indicator for MT4 is a complete trading system that provides traders with the entry price and 2 take profit levels. Technical analysts use support and resistance levels to identi

GAMMA is a fully featured trade manager and account monitoring assistant that offers a variety of trade and account monitoring and mechanization functionalities vital to a trader’s toolkit. This assistant takes on all the mechanical parts of trading, freeing up more time for you focus on other activities that promote your personal and financial well-being. The trading functions GAMMA helps you to automate include:
equity monitoring and preservation
stop loss and take profit placement breakeven

Title: The Matrix EA - Expert Advisor Description
---
Introducing The Matrix EA, an advanced automated trading system designed to revolutionize your trading experience. This cutting-edge Expert Advisor harnesses the power of artificial intelligence and sophisticated algorithms to navigate the complex world of financial markets.
Key Features:
1. **AI-Driven Strategy:** The Matrix EA employs state-of-the-art artificial intelligence to analyze market conditions in real-time, adapting its strat
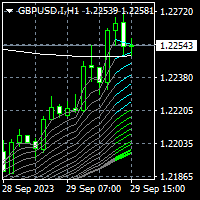
To get access to MT5 version please click here . - This is the exact conversion from TradingView: "CM Super Guppy" by "FritzMurphy" - This is a light-load processing indicator. - This is a non-repaint indicator. - This is not a multi time frame indicator. - Buffers are available for the lines on chart. - You can message in private chat for further changes you need. Thanks for downloading

Nice Price Signal is a powerful and easy-to-use MT4 indicator that provides traders with accurate and reliable entry and exit signals. The indicator uses a variety of technical indicators to analyze the market and identify trends and reversals. Features: Accurate and reliable signals: The indicator uses a variety of technical indicators to analyze the market and identify trends and reversals. This helps to ensure that traders are entering and exiting trades at the right time. Easy to use: Th

True Super Arrows is a powerful and versatile indicator that can help you identify and trade profitable trends. The indicator uses a combination of technical indicators to generate arrows that point to the direction of the trend. Features: Multiple trend identification methods: The indicator uses a combination of moving averages, trend lines, and other indicators to identify trends. Accurate trend direction: The indicator uses a variety of techniques to ensure that the arrows are pointing in

The Pure Cross Entry Signal Indicator is a powerful tool designed to assist traders in making informed decisions in the financial markets. This advanced indicator leverages cutting-edge algorithms and technical analysis to identify potential entry points with high accuracy. The indicator works based on instant price movements. This indicator is a complete trading product. This indicator does not need any additional indicators.
The indicator certainly does not repaint. The point at which th
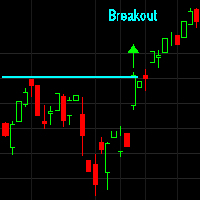
이것은 거래 시스템을 따르는 돌파 및 추세입니다. 이러한 종류의 시스템은 가격 모멘텀과 추세 지속성을 활용하려고 합니다. 모든 추세 추종 시스템은 외환 쌍, 주가 지수, 석유 및 가스와 같은 에너지 상품, 구리 및 니켈과 같은 산업 금속, 금 및 은과 같은 귀금속과 같은 상관관계가 없는 상품 바구니에서 가장 잘 거래됩니다. 이런 종류의 거래 시스템과 스타일은 이와 같은 거래 시스템으로 놀라운 결과를 얻은 악명 높은 Turtle's Traders에 의해 유명해졌습니다. 추세 추종 및 브레이크아웃 시스템으로서 자산 곡선은 평균 회귀 시스템보다 덜 규칙적이며 승률은 낮지만 승리하는 거래는 패자 거래보다 크며 적절한 거래를 하면 장기적으로 전체 이익이 일반적으로 더 높습니다. 시장. 이 시스템은 시스템 포트폴리오를 더욱 다양화하고 성공 가능성을 극대화하기 위해 평균 회귀 시스템을 실행하는 데 좋은 동반자입니다. 모든 거래 시스템과 마찬가지로 목표 시장에 대한 최적화 및 백테스트는 필수입니다

Easy and simple, Moving A utumn MT4 . You're the boss, watch, smile. Recommendations:
Currency pair: GBPUSD ,EURUSD ,XAUUSD. Use Currency : One . Timeframe: H4 Minimum lots: 0.15 Platform: MetaTrader 4
Profit : 250 -200
Minimum deposit : $1000 IMPORTANT: It is very impoportant to use LOW SPREAD accounts for best results ! VPS recommended Committed to Continuous Improvement: We are dedicated to continually optimizing and enhancing our to provide you with the best possible trading experi

Professional expert Status Trader analyzes the market using a special algorithm. The basic principle is that the bot takes the indicated prices for a certain period of time and calculates the strength and amplitude of the price by checking it with its own indication system based on actual data. The moment is fixed when the trend loses strength and reverses, and then the previous series closes and a new one is prepared. The bot also analyzes its own overbought/oversold signals in its algorit

The modern Fox Scalp bot works using sharp tick movements. Goes through the entire history and all currency pairs with one single setting. Unique trading system! You can work on any hourly period, any currency pair and on the server of any broker. It is recommended to work on liquid Forex pairs with a low spread. The lower the commission and spread, the greater the profit. You can start using it with 100$ and 0.01 lot.
Recommendations for working with a scalpel:
The MaxSpread parameter plays

Friendly Bot is a multi-currency, multi-functional advisor that works on any time frame and in any market conditions. - The robot’s operation is based on an averaging system with a non-geometric progression of constructing a trading grid. - Built-in protection systems: special filters, spread control, internal trading time limitation. - Construction of a trading network taking into account important internal levels. - Ability to customize the aggressiveness of trading.
The Expert Advisor comes

Are you tired of struggling in the world of trading? I've been trading for over 5 years, and it took me quite some time to achieve consistency. Right now, I'm successfully using this trading robot to generate passive income with my funded account on FTMO. I understand how frustrating it can be when proprietary firms profit from your setbacks. This trading bot can be your ticket to success by helping you meet the requirements of most prop firms. However, please keep in mind that I currently run i

Using signals generated by a single indicator can be risky while trading. This is because using just one indicator to trade can give more false signals. Thus, many forex traders used three or more indicators to filter out good trade setups. However, using multiple indicators for signals can also be complicating and confusing. This is especially true when these indicators are generating contradictory signals. The Super Arrow indicator, however, provides good signals by using multiple indicators.

With this automatic trading forex robot, trades are opened in the direction of the trend, regardless of which direction the price moves. In this video, it is seen that with a balance of $ 100, the forex trading robot made 100% profit in 2 months. This Forex trading robot opens Trend directional trading. This trading robot also hedges transactions. This trading robot opens trades according to the specified distance. Whichever direction the price moves, it continues to open transactions in that di

Готовый Инструмент для Трейдера с большим арсеналом технического аспекта, который будет помощником в торговле! Индикатор имеет буферные стрелки, алерт, возможность настройки нужных уровней сигнала, возможность торговать на пробой и ретест! работать можно на любом инструменте, и любом таймфрейме. Можно регулировать цвета линий что бы было приятно использовать этот инструмент в своём торговом шаблоне!

With the help of this Practica Trend forex indicator algorithm, you can quickly understand what kind of trend is currently developing in the market. The Practical Trend indicator accompanies long trends, can be used without restrictions on instruments or timeframes. With this indicator, you can try to predict future values. But the main use of the indicator is to generate buy and sell signals.
The Practical Trend indicator is used in the forex markets. One of the main definitions for monitorin
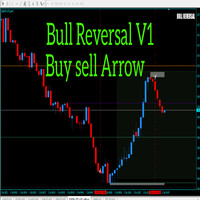
Alright. This indicator works on MT4 and is very easy to use. When you receive a signal from it, you wait for that candle with the signal to close and you enter your trade at the beginning of the next new candle. A red arrow means sell and a green arrow means buy. All arrows comes with a long dotted like for easy identification of trade signal. Are you okay with that?
100% non repaint
Work All Major currency Pair,
1 minute time frame 1 minute expire

Gold Bricks FX USES THE TREND WAVE INDICATOR AND IT CAN IDENTIFY THE BEGINNING AND THE END OF A NEW WAVE TREND MOVEMENT.
AS AN OSCILLATOR, THE INDICATOR IDENTIFIES THE OVERBOUGHT AND OVERSOLD ZONES.
IT WORKS GREAT TO CATCH THE SHORT TERM PRICE REVERSALS AND USES A MARTINGALE STRATEGY TO CLOSE ALL TRADES IN PROFIT.
USE DEFAULT SETTINGS ON H1 OR HIGHER TIME FRAME ON ANY PAIR FOR MORE ACCURATE TRADES
WHY THIS EA :
Smart entries calculated by 4 great strategies The EA can be run on even a $300

Sirius strategy for working on the Forex market with a scalping base.
The algorithm involves carrying out a trading operation in the shortest possible time. As a rule, this period of time is seconds and is only sometimes limited to several minutes.
There is an opinion that scalping is for beginners. But in fact, it is wrong. In order to carry out a trading operation correctly and profitably, a trader needs to learn scalping, otherwise the result may be negative. This is why using a bot is mor
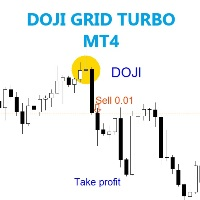
The EA trades when doji pattern were detected on chart. Best time frame 30 mins, Any pair any broker no limited, recommend minimum deposit 500$
SETTING Symbol - Symbole on your chart. Candle_size_pips - Size pips before doji born. Lots - start lot. Multiple_lots - Multiply lot for next order. Max_lots - maximum lot. Trade_boost - Frequency of opening position (Less number = less order , 1-100 value). Grid_boost - Frequency of opening grid position (Less number = more order , recommended 7

The Idiom bot (for EURUSD) works on the Metatrader trading platform, which is widespread in the Forex market. The bot is based on a complex transaction control algorithm. Many indicators are used as the main entry signal (Envelopes, ADX, Bands, MA, RSI, AD, Alligator, BearsPower, Fractals, Momentum).
Environment for the bot: Currency pair - EURUSD. TimeFrame - H1. The maximum spread is 20 pips. The required deposit is $10,000 (or equivalent). The maximum drawdown is 12%.
Peculiarities: Built-

The Bars Deflection trend indicator can be used with any trading pair and on any time frame. With this indicator it is impossible to miss the beginning of a trend. Use Bars Deflection as a standalone strategy or as an addition to yours. Signal arrows appear on the chart at the moment the bar opens and are located at the breakout level of the reverse movement. Thus, the arrows not only indicate the possible direction of movement of the quote, but also act as levels for analyzing the placement of
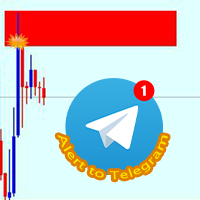
구역별 수동 거래를 위한 간단하지만 유용한 유틸리티인 Zone touch MT 텔레그램 알림은 가격이 거래자의 특정 관심 구역에 도달하자마자 텔레그램 채널의 스크린샷과 간단한 설명을 통해 사용자에게 알려줍니다. 사용자가 컴퓨터 근처에서 많은 시간을 낭비하지 않고도 특수 거래 구역을 사용하여 하루 또는 장기간에 대한 사업 계획을 쉽고 편리하게 수립하고 뉴스레터를 사용하여 차트의 중요한 변경 사항을 완벽하게 제어할 수 있도록 도와줍니다.
Windows 8+의 MT4 및 MT5에서 사용할 수 있는 데모 계정과 실제 계정, 모든 통화 쌍과 자산에서 작동합니다. 매우 간단하고 빠른 활성화. 여기에는 TG 채널에 대한 거래 신호의 빠른 전달을 보장하고 사실상 기술 지원이 필요하지 않은 외부 라이브러리 및 모듈이 포함되어 있지 않습니다.
설치
도구->옵션->전문 조언자 창에서 나열된 URL에 대해 WebRequest 허용 확인란을 선택합니다.

Dr Trend is a trend indicator for the MetaTrader 4 trading platform. This indicator allows you to find the most likely trend reversal points. You won’t find a proprietary indicator like this anywhere else. A simple but effective system for determining the Forex trend. From the screenshots you can see for yourself the accuracy of this tool. Works on all currency pairs, stocks, commodities, cryptocurrencies.
Are you already tired of constant ups and downs? You shouldn’t fall victim to unstable m

The Trahin indicator determines the prevailing trend. They help analyze the market on a selected time interval. Easy to set up and works on all pairs and all time intervals. Trend indicators make it possible to classify the direction of price movement, determining its strength. Solving this problem helps investors enter the market on time and get good returns.
For any trader, it is extremely important to correctly determine the direction and strength of trend movement. Unfortunately, there is

The Crit indicator analyzes price behavior and, if there is a temporary weakness in the trend, you can notice this from the indicator readings, as in the case of a pronounced change in trend direction. Entering the market is not difficult, but staying in it is much more difficult. With the Crit indicator, staying on trend will become much easier! This indicator allows you to analyze historical data and, based on it, display instructions for further actions on the trader’s screen.
A arrow techn
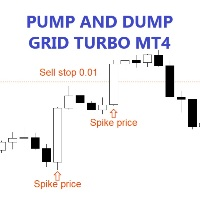
The EA trades on pending order which spike price and comeback to previous price, the pending order will deleted when end of the day . Best time frame 30 mins, Any pair any broker no limited, recommend minimum deposit 500$
SETTING Symbol - Symbol on your chart. Spike_period - Speed of price (Set less = more trade). Spike_value - Time of price speed increase or decrease (Recommended value 0.1-2.0). Candle_size_pips - Maximum candle size previous pending order. Lots - start lot. Multiple_lots - Mu

The Royal Mint New indicator for MetaTrader is a trend-following system that analyzes the trend bias of any currency pair. It is a superior version of the regular Heiken Ashi indicator, designed with more advanced technical tools like the trend reversals, a T3 line, and the moving average. The T3 line of the indicator works as an extra layer of confluence to confirm when the moving average crosses over. Moreover, the Heiken Ashi bars of the indicator would change to blue to depict a potential bu
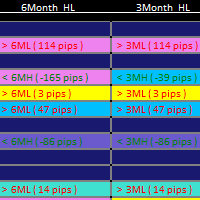
1. Updated usage descriptions in blog below: https://www.mql5.com/en/blogs/post/760322 Smart Market Structure Trading System and Automatic Scanner - Trading Systems - 13 October 2023 - Traders' Blogs (mql5.com) https://www.mql5.com/en/blogs/post/754495 2. YouTube video link for introduction: https://youtu.be/tMU04wo0bc8 3. The Smart Market Structure Opportunity Scanner is a great tool to find trading entries and exits based on Smart Money Concepts. It has a build-in custom choice of Forex pa

This is a simple EA which works on the EMA crossover strategy. It uses fixed pips to put hard Stop Loss and Take Profit levels on every trade. Warning! This is a martingale system which may or may not wipe your trading account. If you want to take the risk anyway then must use it with proper money and risk management. NOTE: Martingale is good for compounding the account in less time. In other words, “Grow it or Blow it!”
POINTS: 1. Martingale System 2. Works in all markets. 3. Very Risky! 4. Ha
The HFT Prop Pass is a specialized algorithmic trading EA designed to successfully pass the rigorous evaluation process of proprietary trading firms. This EA is specifically optimized for High Frequency Trading techniques, enabling traders to execute trades at lightning-fast speeds. If you apply EA to DE40, you can see 100% profit in demo account within 1 hour. This EA is compatible with DE40 and US30 markets and performs optimally with brokers that offer tight spreads and low delay. Signal: ht

e-gold Software outperforms the competition, delivering unmatched accuracy rates of 80% Accuracy in the bullion trading market. Experience the power of fully automated trading without manual intervention.
Key Features Tested and proven on various trading platforms like MT4, MT5 and different account types. Each entry includes stop loss and a 1:2 target point (customizable). 100% risk management and equity damage control. Suitable for moderate, medium, and high capital management. Works flawless
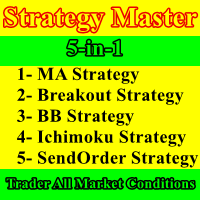
Strategy Master is a 5-in-1 EA, offering a choice of 5 distinct strategies within a single expert advisor. You can activate one to five strategies simultaneously and customize your trading by enabling or disabling filters to validate entries. These five strategies encompass a range of approaches, including three technical strategies (Moving Average, Bollinger Bands, and Ichimoku), a renowned price action strategy (Breakout), and a time-based strategy (SendOrder at Time). We understand that mar
The Ultimate Moving Average Crossover EA AFFORDABLE & POWERFUL - The settings are up to you. Create Signals and Automatically Enter Trades if Desired. Introducing our state-of-the-art Moving Average Crossover Expert Advisor, a sophisticated tool for traders who understand the unparalleled significance of moving averages in the forex market. Our EA isn't just any ordinary tool; it's a powerful blend of precision and customization that offers a multi-layered approach to trading.
Key Features: Mu
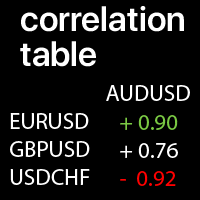
선택한 심볼 간의 상관 관계 값: 현재 시장 추세 비교 +1: 값은 완전한 양의 상관 관계를 의미합니다. -1: 값은 완전한 역 상관 관계를 의미합니다. 0: 값은 명시적인 상관 관계가 없음을 의미합니다 (가격이 서로 의존하지 않거나 상관 관계가 무작위 입니다). 나의 #1 유틸리티 : 65+ 기능 | 문의하기 질문이 있으면 | MT5 버전 각 심볼은 사용자 정의할 수 있습니다: 제거 / 교체. 행 / 열당 최대 10개의 심볼을 추가할 수 있습니다. 패널은 차트의 아무 곳으로나 이동할 수 있습니다 (드래그 가능).
입력 설정에서 다음을 구성할 수 있습니다: 계산에 사용되는 기간 (선택한 시간 프레임의 바 수 ). 계산을 위한 시간 프레임 : 높은 TF = 장기 상관 관계, 낮은 TF = 단기 상관 관계. 극값 : 경고 및 강조 표시에 사용됩니다. 강조 옵션: 활성화하면 극단적인 상관 관계가 녹색 / 빨간색으로

MetaProfitX utilizes a unique strategy where it continuously scalps small profitable trades. MetaProfitX stands out from other expert advisors due to its remarkable approach to handling losing trades. Unlike traditional methods that solely rely on Stop Loss orders to limit losses, MetaProfitX employs a sophisticated technique to manage losing positions, trading as a basket, closing all at once on a small profit. This unique strategy allows MetaProfitX to optimize its risk management, mini

KJ Grid MT 4 is a trading expert advisor (EA) designed for grid trading, where positions are opened in a grid pattern. This means the first trade in the cycle is opened, and more trades are opened at price gap intervals if price moves in that direction. These positions will be closed according to the closing option chosen, generally in profit. The number of positions, their lot sizes, and the distance in points between positions are chosen in the EA settings. The most important setting is the cl

This EA Forex is developed based on a stochastic oscillator indicator. It sets the parameters including %K, Slowing, %D, Price filed, and MA method to fit with XAUUSD trading. The grid martingale is used to improve the trading strategy also. Recommend List Details Initial Deposit $1,000 OR 10,000 USC Currency Pair XAU/USD Time Frame M30 Relative DD 61.23% Profit 135% per year Winrate 75.10% Duraion 2-24 hr. Account ECN, STD, Cent account See more details about this EA Forex https://eaforexcente

"자동 FIBO" Crypto_Forex 지표 - 거래에 있어서 훌륭한 보조 도구입니다!
- 지표는 자동으로 Fibo 수준과 로컬 트렌드 라인(빨간색)을 계산하여 차트에 배치합니다. - Fibonacci 수준은 가격이 반전될 수 있는 주요 영역을 나타냅니다. - 가장 중요한 수준은 23.6%, 38.2%, 50% 및 61.8%입니다. - 반전 스캘핑이나 존 그리드 트레이딩에 사용할 수 있습니다. - Auto FIBO 지표를 사용하여 현재 시스템을 개선할 수 있는 많은 기회가 있습니다. ............................................................................................................................................... // 뛰어난 트레이딩 로봇과 지표는 여기에서 확인할 수 있습니다: https://www.mql5.com/en/users/def1380/selle

Fiery Pinnacle USES THE TREND WAVE INDICATOR AND IT CAN IDENTIFY THE BEGINNING AND THE END OF A NEW WAVE TREND MOVEMENT.
AS AN OSCILLATOR, THE INDICATOR IDENTIFIES THE OVERBOUGHT AND OVERSOLD ZONES.
IT WORKS GREAT TO CATCH THE SHORT TERM PRICE REVERSALS AND USES A MARTINGALE STRATEGY TO CLOSE ALL TRADES IN PROFIT.
USE DEFAULT SETTINGS ON H1 OR HIGHER TIME FRAME ON ANY PAIR FOR MORE ACCURATE TRADES
WHY THIS EA :
Smart entries calculated by 4 great strategies The EA can be run on even a $300

This expert is based on patterns
The main patterns of this specialist are candlestick patterns
Detects trends with candlestick patterns
It has a profit limit and a loss limit, so it has a low risk
The best time frame to use this expert is M30 time frame
The best currency pairs to use with this expert is the EURUSD, GBPUSD, AUDUSD, USDCAD currency pairs
Attributes: Can be used in the EURUSD, GBPUSD, AUDUSD, USDCAD currency pairs Can be used in M30, H1, H4 time frames Has profit limit and loss
El Asesor Experto "Precision Day Trader" es una herramienta avanzada diseñada para analizar meticulosamente las condiciones del mercado y ejecutar operaciones con precisión durante el día. Utiliza algoritmos inteligentes y estrategias cuidadosamente diseñadas para identificar oportunidades de trading óptimas, centrándose en la precisión y el rendimiento consistente. Características Principales: Análisis Preciso del Mercado: El EA realiza un análisis detallado de las condiciones del mercado, util

안녕하세요 NESCO 입니다. - 저는 전자동 로봇 전문가이며 독립적으로 시장을 분석하고 거래 결정을 내립니다. 내 기능 중 일부는 GPT-4_COPILOT을 사용하여 작성되었으며 MQL5_CLOUD_NETWORK 에 의해 최적화되었습니다. 나는 전 세계의 금융 이벤트를 받아볼 수 있는 나만의 서버를 가지고 있습니다. 저는 귀하의 개입 없이 연중무휴 24시간 일할 수 있으며 주의가 필요한 경우 전화 메시지로 알려드릴 수 있습니다.
나의 주요 특징은 데이터 흐름 분석 방법론으로, 이를 통해 수십 가지 전략을 동시에 거래할 수 있습니다.
그러나 지금까지 6가지 전략이 준비되어 있습니다.
PILOT_R:
거래 시간 1:30-18:30;
기호: EURUSD M5;
최소 입금액: 150 USD;
STENVALL _:
거래 시간 1:30-18:30;
기호: EURUSD M5;
최소 입금액: 100 USD; NIGHT_POUND :
거래 시간 1:30-5:

Camarilla Pivot Points is a math-based price action analysis tool that generates potential intraday support and resistance levels. Pivot price values are stored in output buffers within this indicator, enabling any Expert Advisor to utilize this indicator's data for trading purposes. This indicator offers the potential for developing numerous strategies. To explore some of these strategies, please visit the following websites: https://www.babypips.com/forexpedia/camarilla-pivot-points https:
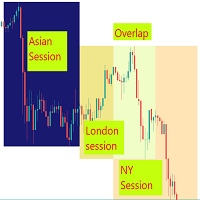
Visual guide which divides the 24 hours into three trading sessions. The default setting is to show Asian , London and New York sessions. But, the session start and end hours can be adjusted as required.
The indicator is useful to develop trading strategies by making it easy to see the market behavior during the three sessions.
Inputs Time Zone Start and End hours (Please provide values in HH:MM format, like 02:00, not like 2:00. Both the hours and minutes should have 2 digits) Ti
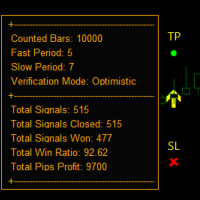
3개의 이동 평균 교차 전략을 기반으로 Statistic Arrow는 차트에 그려진 포인트의 tp 및 sl을 사용하여 매수 및 매도 신호를 제공하며, 승률과 종료된 거래 수, 승리한 수, 획득한 수를 보여주는 백 테스트 대시보드와 함께 제공됩니다. 손실, 최종 이익 창출, 표시기는 BAR OPEN의 tp 및 sl 측면을 따라 화살표를 인쇄하고 사전 경고를 제공합니다.
==========================================================================================================================
매개변수는 설정 스크린샷에 표시되고 설명됩니다.

Trading Advisor for margin currency pairs and metals. Conservative trading of 100,000 units per 0.01 lot. The standard trade is 10,000 units per 0.01 lot. Aggressive trading with high risks of 1000 units per 0.01 lot. You can always pick up your starting lot. The EA is fully automated, you only have to put up the initial lot depending on your initial deposit. The recommended timeframe is H1. 1. Test on any steam, iron and fuel oil 2. Try starting with convenient depots 3. When going into a dra

Works to open two hedging deals, buying and selling, with a goal of each deal of 20 points With the opening of multiple cooling deals in the manner of another lot size and suspending each type of sale or purchase transaction At a profit level.
Parameters:
Lot1: Manual Lot Size Auto_Lot: Set true to automatically calculate optimal Lot Size based on risk preferences, Set False if you want use manual lot size. Max_Risk: Max Risk as percentage of Equity* the greater this percentage is the greater
Price Action Supply/Demand, Support/Resistance, Swing Low, Swing High Scanner Indicator is a software designed to automatically draw and mark regions on price charts, making it easier for traders to identify potential reaction sites. The software can be used for various currency pairs and commodities such as AUDCAD, gold, and bitcoin. Highlights The software automatically marks regions on price charts, indicating past working areas and potential reaction sites. Traders can easily switch be
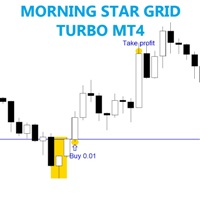
The EA trades on morning star pattern . Best time frame 30 mins, Any pair any broker no limited, recommend minimum deposit 500$
SETTING Candle_size_pips - Minimum size of previous candle. Lots - start lot. Multiple_lots - Multiply lot for next order. Max_lots - maximum lot. Grid_boost - Frequency of opening position (Less more order). Grid_minimum_pips - Check distance grid from last order. TP_pips - take profit, in pips. SL_money - Stop loss in money. Number order for DD Reduction Algoritm
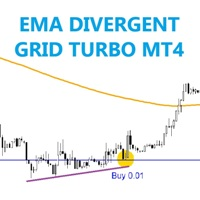
The EA trades on price make divergent between EMA and candle stick . Any pair, time frame any broker no limited, recommend minimum deposit 500$
SETTING EMA_period - Set EMA period Bar_history - Set candle history passed. Lots - start lot. Multiple_lots - Multiply lot for next order. Max_lots - maximum lot. Grid_boost - Frequency of opening position (Less more order). Grid_minimum_pips - Check distance grid from last order. TP_pips - take profit, in pips. SL_money - Stop loss in money. Numbe

O TakeFast AI é um algoritmo sofisticado e inovador que emprega Inteligência Artificial em conjunto com a análise técnica tradicional para antecipar os comportamentos do mercado financeiro. Este Expert Advisor utiliza Redes Neurais Recorrentes, mais especificamente, células de Memória de Longo Prazo e Curto Prazo (LSTM), que são treinadas com base em dados provenientes de indicadores de análise técnica. Através deste método, o EA consegue aprender quais indicadores são os mais influentes para pr

제목: GOLDEN SUN 123 TREND_Dashboard_With_Alert MT4 지표 공개 끊임없이 변화하는 금융 시장에서 트레이더들은 지속적으로 경쟁력 있는 우위를 제공하는 도구를 찾고 있습니다. 정확성과 수익성을 추구하는 과정에서 GOLDEN SUN 123 TREND_Dashboard_With_Alert MT4 지표는 기회의 표지로 빛을 발합니다. MetaTrader 4 플랫폼을 위해 설계된 이 놀라운 지표는 추세 추종 기능과 경고 메커니즘을 통해 전략적 거래의 정수를 담고 있습니다. 추세의 힘 활용하기: GOLDEN SUN 123 TREND_Dashboard_With_Alert MT4 지표는 시장 추세를 식별하고 활용하기 위한 정교한 도구입니다. 트레이더들은 추세가 수익성 있는 거래의 핵심임을 이해하며, 이 지표는 바로 그러한 역할을 위해 정교하게 제작되었습니다. 이 지표는 시장을 끊임없이 검사하여 상승, 하락 또는 범위 추세인지 여부를 즉시 인식합니다. 명확성의 대시
MetaTrader 마켓은 거래로봇과 기술지표를 판매하기에 최적의 장소입니다.
오직 어플리케이션만 개발하면 됩니다. 수백만 명의 MetaTrader 사용자에게 제품을 제공하기 위해 마켓에 제품을 게시하는 방법에 대해 설명해 드리겠습니다.
트레이딩 기회를 놓치고 있어요:
- 무료 트레이딩 앱
- 복사용 8,000 이상의 시그널
- 금융 시장 개척을 위한 경제 뉴스
등록
로그인
계정이 없으시면, 가입하십시오
MQL5.com 웹사이트에 로그인을 하기 위해 쿠키를 허용하십시오.
브라우저에서 필요한 설정을 활성화하시지 않으면, 로그인할 수 없습니다.