MetaTrader 4용 Expert Advisor 및 지표 - 226

Moving Average EA
=============== This Robot is fully automated and has been created for everyone. The Robot works also on cent accounts.
The Ea is based on Moving averages ========================================= You can set up which Moving Averages you want to cross. But keep in mind if you use a smaller frame you will get more signals.And also consider the profit when there was a crossover but the market is trading sideways. Maybe better to go for small profit, set it on higher time fr

This is a price channel that shows five important price levels on the chart. Those levels are: 1. The Highest High (HH) of the previous x bars.
2. The Highest Low (HL) of the previous x bars.
3. The Center Line.
4. The Lowest High (LH) of the previous x bars.
5. The Lowest Low (LL) of the previous x bars. How does Bermaui Channels Captures Overbought area
Think of the distance between HH and HL levels as an overbought area.
When the price candles or bars crosses the HL to the upside this

ECHO INDICATOR V2.2 Update
A top-quality indicator works with trend and pattern. The tool is a good assistant for the traders use various levels in trading.
When price approaches a level, the indicator produces a sound alert and (or) notifies in a pop-up message, or via push notifications. A great decision making tool for opening orders. Can be used any timeframe and can be customized
Easy to trade It implements alerts of all kinds It implements a multi-timeframe
Trade with Trend + s

This Indicator works based on several well-known Technical Indicators in different time frame Works. These Technical Indicators include: Moving Averages (MA) Average Directional Index (ADX) Parabolic Stop and Reverse (SAR) Moving Average Convergence Divergence (MACD) Commodity Channel Index (CCI) Oscillator of a Moving Average (OsMA ) Momentum(MOM) Relative Strength Index (RSI) Williams' Percent Range (WPR)
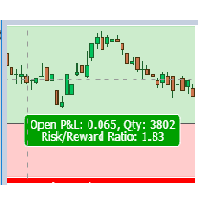
Risk Reward Panel This is a useful tool to plan a trade risk to reward visually. The indicator is very simple to use with minimum settings. Long or Short You can use the indicator for both long and short positions.
Lot Size Calculator You can also use this indicator as a lot size calculator. If you set the risk amount the indicator will calculate the lot size for you based on the stop loss line. You do not need to calculate the lot size manually.
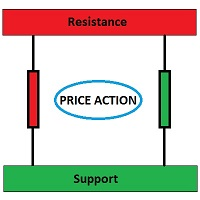
This is a price action support resistance level indicator for MT4, simply working in all time frames and all chart types. It creates Major support/resistance in specified time frame. You can also add a support/resistance level manually. For doing this, first add a horizontal line to the chart and rename it to 'Line'.
Input variables: timeFrame: You can select one of these values (M1, M5, M15, M30, H1, H4, D1, W1 and MN) or leave it empty to use Current Timeframe. majorLineColor: To specify c

Unique trend trading algorithm with advanced filtering and many features which should become a part of your trading arsenal. This indicator can give you also trading advisors (with take profit target), success rate scanner and much more. TrendMagiX PRO comes with built-in multi-pair and multi-timeframe scanner which is fully adjustable. User can select own symbols and time-frames to monitor. + ALL the features of standard TrendMagiX indicator
Important information For additional detailed infor
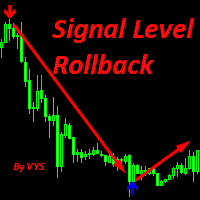
Signal Level Rollback the tool is designed to determine the lows and highs to determine the pivot of the market recommended for use with resistance support levels buy signal blue arrow sell signal red arrow It is recommended to use on a timeframe from M15 and higher since there are large movements and less market noise Stoploss is set for the nearest minimum or maximum or at a distance of 10-30 points.....
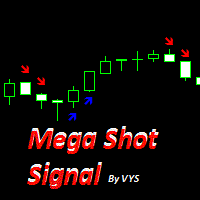
This tool is designed for binary options. The accuracy of this tool is more to 75%. Opening transactions is worth 1 candle. To increase profitability, you can use 4-knee martingale management. it is worth opening a buy deal when a signal appears in the form of a blue arrow it is worth opening a buy deal when a red arrow appears It is recommended to trade on timeframes from m1 to m15 highest accuracy on time frames m1 and m5

Pulse Scalping Line - an indicator for identifying potential pivot points. Based on this indicator, you can build an effective Martingale system. According to our statistics, the indicator gives a maximum of 4 erroneous pivot points in a series. On average, these are 2 pivot points. That is, the indicator shows a reversal, it is erroneous. This means that the second signal of the indicator will be highly accurate. Based on this information, you can build a trading system based on the Martingale

Very Fast Arrows (VFA) is a comprehensive indicator with visualization in arrows that has a little false signals at minimal delay time.
VFA is a counter-trend indicator. However its flexible algorithm is adjusted to market behavior and becomes more sensitive to rollbacks in the case of trend.
The algorithm of the indicator is based on wave analisys and can be optimized to any currency pair and time frame at minimal number of inputs. The possibility to optimize the indicator by pressing the but

Contact us for any custom order, CodeYourTrade.com .
Trend Direction indicator finds the direction of the trend using 2 indicators ADX and Parabolic SAR. Change the color of the Sell and Buy strength from the Colors tab in indicator settings. After you attached the indicator to a chart it will show the following information on the chart: 1. Parabolic SAR: Input values of Parabolic SAR Indicator 2. ADX: Input values of ADX Indicator 3. Trend Strength: Direction of the trend

Contact us for any custom order, CodeYourTrade.com .
Trade Notifier indicator is used to notify opening or closing of the trades via email or alert. It can also send regular trade updates via email. After you attached the Indicator to a chart, it will show the following information on the chart: 1. Alert information 2. Email information 3. Details to include in email body You can hide all the information displayed in the chart by setting false to Display . Indicator Settings A

Contact us for any custom order, CodeYourTrade.com .
With the Technical Indicator Multi-Timeframe, you can easily identify the oversold/overbought levels or buy/sell levels points on several different timeframes by using only one chart. You can confirm Short Term trades by higher timeframe Levels. It supports 4 technical indicators as of now Stochastic, RSI, Parabolic SAR & Heiken Ashi. After you attached the indicator to a chart it will show the following information on the chart: Timeframe

With the Technical Analysis indicator, you can find the trading signals using the combination of different technical indicators. It supports the following technical indicators: 1. RSI 2. Stochastic 3. Stochastic RSI 4. MACD 5. ADX 6. CCI 7. ATR 8. Ultimate Oscillator 9. ROC 10. Bull/Bear Power After you attached the indicator to a chart it will show the following information on the chart: 1. Technical indicators, their values and the signal generated fro

Spread & Swap Indicator is used to check the spread and swap for the current pair. You can hide all the information displayed in the chart by setting false to Show On Chart . Indicator Settings: Main Setting Display Spread : Shows the spread of the current pair. Display Swap (per lot) : Show the swap charges per lot for the current pair. Display Setting Display : Shows the indicator information on chart Location : Location of the display window Top-Left : Display all the details in top-left p

Contact us for any custom order, CodeYourTrade.com .
The Stochastic RSI indicator is essentially an indicator of an indicator. It is used in technical analysis to provide a stochastic calculation to the RSI indicator. This means that it is a measure of RSI relative to its own high/low range over a user-defined period of time. This indicator is primarily used for identifying overbought and oversold conditions. You can hide all the information displayed in the chart by setting false to Sho

Contact us for any custom order, CodeYourTrade.com .
This indicator is used to calculate the pivot points using 5 different methods: Classic Fibonacci Camarilla Woodie DeMark After you attached the indicator to a chart it will show the following information on the chart: Pivot points levels of the current chart using different methods. Indicator Setting Pivot Point Calculator Show Pivot Point Calculator: Show all pivot points on chart Pivot Points Timeframe: It tells which time is used to ca

Contact us for any custom order, CodeYourTrade.com .
Multiple Moving Average (MA) indicator is used to find the direction of the trend using multiple Moving Average indicators. It calculates using the following rules: · Ask < MA, it is SELL · Bid > MA, it is BUY · Ask > MA > Bid, it is None (no signal) After you attached the indicator to a chart it will show the following information on the chart: Multiple MAs arranged by their method Buy and Sell count Summary: Co

Contact us for any custom order, CodeYourTrade.com .
The MACD Histogram measures the distance between the MACD line and the MACD signal line. Two important terms are derived from the MACD histogram are: · Convergence : The MACD histogram is shrinking in height. This occurs because there is a change in direction or a slowdown in the trend. When that occurs, the MACD line is getting closer to the MACD signal line. · Divergence : The MACD histogram is increasing in height (eit

Contact us for any custom order, CodeYourTrade.com .
Keltner Channels are volatility-based envelopes. Moving average dictates direction and the ATR sets the channel width. It’s a trend following indicator used to identify reversals. Channels can also be used to identify overbought and oversold levels when the trend is flat. Trading Strategy We have created 2 zones SELL ZONE and BUY ZONE using the Keltner channels. In SELL ZONE (upper) we take only sell orders and in BUY ZONE (lower) we take

This expert tries to benefit from mean returning behavior. The full strategy can be found at link (Portuguese post). Real profitable strategy being used by a lot of people manually, now automatized!
Parameters: p1 : Distance from EMA13 to EMA200 according to the strategy UseMoneySteps : Enable/disable money management for step mode MoneyStep : Amount of money to increase one minimal lot UseMoneyPercentage : Enable/disable money management based on percentage and stoploss MoneyPercentage : Perc

Contact us for any custom order, CodeYourTrade.com .
Currency Sessions Highlight indicator is used to highlight the sessions. The maximum number of sessions visible at a time is 3. A user has to input the input the start and end time of the session in the format HH:MM. You can hide all the information displayed in the chart by setting false to Show On Chart . Indicator Settings: Main Setting Show Session 1 : Draw Session 1 on chart or not Session 1 Start : Start time of the session 1 Sess

Continuous Bars indicator is used to track the continuous bars closed in one direction. For example : Continuous Bars = 3 (we are looking for 3 continuous bars) Now, if (Open > Close) or (Close > Open) for 3 continuous bars it is notified via email or alert. You can hide all the information displayed in the chart by setting false to Show On Chart . Indicator Settings: Main Setting Bars : Number of continuous bars we are looking Price Setting Use M1 Timeframe: Look for continuous bars in M1 ti

Contact us for any custom order, CodeYourTrade.com .
Candle Close Time indicator is used to track the time remaining or passed on a current candle at any point of time. To get notified set the time in format DD:HH:MM:SS. For example : EnableNotify = true & (Day Left : Hour Left : Minute Left : Second Left) = 00:02:20:20. Let’s say remaining time to close candle is 00:03:23:21 (DD:HH:MM:SS). Now, when the time remaining reaches below 00:02:20:20, it shows an Alert box. You can hide all the in

Contact us for any custom order, CodeYourTrade.com . Channel Breakout indicator shows the channels based on the number of bars. It is used to trades the breakouts or reversals. Breakout is quite efficient, since it tries making profit when the market crashes!! You can also invent your own technique out of it. After you attach the indicator to a chart it will show the following information on the chart: 1. Channel 1 and channel 2 information 2. Alert and email information You can hid

the indicator was developed for the forex market, it was taken into account the moments when there is a flat (lateral movement) on the market and it was read that there is devergency and this is an olin from strong phenomena, in the end it turned out to make this tool blue line is a buy signal gray line is a sideways movement red line is a sell signal when you see a signal, open a trade; if a signal about sideways movement appears after the signal line, then you should close the trade since in m

Общие сведения Для начала торговли достаточно небольшого депозита. Идеален для быстрого разгона депозита!!! Подходит для мультивалютной торговли. Невосприимчивость к большой задержке и величине спреда.
Принцип работы После запуска советника на графике советник запоминает уровень открытия первого ордера. Выше уровня открытия первого ордера советник выставляет сеть ордеров на Sell . Ниже уровня открытия первого ордера советник выставляет сеть ордеров на Buy . Если общая прибыль ордеров на поку

Gives the average times of the High of The Day and Low of The Day + the ADR over 2 different look back periods. Every day there is a High of the Day and a Low of the Day, and the distance between them is the ADR (Average Daily Range). If you are trading reversals at the first High/Low of the Day for high Reward:Risk trading, it’s useful to know the Morning Reversal time. If you are trading the End of Day Reversal back into the range after the ADR has been hit at the opposing High/Low of the Day,

Vol 2 DPOC volume vol 2 DOC-dynamic horizontal volume indicator for any time periods
Main settings of the indicator: Volume Source -selecting data for volumes (tick or real) DPOCOn -enabling / disabling the indicator DPOCFrom -calculation start date DPOCTo -settlement end date The indicator allows you to manually select areas on the chart to analyze changes in the maximum volume over time.
You can do this by using vertical lines and moving them along the chart. Or by setting specific dates
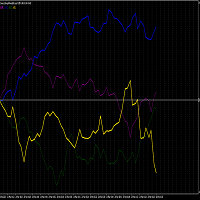
PLEASE NOTE THAT LIKE MANY SUCH INDICATORS ON THIS MARKET, THIS INDICATOR WILL NOT WORK AS A DEMO DOWNLOAD FOR STRATEGY TESTER. Therefore the 1 month option at the lowest cost allowed of $10 is available for you to test. One of the better ways to trade is to analyze individual instruments rather than in pairs. This is impossible with standard chart indicators on MT4. This volatility and strength meter allows one to trade the XAUUSD, XAUER or XAUAUD. Each instrument (not pair) is measured co

The EA is based on the zigzag indicator. The algorithm calculates each zigzag change based on the interest of buyers and sellers. This allows you to accurately determine the mood of the market. Works on all MT4 tools. Trading is carried out by a grid of orders. For the maximum result of the adviser, it is necessary to optimize these settings for each pair separately. All questions about the use and configuration write to the chat. All success and good luck.

Recovery Bad Order MT4 (System to recovery lost trader whit recovery algorithm).
This system used algorithm in the ea for initial recovery algorithm, this system close one part of loses trader, whit algorithm recovery. (the lot recovery is a factor o lot used in the entry recommended used 0,1 for lot and 0,01 for recovery lot). https://youtu.be/FlpOhpiy7Pc Recovery Bad Order MT4 is an Expert Advisor for recovering losses of positions that were opened in the wrong direction (that were open

----------OVERVIEW--------- BORASO RISK CONTROLLER is an useful tool to record the equity gains and drawdown that your account reaches, so that you can adjust the level of power of investment. It is important if you trust a trader and you subscribe to a signal confident in never overcome a certain drawdown, saving big part of your capital if the bad day arrives. Please note that signal trades can be reopened after the "safety exit" but you can decide to stop the autocopying with a better protect

Miser 4 Miser 4 is an intraday trading system that makes profit on short-term price movements. The EA is optimized for several currency pairs. Optimized parameter set files published in product news You can get acquainted with the EA operation statistics for different brokers on different instruments in the Trading Signals section for MetaTrader 5. It is possible to include martingale, which requires special care . Parameters Management of risks: enter allotted funds - (<= 0-OFF, <= 2.0 -

Description: The CCI Scalper leverages a group of Exponential Moving Averages and the Commodity Channel Index to find and trade the trend. This expert advisor works very well with EUR/USD and USD/CHF on a M15 chart.
Features: - No Dangerous trading methods such as Martingale's or Grids. - Every trade has a Stop Loss as well as the option for a Trailing Stop. - Setup is easy and not overly complex like most other Expert Advisors tend to be.
Parameters: - Take Profit - Lots - Trailing Stop -

Gold News Reloaded Gold News Reloaded
Expert dedicated to trading based on index movements detecting movements in Gold (XAUUSD). Operative
The EA It has multiple options and I have been testing it for months the signals are published in my profile, It is a Martin Gala very controlled plus the filter by movement of Indices that triggers the order of Buy or Sell, any query does not bother, If you want to rent before buying, we set up a configuration and Broker is recommended to operate.

1. Record the price data for each Tick transaction. Data file contents: "Tick time", "ASK price", "BID price", "SPREAD SPREAD", "Tick quoted quantity". 2. Meanwhile, generate a quotation data file with a 1-minute period. Content of 1min data file: "ASK time", "ASK OPEN price", "ASK HIGH price", "ASK LOW price", "ASK CLOSE price", "BID time", "BID OPEN price", "BID HIGH price", "BID LOW price", "BID CLOSE price", "Tick quoted quantity". 3. Save all quotation data in one file every day, which is c

Beat Your Broker Track your broker's real (not advertised!) spreads. A no-brainer price for an essential tool for every legit trader. Load like a normal EA to track the average spread for up to 8 symbol_time periods. So for example, track the average spread for: EURUSD on 30m chart NAS100 on 5m chart GBPUSD on 15m chart etc Each symbol_time will generate its own .csv file that is easily accessible from the data folder, for you to download and manipulate. The file has three columns - Date, Time,

I will support only my client. สำหรับลูกค้า Parameters
General Trade Settings Money Management
Lot : Fixed (can change) Strategies - H4 Strategies it is fixed with MA, Bollinger band, Candlestick Levels Close Functions - H4 Strategies MagicNumber - individual magic number. The EA will only manage position of the chart symbol with this magic number. NextOpenTradeAfterMinutes - 15 minutes is default, can change it MaxSpread - upto currency pairs, MaxSlippage - upto currency pairs, Push

This Bot lets to place price alerts from mobile terminal (android/ios) and send it by Email, Push, or Terminal Alerts. Just place any pending order from your mobile device and delete it within 10 seconds, Bot will remember the order price and create Alert: EURUSD Set ALERT at 1.1234 When the price reach target value, you will get Alert notification: EURUSD ALERT: BID>1.1234 If pending order don’t remove within 10 seconds, Bot set Stop Loss and Take Profit values: StopLoss = SL x ATR, TakeProf

BLACKBOX BEAST provides the investment market a highly sophisticated, proprietary, Black-Box trading software system and infrastructure that is fully automated, algorithmic, non-subjective input, that maximizes the application and use of AI (Artificial Intelligence), that is non-directional that makes money simultaneously regardless whether the market is going up or down, and that is revolutionary in its ability to make profits in the market in that it is a “3-dimensional” trading philosophy (m
Full Forex Market View Dashboard Plus
This is a custom indicator created to give Traders a full view of what is going on in the market. It uses a real time data to access the market and display every bit of information needed to make successful trading. The PLUS there to produce the kind of RESULTS as you see in the SCREENSHOTS, I added a MultipleOrder Utility EA with it with instructions on how to use it with FFXMV Dashboard.
INSTALLATION : Read the MANUALS that comes with the rest of the
Analyzer is a multiple indicator multi timeframe that allow you to know the status of RSI , Stochastic and ADX in all time frame, from 5 minute to monthly. In input you can insert your preferred setting which will be applied to the whole indicator. Trade with this indicator is very simple. You can follow the trend or find the best opportunity for reversal. A green histogram is shown when the indicator report a bullish tendency. A red histogram appears whether the indicators indicate a bearish te

McDuckEA – works on the martingale strategy. It shows good results when trading on Gold, XAUUSD. Martingale orders are opened with a step from each other and only after the opening of a new bar of the set timeframe. During the release of important news, the EA suspends the opening of new orders. The EA has an internal risk control system and, if the risk is exceeded, it starts to exit the market, closing extreme positions in pairs. The level of loading of the deposit determines the risk and prof

Stochastic multitimeframe is a simple but useful indicator that allow you to know the status of Stochastic in all time frame, from 5 minute to monthly. In input you can insert your preferred setting which will be applied to the whole indicator. A green histogram is shown, if the value is greater than 50. A red histogram appears instead if the value is less than 50. If you click on timeframe label you can change timeframe on selected chart. You will discover how important it is to understand the

RSI multitimeframe is a simple but useful indicator that allow you to know the status of RSI in all time frame, from 5 minute to monthly. In input you can insert your preferred setting which will be applied to the whole indicator. A green histogram is shown, if the value is greater than 50. A red histogram appears instead if the value is less than 50. If you click on timeframe label you can change timeframe on selected chart. You will discover how important it is to understand the strength of th

MOVING AVERAGE CROSSOVERS는 이동 평균의 교차점에서 거래하기 위한 Expert Advisor입니다. 매개변수에는 직관적인 이름이 있으며 각 #MOVING AVERAGE는 개별적으로 구성할 수 있습니다. 이 전략은 매우 오래되었고 사용하기 쉬우며 동시에 FOREX 시장에서 매우 인기가 있습니다. 시장이 추세를 보일 때 큰 기복 동안 매우 좋은 결과를 제공합니다. 가장 변동성이 큰 쌍은 GBPUSD, USDCAD, EURUSD, USDJPY, USDCHF, AUDUSD, NZDUSD와 같은 작업에 적합합니다. 거래를 새로운 수준으로 끌어올리는 기능이 있습니다.
권장 사항:
실제 돈으로 사용하기 전에 센트 거래 계정에서 최소한의 위험으로 고문을 테스트하십시오. 가장 변동성이 큰 쌍은 GBPUSD, USDCAD, EURUSD, USDJPY, USDCHF, AUDUSD, NZDUSD와 같은 작업에 적합합니다. 최소 보증금 - 0.01랏당 $ 200; 혜택:
위
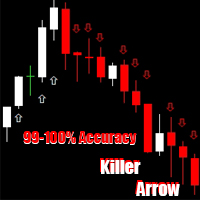
️ Trader's & Investors ️
Are you really tensed how do Buy / Sell ? Are you want daily minimum pips to settlement your desired target ? Are you want daily basis profit ? Are you want to beat the market ?
️ Then "Killer Arrow" help you out ️ "Killer Arrow" able to give you daily basis profit ️ You able to beat the market in every day basis
Usage System
Follow our rules to use this indicator! ️ Use only volatile currency pair. ️ Use GBP rela

In foreign exchange trading, the most important investment principle is to ensure the safety of the principal, and risk prevention and control is the primary operation concept. How to manage the account funds is to control the position size and the profit and loss of the order, this EA is designed based on this idea. It can directly manage the risk control of the trading account and realize two functions. One is to close the position according to the profit and loss ratio, and the other is to au

The Garuda Empire - Binary Options Experience the epitome of trading synthesis where the time-honored Ichimoku methodology seamlessly intertwines with revered Western indicators. It's a harmonious blend—Europe shaking hands with Japan, a true testament to the power of global financial collaboration. With years of dedicated observation and analysis, I've come to one conclusion: Mastery is achieved through specialization. My journey with the EURJPY has been transformative, leading to the birth of

The indicator automatically adjusts itself to any trading instrument and determines basic market conditions, such as: Flet, Trend, Overbought and Oversold Works on all timeframes, all currency pairs, metals and cryptov currencies
Can be used when working with binary options
Distinctive features It's not redrawn; Fast filtering of basic market conditions; Easy and clear settings; Works on all timeframes and all symbols; Suitable for trading currencies, metals, options and crypt currencies (B

Отличается от стандартного индикатора дополнительным набором настроек и встроенной системой оповещений. Индикатор может подавать сигналы в виде алерта ( Alert ), комментария в левый верхний угол главного окна графика ( Comment ), уведомления на мобильную версию терминала ( Mobile МТ4 ), электронный почтовый ящик ( Gmail ). Параметры индикатора Period — период расчета индикатора; Method — выбор метода усреднения: простой, экспоненциальный, сглаженный, линейно-взвешенный; Apply to — выбор использ

All in One Forex Dashboard is a multitimeframe and multicurrency screener with external data inupt.
You can filter your signal by multiple information to find trend or potential inversion on 28 currency cross.
The first group of indicator is a Trend indicator . It's based on average price and allow you to konw if you are in trend or not in all major timeframes.
Single timeframe is colored according to the information founded, while it remains gray when the price is in an accumulation

My new system... This is not a regular channel. Who is it for: - For people who want to understand the market. Tested and used in the real market (I use and not just encodes)
Important !!! The system requires thinking.
Only for real traders. If you are looking for a holy grail - please don't bother me.
Is it possible? Trading has never been so easy. A combination of fibonacci and an intelligent channel plus levels of support and resistance. Setting out a channel is now very easy.

This indicator allow users to navigate very quickly from one to another Forex cross. Very simple to use and very useful. You will not waste any more time and it will simplify your life as a trader. The color change every time that you click on other cross, so you will always know which is the open chart. To help your navigation, the majors have a slightly different color.

Analyst Bot - the adviser uses many moving average indicators to search for signals to enter. Works in fully automatic mode! You do not need any settings, you can use the default settings. The bot passes the historical gap for the 19-year period from 2000 to 2019. Unlike alternative developments, this bot can simultaneously trade both on buy and on sell. That is, it has two independent systems of analysis. This is a significant advantage in real life because it gives the opportunity to achieve
The GENEVA trading system this is a tool that can conduct a comprehensive analysis of the Forex market, stock market, and cryptocurrency market. With this tool, you will receive ready-made signals to enter the market. Let's see what the system looks like:
To begin with, the system is exclusively trend-based, which means that you are already in a winning situation, because you only work on the trend.
The system has its own trend/flat analyzer built in. This means that during lateral moveme

https://www.mql5.com/en/signals/713226 This is is Design for M5 Time-frame only, please do not attempt using another time frame
Recommended Trading SYmbols are GBP/JPY, GBP/USD, USD/JPY EUR/JPY respectively Recommended Minimum Account Balance is 1000 though can trade on lower account balance on days with lower market volatility but the maximum drawdon the risk might be dangerous to attempt doing so set the EquityLevel to higer than your account balance (your Expected Profit Target) set the A

This EA will support your open trades to have more possibilities to get profitable. Just keep in mind to use this EA you are taking RISKS as its method is a Martingale / Grid system controlled in automatic. This EA will start to open trades increasing your lots (open big lots in sell and buy positions normally doesn't decrease your free margin account but when you are red you are need for bigger margin and that's the risk also to use this EA). When reaching Take Profit you will have lost trades

The Trend ZVD Trend Indicator is important for identifying trends in financial markets. However, this indicator works equally well during consolidation periods. The Trend ZVD trend indicator indicates the direction in which the asset of your choice can move.
The Trend ZVD trend indicator copes with the main task of trading: to find the entry point to the market at the time the trend is created and the exit point at the time it is completed. A trend in trade is the steady movement of quotes in

Trend DI is an auxiliary tool for technical analysis that helps determine the exact direction of a trend: either an upward or downward movement of the price of a trading instrument. Although the Trend DI indicator is a bit late, it still generates the most reliable signals that a trader can safely navigate.
The Trend DI indicator smooths price fluctuations during signal formation by averaging data. This gives the trader the opportunity to visually determine which trend will be present in a pa

Specification:
- Trend trading only on GBPCAD . - EA run using H1 (1 hour) and D1 (daily) timeframes only (so don't worry about strategy tester modelling quality, because of using H1/D1 is enough) .
- Each trade opened with pre-determined Stop loss and Take profit. - Having trailing stop.
- Based on fixed risk per trade/position (default is 5% of account free margin), then: Expecting net profit is about 60%/year ; Maximum drawdown is only 11% for the whole period (4 years testing).
- Medi

This is Special Intelligent Recovery system for Any Multi Pairs in a one accounts by Standards Martingale for Same "MAGIC Numbers :Manual Orders =0 ", attached only one charts, Also possible only attached pair by "Single Mode", This is only recovery EA, not trading EA. Backtest is only recovery sample. defaluts is for M5 timeframe set up. You should set Same Target EA's Magic Numbers to This EA Magic Numbers, if Manual Trade, you should set Magic=0.
Also we recommend for good recovery ,pleas

Trend indicator with calculation of dynamic levels and signaling their intersection.
Description of input parameters:
StepTF = true; - Calculation of the indicator by closing the bar (true) or by each tick (false)
BarsCount = 300; - Number of settlement bars
Price = PRICE_CLOSE; - Type of price used
TimeFrame = PERIOD_CURRENT; - Estimated timeframe
TrendPeriod = 9; - Trend calculation period
TrendDeviations = 4.9; - coefficient of deviation
PeriodTrendSmooth = 1; - Trend smoothi
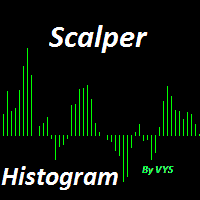
designed for scalping (pipsing on time frames up to H 1) enter the buy transaction when the host program crossed the zero line from the bottom up enter the sell deal when the histogram crossed the zero line from top to bottom recommended to be paired with other tools such as bollinger bands, macd, moving average recommendations for installing stop loss and take profit take profit set at 20-30 pips stop loss is not set for a minus trade closing on the opposite signal
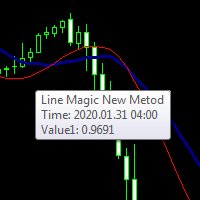
Line Magic New Metod similar to the usual Moving Average but not so This tool has a completely different data calculation algorithm. you can see this by comparing them it is recommended to use this indicator with the Moving Average since when combining these two tools they compensate for most of the shortcomings of themselves apply as shown in the screenshots

Closing average This is a completely new indicator in technical analysis. It is based solely on mathematical calculation. about signals It’s worth going into a buy transaction when the price has crossed the indicator line from bottom to top and it is under the price it is worth entering a deal on sell when the price is below the indicator line
This author’s development, he doesn’t use any indicators of technical analysis in his analysis.

Advisor for semi-automatic trading with a virtual multi-level trail of take profit and stop loss, a trail of target profit, martingale functions, manual opening of orders, managing third-party orders, counting trading instruments, displaying current information and statistics on a chart. It is possible to set several levels of trailing take profit and stop loss and to each level to assign the percentage of partial closing of the order. The percentage of the lot when closing the level is calculat
The indicator is a mathematical analog of a two-level RC (resistor-capacitor) filter. On the chart (default colors), the red line is the standard terminal Moving Average, the values of which are filtered by the first level filter (yellow line) and then by the second level filter (blue line). Moving Average sets the preliminary smoothing of the price series.
The indicator has the ability to use the sticking together of any combination of its own charts among themselves, if they are at a dis
트레이딩 전략과 기술 지표를 판매하기에 가장 좋은 장소가 왜 MetaTrader 마켓인지 알고 계십니까? 광고나 소프트웨어 보호가 필요 없고, 지불 문제도 없습니다. 모든 것이 MetaTrader 마켓에서 제공됩니다.
트레이딩 기회를 놓치고 있어요:
- 무료 트레이딩 앱
- 복사용 8,000 이상의 시그널
- 금융 시장 개척을 위한 경제 뉴스
등록
로그인
계정이 없으시면, 가입하십시오
MQL5.com 웹사이트에 로그인을 하기 위해 쿠키를 허용하십시오.
브라우저에서 필요한 설정을 활성화하시지 않으면, 로그인할 수 없습니다.