MetaTrader 4용 Expert Advisor 및 지표 - 106

표시기는 두 부분으로 구성됩니다. 1부: 색상 양초가 주요 추세를 보여줍니다. 컬러 캔들(Color Candles)은 컬러 캔들스틱으로 시장 상태를 파악하는 것입니다. 스크린샷에서 보듯이, 색상이 아쿠아(Aqua)라면 시장은 매수 주문을 해야 하거나 매도 주문을 종료해야 하는 상태입니다. 색상이 토마토라면 짧은 주문을 하거나 긴 주문을 종료할 때입니다. 색상이 변경되는 경우 완료될 때까지 기다리는 것이 좋습니다(현재 막대가 닫힐 때까지). 파트 II: 밴드 그리기 안쪽 밴드는 안전 구역으로 정의되고, 바깥쪽 밴드는 마감 주문용으로 정의됩니다. 아래와 같은 거래 전략: 색상이 아쿠아이고 가격이 내부 밴드에 있는 경우 장기 주문을 하고, 가격이 외부 밴드를 넘으면 주문을 마감할 시간입니다. 색상이 토마토이고 가격이 안쪽 밴드에 있으면 짧은 주문을 하고, 가격이 바깥쪽 밴드를 넘으면 주문을 마감할 시간입니다. 참고 : 가격이 내부 밴드에 있을 때 진입 시장에만 해당됩니다. 이는 매우

The Trend Trade indicator displays assumed turning points of the price on the chart in the direction of the trend after correction. It is based on data of the Prise Reversal oscillator with the period 6 and indicators which characterize strength and availability of the trend. When the value of Prise Reversal is in overbought or oversold area (area size is set by a user), and the current trend is confirmed, the Trend Trade indicator draws an arrow pointed to the further assumed price movement.
The indicator compares quotes of the current symbol and a synthetic quote calculated from two specified referential symbols. The indicator is useful for checking Forex symbol behavior via corresponding stock indices and detecting their convergence/divergence which can forecast future price movements. The main idea is that all stock indices are quoted in particular currencies and therefore demonstrate correlation with Forex pairs where these currencies are used. When market makers decide to "buy"

This is a professional multi currency tool. Its main purpose is semi-automatic Forex trading following Elder's Triple Screen strategy. Its wide functionality and ability to quickly change some essential parameters makes it an ideal market interpretation tool, which is indispensable in the common trade analysis. Its main advantage is almost unlimited number of simultaneously analyzed instruments. If the potential technical limits of your monitor resolution allow, multiple indicators can be used.

true Momentum - time-based Indicator it will inform about Momentum, a strong impulse in the appropriate direction it's based on a self-developed candle Pattern, in relation to the ATR (Average True Range)
Quick Start : the indicator is ready to use choose your personal times to trade try an indicator-preset or use an additional indicator, below the pro-settings
Filter Hours Weekdays Moving Averages Correlation Instruments - Moving Averages MACD RSI ADX PSAR Stochastic Bollinger Bands Keltne
These indicators are suitable for scalper tradition. At least 5-10 pips of income should be targeted. The stop should be at least 11 pips. It is suitable to be used in brokers with not much spread. This indicator is used to determine the trend percentage. Trend direction is made in color. It has the indicator warning system: beep, e-mail and has three types of alerts, including messages to mobile phone. The position can be in 4 different corners of the screen. When trend value reaches the value

Advanced Bollinger Bands (BB) indicator. The standard Bands.mq4 indicator was complemented with a range of upper/lower band and signal of possible reverses.
Parameters: BandsPeriod - indicator period. BandsRange - period of determining a range. BandsDeviations - number of standard deviations. Averaging Fast Period - fast period of averaging. Averaging Slow Period - slow period of averaging.
Buffer indexes: 0 - Middle line, 1 - Upper line, 2 - Lower line, 3 - Upper range, 4 - Lower range, 5
This indicator creates more stable Aqua histogram, which crosses the zero line up and down indicating UP and DOWN trend for long and short positions. The indicator generates a pulse red signal, which crosses the zero line up and down more frequently than the histogram. You may use only the histogram for entering the market in the point where the histogram crosses the zero line. You may use only the red line for entering the market in the point where the red line crosses the zero line. You may us

This indicator signals about Stochastic crossing in the trend direction which is determined by the position of the price relative to the Ichimoku cloud.
Features: Flexible settings: filtering signals by bullish/bearish bars ( parameter "BUY - the bullish bar only; SELL - the bear bar only" ); setting levels of Stochastic crossing ( parameters "BUY-signal if Stochastic below this level" and "BUY-signal if Stochastic below this level" ) ability to use the Ichimoku cloud of higher timeframes ( pa
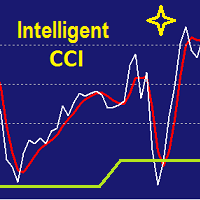
It is CCI indicator with very smooth and noiseless movement that calculates four levels of buy, sell, overbought and oversold dynamically. Professional traders know well that level of 100, 200 or -100 and -200 are not always right and need fine adjustments. This indicator calculates those levels dynamically by using mathematics and statistic methods in addition to shows divergence between indicator and price. Like original CCI, for best result you have better to set proper value for CCI period b

The indicator MilkyWay is calculating and draws a blue or red ribbon as a trend and as a filter. In case the price is moving inside the ribbon you should not enter the market. In case you see a blue trend and the current price is above the blue ribbon than this is a good time to go Long. In case you see a red trend and the current price is below the red ribbon than this is a good time to go Short. Only 1 input parameter: nBars = 500; - number of Bars where the ribbon will appears.

Introduction to Smart Renko The main characteristics of Renko Charting concern price movement. To give you some idea on its working principle, Renko chart is constructed by placing a brick over or below when the price make the movement beyond a predefined range, called brick height. Therefore, naturally one can see clear price movement with less noise than other charting type. Renko charting can provide much clearer trend direction and it helps to identify important support and resistance level
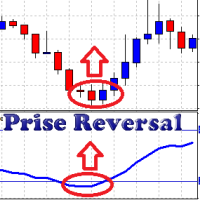
This oscillator takes into account the data from a number of standard indicators. Using this data, it forms its own (more accurate) signals. Prise Reversal helps to identify reversal points during the flat and the price extremums during the trend. At these points, you can enter a counter-trend with a short take profit. Besides, they indicate the time intervals when you cannot open a trend-following deal. After a few days of using the indicator, it will become an integral part of your trading sys

The indicator automatically sets trendlines on the really important points directly on the chart. Timeframe, color and style of the lines can be adjusted. Notification of a breakout above or below the line via a smartphone is possible.
Inputs Timeframe - Choose timeframe TrendlineColor - Choose line color TrendlineStyle - Line styles (solid, dash, dot, dash dot, dash dot dot) Alerts - True = alert SendNotifications - True = Notification via a smartphone

The idea for indicator is using multi-SuperTrend line to define market trend and Multi Moving Average line to find good entry point. The signal doesn't repaint, wait until the bar closed to make sure the signal is confirmed. Lowest RoyalBlue line is used for Buy stoploss. Highest Magenta line is used for Sell stoploss. Indicator supports alert when signal is coming (sends email, push notifications, sound alert). High Timeframe is better for using.
Indicator parameters:
CountBars = 500 — How m

This is a great indicator to find an exit point. We never know when the market is going to change its trend. Many indicators give you a good entry point, but not good to use opposite signal as an exit point, because the signal always comes too late. This indicator will protect your profit as soon as possible when a signal to exit is found! Don't use this signal to enter, it may not be good for making an entry. The signal doesn't repaint, wait until a bar closes to make sure it is confirmed. Indi

The indicator has been developed as a trading system component. It has proven to be an efficient technical tool when following a trend. The indicator shows the most suitable market entry points. It can be especially useful to those who add to positions after corrections in the trend direction. When a signal appears, the indicator generates an alert.
The settings contain the depth of the indicator display history and ability to disable alerts. The signal is generated upon closing of the current

The Nash Equilibrium MT4 draws the channel as a Trend and as Envelopes or Bands. You may use these white lines as levels for overbought and oversold conditions. Inside Bands, this indicator draws dot white line as a median line between the two bands and Aqua or Orange line and you may use this change of colors as moment to enter the market. Parameters nPeriod = 13 - number of Bars for indicator's calculation. nBars = 500 - number of Bars where the indicator is to be shown. Attention : This indic

This indicator is customized for binary option trading like M1 timeframe or turbo option trading. The way a binary option works is from the traders perspective is that you choose whether or not a certain underlying asset (a stock, commodity, currency etc.) is going to go up or down in a certain amount of time. You essentially bet money on this prediction. You are shown how much money up front you will earn if your prediction is correct. If your prediction is wrong, you lose your bet and the mone
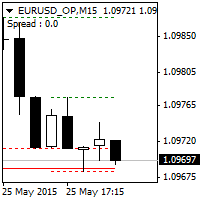
This indicator automatically draws Support and Resistance lines based on High and Low Candle at every timeframe. Support and resistance have a recurring nature as a trader goes through the process of building a strategy. Because of its importance, it is often reasonable for a trader to build object patterns for incorporating these prices into a strategy. When strong support and resistance levels are found, this can enable traders to effectively plot their approach, manage trades, and adjust risk

This indicator draws Fibonacci level automatically from higher high to lower low or from lower low to higher high. With adjustable Fibonacci range and has an alert function.
How to use Fibonacci Risk Reward Ration (R3) into trading strategy Forex traders use Fibonacci-R3 to pinpoint where to place orders for market entry, for taking profits and for stop-loss orders. Fibonacci levels are commonly used in forex trading to identify and trade off of support and resistance levels. Fibonacci retrace
The product combines a manual trade panel with the ability to perform actions automatically in a highly configurable way. Actions include capturing indicator values and then based on those values raising alerts, open/close or partially close trades, scale-in, setting up pending orders, adjusting stop loss, take profit and more. On-chart controls can be configured, such as tick boxes and buttons, so can be fully interactive. The EA also handles money management, news events, hidden stop loss, tak
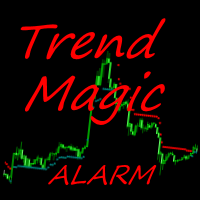
The Trend Magic Alarm shows the direction of a trend and indicates when it changes with a sound, popup window, push or email notice. Blue dots in the chart indicate an uptrend, red dots indicate a downtrend. Levels of former highs + lows give orientation in a chart. Trend Magic Alarm can draw these levels as lines in the chart, see inputs.
Input Parameters Counter : number of bars used for calculation PowerSet : shows how near to the bars the trigger dots are placed DotSize : size of the show
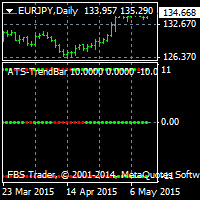
This indicator searches for the strongest trend and works on any timeframe. D1 timeframe is recomended. The product features three lines showing fast, medium and slow bars. If red bars appear at each of the three lines simultaneously, there is a strong bearish trend.
If green bars appear at each of the three lines simultaneously, there is a strong bullish trend. The indicator does not repaint and can be combined with other indicators. It is also suitable for binary option trading.
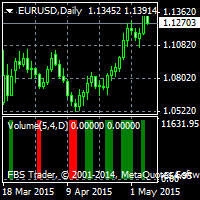
Alpha Trend Spotter (ATS) Volume Break Out This is an indicator that combines Volume breakout/breakdown and Moving Average Breakout/breakdown. It is able to predict further price changes. It is not repainted, not recalculated. All lines are shown at the open of a new candlestick, never winking or vanishing in the current candle. These lines are appeared at the beginning of the current candle. Suitable for M5 to D1 Timeframe. How to Use: If Green line appears, that shows the "oversold" area, so t
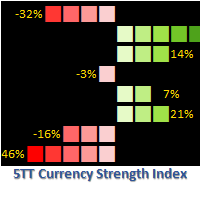
Want to know if to go long or short on any currency pair? 5TT Currency Strength Index is the answer! 5TT Currency Strength Index is a unique indicator for determining the short-term strength of any currency. Each currency strength is determined by an index of the currency with the strength of 7 other major currencies. The indicator is constantly monitoring price action across 28 currency pairs and 56 combinations; taking the following into consideration Price volatility. Short-term price range.

The indicator generates early signals basing on ADX reading data combined with elements of price patterns. Works on all symbols and timeframes. The indicator does not redraw its signals. You see the same things on history and in real time. For better visual perception signals are displayed as arrows (in order not to overload the chart).
Features Easy to use. Filter configuration only requires selection of sensitivity in the " Sensitivity of the indicator " input.
Signals can be filtered usin

Supplement for Alpha Trend Spotter (ATS) Indicator: https://www.mql5.com/en/market/product/8590 This indicator acts by price action. Use it when ATS shows clear Bullish or Bearish Trend for finding the strongest trend each day. Suitable for timeframes M5, H1, H4 and D1. Suitable for Binary Option 5 minutes signal. How to Use: RED Arrow means Sell
GREEN Arrow means Buy

This is a well-known ZigZag indicator. But it differs by the fact that its plot is based on values of the middle line which is set by a user. It can display Andrews’ Pitchfork and standard or Bobokus Fibo levels. NO REPAINTING.
Parameters Period МА — middle line period. Default value is 34. Minimum value is 4. Maximum value is set at your discretion. Used to calculate price - base price to calculate the middle line. The averaging method - method of smoothing the middle line. Turning pitchfork
The Expert Advisor is based on simple mathematics. The EA places two opposite-directed orders. Wherever the price goes, one order will always have a positive result, the second one will have negative. If we average it, then on the return movement of the price (only a few spreads) the averaged orders are closed and there is only profitable order left! The EA trades through its profit. Of course, the averaging positions also add profit due to MinProfit , especially if you use rebate programs to re

StarDust searches for divergences in the values of several indicators considering them as signs of flat and enters the market if a relatively steady trend is detected. The Expert Advisor trades "basic" symbols with a low spread. The best results are achieved on М15. The EA automatically adjusts to 4 and 5-digit quote flows.
Settings Comment_to_orders – comment to a placed order. The field can be left blank if no comment is required. MM – enable money management with automatic setting of a work
The Average Directional Index (ADX), Minus Directional Indicator (-DI) and Plus Directional Indicator (+DI) represent a group of directional movement indicators that form a trading system. This indicator shows ADX data from 9 currency pairs by your choice for all 9 Time Frames. Input parameters From Symb1 to Symb9 - you may change any of this Symbol to any legal currency pair existed on your platform. MainLine = false; - if TRUE then the ADX measures trend strength without regard to trend direct
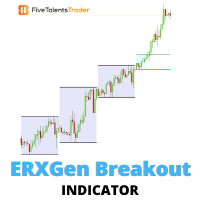
Without volatility, trading the financial market is close to impossible. Profit is made ONLY when the price is moving. The ERXGen (Early Riser Next Generation) system is a short-term trading technique built around the phenomenon that there are certain times during a trading day when the price volatility has the tendency to be high. In essence, ERXGen is based on the very popular London Open Breakout strategy, although with bespoke tried and tested rules that increase consistency and profitabilit
This indicator shows bands (flexible corridor) for a current price movement and the change of trend. The indicator can be used on any time frames and currency pairs. The following input parameters can be easily changed for your needs: nPeriod = 13; - number of bars which the indicator will use for calculation Deviation = 1.618; - coefficient for bands distance from the middle line MaShift = 0; - shift from current bar

기본 차트의 히스토그램 및 테이블, 통화 추세 변화 차트 및 추가 차트 창의 분석 블록 형태로 통화의 추세 및 강도를 시각적으로 표시합니다. 8개 주요 통화(EUR, USD, GBP, JPY, AUD, CAD, CHF, NZD)로 구성된 28개 통화쌍을 분석합니다.
표시 기능 통화 및 기호 추세의 방향과 강도를 결정하고 이를 기반으로 여러 색상의 히스토그램, 표, 디지털 값 및 그래프를 알려줍니다. 통화의 상대적 위치와 변화 추세를 실시간으로 보여줍니다. 지표가 설치된 쌍의 각 통화에 대한 추세 이력을 차트 형태로 나타냅니다. 선택한 모드 중 하나에 따라 통화를 분석합니다(분석 블록).
분석 블록 분석 결과 목록과 버튼으로 구성됩니다. 기본 분석 모드는 Analisis 매개변수로 설정할 수 있습니다. 다음 및 이전 버튼을 사용하여 분석 모드를 전환할 수 있고, 개정 버튼을 사용하여 등급 정렬을 되돌릴 수 있습니다. 분석 모드: 통화 등급(분석=1 매개변수); 통화 추세 강도(

This indicator shows an Up trend ( Green square ) if a parabolic SAR value is below the current price, and Down trend ( Red square ) if a parabolic SAR value is above the current price from all Time Frame for each currency pairs. Input parameters from Symb1 to Symb9 — You may change any of these Symbols to any legal currency pair existed on your platform. step=0.0; — Represents the acceleration factor for PSAR indicator. maximum=0.2; — Maximum value for the acceleration factor for PSAR indicator
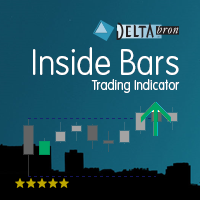
The Inside Bars indicator shows Inside Bars, the Breakout Zone and Breakouts thereof. Inside Bars are an important price action pattern. The price action of an Inside Bar is completely covered by the price action of the previous bar. Inside Bars are most often used on higher timeframes. Settings Inside Bars default settings are good enough most of the time. Feel free to fine tune them to your needs. ATR factor to skip large candles - very large candles should be filtered as they often cover othe
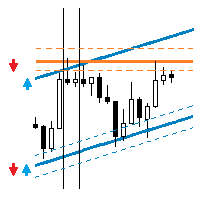
This EA trades support/resistance levels which were placed by a trader (Trend Line from toolbar). The direction of a trade is set graphically by arrows: ↑ - buy; ↓ - sell; - buy or sell in case of crossing support/resistance level. The level is off if inconsistent directions were set, like: ↑↓, ↑, or ↓. If the price is lower than a level it is a resistance level. And opposite is true for support level. There are a few methods available for levels defining, for testing with visualization as

Olimpia Dragged Trends! This dashboard indicator is a visual tool which recognizes dragged trends of 28 pairs in a easy-to-read histogram. You will see a group of squares indicating the sum and average values of trends of the last "...." minutes for each square from L to A in a dragged way. "Dragged Way" means that regardless the hour of the day or opened or closed candle it always shows the present and the pastinformation. You can configure a sequence of numbers with values between 1 minute to

Take Your Trading Experience To the Next Level ! and get the exclusive TFSR-Analyzer for free ! So you have all these outstanding features on up to 20 symbols and all timeframes in a smart and clear Design.
Correct identification of the trends in stock investments are pivotal and TrendFollowerSR ensures this perspective while displaying the correct trend on multiply timeframes to help you go long way as much as possible. The latest technology of the Indicator enables to track whether if

This indicator shows an Up trend (Green square) if a fast MA is above a slow MA and Down trend (Red square) if a fast MA is below a slow MA from all Time Frames for each currency pair. Input parameters: From Symb1 to Symb9. - You may change any of this Symbol to any legal currency pair existed on your platform. Period_Fast = 5; Method_Fast = MODE_EMA; Price_Fast = PRICE_CLOSE; Period_Slow = 21; Method_Slow = MODE_SMA; Price_Slow = PRICE_TYPICAL; Attention: Before using this indicator you have t
Purpose The indicator is intended for manual multi-currency trading based on the Triple Screen Strategy. It works with any symbols located in the Market Watch window of the MT4: currencies, metals, indexes, etc. The number of instruments can be limited by capacity of the МТ4's parameters. But if desired, you can create several windows with various set of instruments and parameters.
Operation Principle The indicator uses the modified Triple Screen Strategy for determining trend direction in the
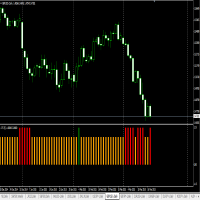
This is an indicator for finding the strongest trend each day, suitable for intraday trading or a swing trading. See the live performance at : https://www.mql5.com/en/signals/93383
How to Use: RED BAR means Bearish Trend for the next candle GREEN BAR means Bullish Trend for the next candle ORANGE BAR means Sideways Trend for the next candle
Example:
If we are using D1 timeframe, see the last BAR, if the bar is RED BAR, open short/sell for today. If we are using H1 timeframe, see the last BA

Market Patroller is a tool designed as an indicator that allows you to review a list of as many instruments as you want and select those that could give you a trade opportunity. It combines the possibility to watch in detail each instrument with all the screen space that you need but with the comfort of be capable to monitor later, multiple instruments trough a "hot list" of opportunities at the same time.
Easy to use:
Install the MarketPatroller on one chart (this will be your detailed analy

The indicator is designed for visual determining market directions. It allows to determine the distance from a price and helps in drawing correct conclusions. Perfectly defines flat zones, horizontal intraday trends and trend movements, and an additional setting allows to use the indicator on any instrument. Does not redraw its readings. You get professional trading indicator for a reasonable price.
Settings: Period_FF = 7 - indicator period Sensitivity_FF = 5 - sensitivity in % Wish you all s
Provides the simplicity of binary options but addresses the shortcomings of regular binary options, namely: Poor risk reward ratio, fixed duration trades, poor broker choice, poor indicators/alerts, no hidden (stealth) stop loss/take profit, etc.
Features 1 to 1 risk reward ratio, calculated automatically (configurable) Manual (with alert) or automatic trade entry (on alert conditions) Lot size calculation (money management) - based on % of account to risk or fixed amount Compact interactive o
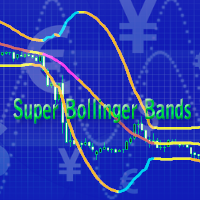
This is a forward-looking indicator for trading on all instruments. An advanced version of Bollinger Bands indicator created by outstanding analyst John Bollinger. One of the main differences of Super Bollinger Bands indicator from its predecessor consists in displaying upper and lower bands behavior on the middle line with some specific colors. Thus, the indicator gives a trader some visual information about trend development at the moment, and not in the past, as majority of other indicators d

The Breakout Indicator That Has Been Proven & Tested! Breakout Analyzer uses an advanced algorithm based on high probability price patterns. Each trade is analyzed on the statistics panel to help you evaluate the best breakout setups.
Bonus Strategy 1
Breakout Analyzer with Volume Critical Watch Video: (Click Here)
Bonus Strategy 2
Breakout Analyzer with Strength Meter
Watch Video: (Click Here)
Features Universal compatibility to different trading systems Analyzes statistics of breako
Advanced ADX indicator that allows operating on many timeframes simultaneously! Unique indicator with the ability to display ADX charts not only on the current timeframe, but also on higher ones. The example attached shows how it is possible to see 3 ADX chart on M5, M15 and M30 timeframes respectively. This functionality allows to significantly improve the accuracy of determining the trend. The Timeframe Delta parameter specifies how much the indicator’s timeframe should be different from the t
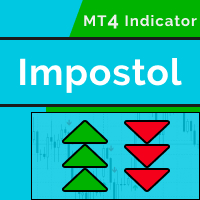
New indicator Impostol is based on the relative strength index (RSI) and trend indicator ADX. With it, you can identify a trend for your trade. Its signals are easy ti interpret, because it shows the recommended entries using up and down arrows. The indicator has a minimum of settings and is easy to use.
Impostol Expert for MetaTrader 4 — HERE
Main features Uses arrows to show market entry points. The indicator is not redrawing. Recommended timeframe is H1 and higher (lower timeframes can

Simply drop the indicator to the graph and support and resistance levels will be shown automatically! The indicator for automatic drawing of support and resistance levels based on THREE points. Identified points are marked on the chart Indicator shows break through price for both bullish and bearish trends (if found) You can specify on how many bars the indicator shall look in order to identify supporting points. In addition, you can select on which time frame the indicator will work. That means

Dedicated to grid trading fans. For a long period I was trading using Manual Trader by Ramil Minniakmetov. I liked this program but soon I came up with an idea to improve the program by making the grid vivid and adding something mine. 1) I taught the program to take swaps and commission into account. 2) If the market allows, the program trails a gain by moving Profit. 3) The program spends a part of the gain partially killing the lower order and moving to a smaller lot, preventing it from going

Volume Gives Depth To Price Action! Volume Critical can accurately locate the cheapest areas to place trades. Enter reversals as early as possible to get the best Risk Reward setups!
Features Aggressive algorithm that anticipates reversals Volume Classifications Gray Histograms - Normal Volume, average market activity Orange Histogram - Trending Volume, increased market activity Pink Histograms - Overbought Volume, we can wait for further confirmation to sell Blue Histograms - Oversold Condit

Overbought describes a period of time where there has been a significant and consistent upward move in price over a period of time without much pullback. Oversold describes a period of time where there has been a significant and consistent downward move in price over a period of time without much pullback. This indicator will show the Overbought conditions (Green Bars) and Oversold conditions (Red Bars). The value of Green/Red Bars represents a power of the price movement. Input parameters numBa

The Currency Barometer indicator is a unique tool that measures the strength of two currencies represented in the pair and compares the difference between them. The result is shown as a histogram where you can simply identify which currency is the strongest. This indicator is designed to measure the strengths and weaknesses of eight major currencies (USD, EUR, GBP, CHF, CAD, JPY, AUD, and NZD) and works on 28 currency pairs. The indicator uses the CI method (Commodity Channel Index) to calc
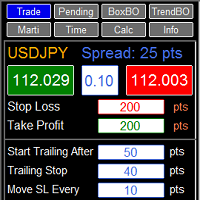
RFX EasyTrade is a professional panel to make your trades as easy as possible. You can perform scalping by acting fast and efficient. You can draw a box or a trend line and let RFX EasyTrade to catch a breakout and manage the trade automatically. You can set pending orders and set Order-Cancels-Order easily. If you are a fan of Martingale strategy just set a few settings on the panel and let RFX EasyTrade to automatically manage the trades. You can trade based on time without waiting long time

The indicator displays trend reversal in the form of arrows. The indicator does not change its values (is not redrawn) after a signal. The program notifies about arrows by means of a pop-up window, or sending notification to e-mail. This is a multitimeframe instrument. Values of the indicator may be displayed from higher timeframes.
Parameters Time-frame - select time session; zero is the current timeframe (Time-frame cannot be lower than the current time interval). Bars - number of bars on th

Any chart has patterns of consolidation which are also called accumulation patterns. These are sections where the market has been on the same price level during significant amount of time, and thus it was accumulating positions. After such accumulation, positions are distributing, and the market passes from flat into trend. The Consolidation Levels indicator is a professional tool which identifies these sections and builds levels according to the price of the market at the moment of consolidatio
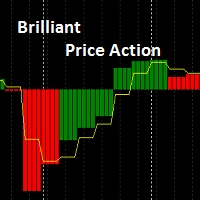
Brilliant Price Action Brilliant Price Action Indicator is a leading Indicator that does not repaint . It can be calculated on a time frame and represented on another time frame. It can be used in trend identification from higher time frames OR for Entry on lower time frames. Moving average modes are: 0 = Simple moving Average. 1 = Exponential moving Average. 2 = Smoothed moving Average. 3 = Linear Weighted moving Average.
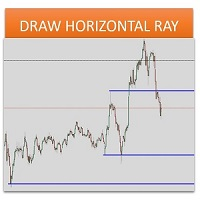
Sometimes we want to draw a horizontal ray from any given price based on a candlestick, and this tool solves that with just 1 key! In order to draw an horizontal ray you just need to drag and drop the indicator over any chart you want and then: 1) Click over ANY candle and then 2) Hit any of the following keys: O - It will draw an horizontal ray right at the OPEN price of the clicked candle H - It will draw an horizontal ray right at the HIGH price of the clicked candle L - It will draw an horiz
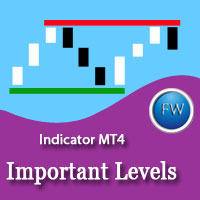
The main rule of the profitable trading is opening trades in the direction of a trend. You can define the current trend using fractal analysis. Important Levels ResSup displays important price levels on the chart. The breakthrough of those levels shows the price direction. The data panel allows you to track the current trends on all timeframes. The current timeframe's important level values are shown in the comments. The indicator can be useful for traders working by levels. It can also be a par
This indicator shows the lateral movement of the price when the indicator line corresponds to zero and Up/Down trend when indicator line is higher / lower than and parallel to zero-line. Of course, the moment when the indicator line is crossing the zero-line is the best moment to enter the market. This indicator has no input parameters... So, the results will be always the same for every time frame and currency pairs.

Knowledge of the strength and weakness of each currency is vital for every forex trader. Our Currency Strength Meter indicator measures the strength of eight major currencies (USD, EUR, GBP, CHF, JPY, CAD, AUD, NZD) by using the Relative Strength Index indicator, also known as RSI. The Currency Strength Meter indicator shows you, simply and quickly, when a currency is oversold, overbought, or in "normal area". This way, you can identify which currency is the strongest and the weakest.
Our

Bulls CD LBT Global (Bulls Convergence/Divergence Low Bottom Top Global) is an analytical bulls convergence/divergence indicator (C, D or CD) between a financial instrument and 22 MT4 indicators working on all periods simultaneously. The indicator measures the power of CD for indicators and periods and is the first one out of the two possible versions (LBT and LTB).
Features The analyzer is not a lagging one. It works by ticks and is able to show CD in the main window even in case the MT4

Bears CD HTB Global (Bears Convergence/Divergence High Top Bottom Global) is an analytical bears convergence/divergence indicator (C, D or CD) between a financial instrument and 22 MT4 indicators working on all periods simultaneously. The indicator measures the power of CD for indicators and periods and is the second one out of the two possible versions (HBT and HTB).
Features The analyzer is not a lagging one. It works by ticks and is able to show CD in the main window even in case the MT4 i

Description Shows Heikin-Ashi candles (often misspelled Heiken-Ashi) on the chart and can alert when candles change color. The alert is useful for both entry and exit. The number of candles of the new color before an alert is raised can be set. The alert can be controlled interactively, directly from the chart. Also includes bonus indicators of current spread and ask/bid prices in large text, color coded as price changes. Usage Heikin-Ashi candles give a much better insight to the underlying tre

The TIL Timeframe Overlay indicator is the perfect tool for multiple timeframe analysis . It does the simple yet powerful task of overlaying a candlestick chart of a different timeframe over another allowing you to see the BIGGER picture and see the underlying TREND amid the noise and volatile price action. Please see the screenshots below for examples. Features: It works in ALL timeframe. It works in ANY instrument/symbol. Displays ENTIRE candlesticks (body and wick) of other timeframes includi

Description Stoploss Master Expert Advisor helps you to manage the virtual Stop Loss. It replaces the real Stop Loss levels by virtual ones with further trailing according to its own strategy of preserving a reached profit level. This EA is used when following the trend. In multicurrency/multisymbol mode, the EA is attached to the chart of each financial instrument separately and tracks positions only of a certain financial instrument. Management is performed only by market orders. The EA starts

This is a non-repainting professional indicator for any currency pair on H1 chart. This indicator comes with Screen, Sound, Email and Push Notifications. Place your trades (risk of 1 to 2% each) when you get BUY/SELL alerts and EXIT when opposite or EXIT alerts. You can set your take profit from 70 to 100 pips when the indicator is attached to H1 chart. Stop loss may not be required, since you are going to close your trades on EXIT alerts.

Prototype 2 is a no-martingale automated system, well testable in a 15-year history period and showing good results in real trading. The default settings are suitable for EURUSD M15, however the EA is well adaptable for any currency pairs and timeframes through its input parameters. The Expert Advisor is suitable both for beginners, because you need only to attach it to a chart, and experienced traders, because in addition to the automatic mode, the EA has options for manual settings of the lot,
MetaTrader 마켓은 MetaTrader 플랫폼용 애플리케이션을 구입할 수 있는 편리하고 안전한 환경을 제공합니다. Strategy Tester의 테스트를 위해 터미널에서 Expert Advisor 및 인디케이터의 무료 데모 버전을 다운로드하십시오.
MQL5.community 결제 시스템을 이용해 성능을 모니터링하고 원하는 제품에 대해 결제할 수 있도록 다양한 모드로 애플리케이션을 테스트할 수 있습니다.
트레이딩 기회를 놓치고 있어요:
- 무료 트레이딩 앱
- 복사용 8,000 이상의 시그널
- 금융 시장 개척을 위한 경제 뉴스
등록
로그인
계정이 없으시면, 가입하십시오
MQL5.com 웹사이트에 로그인을 하기 위해 쿠키를 허용하십시오.
브라우저에서 필요한 설정을 활성화하시지 않으면, 로그인할 수 없습니다.