MetaTrader 4용 새 Expert Advisor 및 지표 - 290
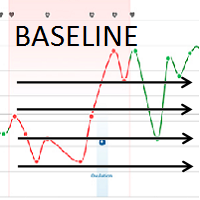
The Baseline Balance tool shows multiple pivot lines for short, mid and long time market cycles. Thus trader can easy identify local or global S/R (support/resistance) levels for better timing of investments and entries to the market. Due to the multifunctional menu directly on chart the settings is fast and accurate. Pivot lines are generated for H1, H4, Daily, Weekly, Monthly, Yearly timeshares. Menu on chart shows following settings: Line Display Settings Middle_Lines – shows middle calculati

MetaCOT 2 CFTC ToolBox Demo is a special demo version of a full-featured library MetaCOT 2 CFTC ToolBox MT4 . The demo version does not have any limitations, but it outputs data with a delay in contrast to the full version. The library provides access to the CFTC reports (U.S. Commodity Futures Trading Commission) reports straight from the MetaTrader terminal. The library includes all indicators that are based on these reports. With this library you do not need to purchase each MetaCOT indicator
FREE

This is the famous FX Sniper's T3 CCI indicator. It is a fixed version additionally containing search for classical and reverse (hidden) divergence. The classical divergence is displayed as a solid line, the reverse divergence is shown as a dotted line. Divergences are drawn in the indicator and on the chart (if you select the appropriate options).
Parameters
CCI Period — Commodity Channel Index indicator period CCI Type of price — price used for indicator calculation T3 Period — Sniper period

Did you ever wish if you can control how to auto close multiple trades in your account that are opened by multiple/different EA's ? Well.. Good news.. You're at the right place because now you can do this with MagicClose. Below are the inputs of MagicClose, going through them will give you a detailed idea what this handy EA is capable of: Chart timeframe: any
Parameters Settings to control the Buys open trades: Enable Buys monitoring - true/false Buys Magics to monitor - Enter magic number foll
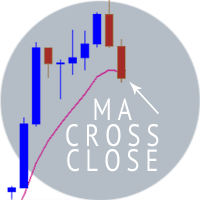
Managing risk is crucial if you want to be successful in trading the Forex market. The purpose of the Moving Average Cross Close is to close your trade automatically once price closes above your choice of moving average time period, in a short trade or below the moving average in a long trade. Having the ability to automatically close open trades under these conditions, gives you the discipline to close trades that are beginning to move against you. As we all know, it is often difficult to close

ALT is a fully automated trading Expert Advisor designed for the EURUSD pair. It trades on the M15 timeframe (not tested on other timeframes or pairs). The trading volume used to open a position is defined by the Expert Advisor, it does not depend on the result of the previous trades.
Features The EA uses automated settings, no need to additionally tune it, except for the stop loss setting . Resistant to a temporary loss of connection or a short-term computer shutdown. After starting the comput
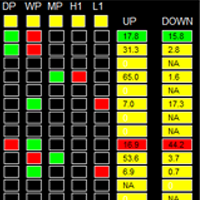
如果产品有任何问题或者您需要在此产品上添加功能,请联系我 Contact/message me if you encounter any issue using the product or need extra feature to add on the base version.
Please re-direct to LINK for free demo version. There are two critical components in a profitable trading system, one is entry (place an order), and another one is exit (close an order). You can exit by time: closing order after London Close for example. You can also exit by position: closing an order when price reaches a certain support/resistance level

AnyChart is a multifunctional tool allowing you to work with non-standard charts in MetaTrader 4. It includes collector of ticks and generator of charts for trading (hst files) and testing (fxt files). Supported chart types are second, tick and renko ones.
Settings Starting Date - start date for chart plotting. Ending Date - end date for chart plotting. Chart Type - chart type: Time - time chart, each bar contains a certain time interval; Tick - volume chart, each bar contains a certain number

A ready-made trading system based on automatic construction and maintenance of Fibonacci levels for buying and selling on any instrument (symbol) and on any period of the chart. Determination of trend direction (14 indicators). The display of the trend strength and the values of the indicators that make up the direction of the trend. Construction of horizontal levels, support and resistance lines, channels. Choosing a variant for calculating Fibonacci levels (six different methods). Alert system

"The VIX Fix is a powerful indicator that detects market bottoms for any asset " The VIX (volatility index) is a ticker symbol of implied volatility of the S&P 500, calculated by the Chicago Board Options Exchange. VIX is a popular measure of market risk, and is one of the best measures of market bottoms that currently exists. Unfortunately, it only exists for the S&P 500... The VIX Fix was published by Larry Williams in 2007, and it synthesizes a VIX volatility index for any asset (not just the

如果产品有任何问题或者您需要在此产品上添加功能,请联系我 Contact/message me if you encounter any issue using the product or need extra feature to add on the base version.
To access the free demo version, please re-direct to this LINK . To access the single pair version, please re-direct to this LINK . Price is likely to pullback or breakout at important support and/or resistance. This dashboard is designed to help you monitor these critical support and resistance area. Once price moves close to these important support and

"The trend is your friend" is one of the best known sayings in investing, because capturing large trendy price movements can be extremely profitable. However, trading with the trend is often easier said than done, because many indicators are based on price reversals not trends. These aren't very effective at identifying trendy periods, or predicting whether trends will continue. We developed the Trendiness Index to help address this problem by indicating the strength and direction of price trend
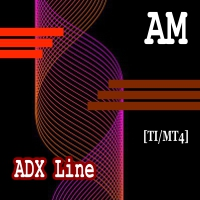
This indicator, interpreting ADX and ATR data, clearly and accurately identifies the current trend, allowing the trader to get the most out of strong price movements. The indicator is intuitive to use: a change in line direction means a change in trend direction; a change in line color warns of an imminent change in direction. The indicator does not repaint and allows you to send notifications about its signals to a mobile terminal and email. Configurable parameters: ADX_Medium_Coefficient - the
FREE
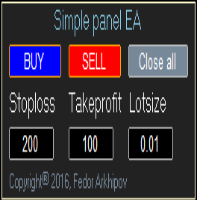
This is a simple panel EA for one-click trading. Unlike the standard panel, it features the Close all button for closing all orders on the current symbol, as well as the ability to enter the stop loss and take profit values before opening an order. The EA distinguishes its orders from others, therefore, the magic number must be specified in the panel settings. The panel is able to take screenshots when opening and closing deals to allow further analysis of the signals for opening/closing orders.
FREE

The EW oscillator is an indicator for the MetaTrader 4 based on mathematical calculations on the price chart.
Distinctive features Generates minimum false signals. Excellent for identifying trend reversals. Perfect for scalping. Simple and easy indicator configuration. Suitable for working on the smaller timeframes (up to H4). Works on any financial instrument.
Recommended symbols EURUSD, EURGBP, USDCHF, AUDNZD, AUDCAD, GOLD.
Recommendations on usage The buy signal is formed when the level 20

WaveTrend Momentum Oscillator is an upgrade to the popular and easy-to-use WaveTrend Oscillator. The WaveTrend Momentum Oscillator adds a momentum component to the original WaveTrend calculation, in order to provide faster and more accurate entry points during trendy market conditions. Do you prefer the original WaveTrend Oscillator? The WaveTrend Momentum Oscillator allows you to switch between momentum and original WT versions. Both provide valuable information depending on the market conditio

FletBoxPush 표시기는 지정된 매개 변수에 따라 가격 변동의 평평한 영역을 결정합니다. 설정:
TimeFrames - 차트 기간 선택. FlatPips - 플랫을 결정하기 위한 포인트 제한 FlatBars - 플랫을 결정하기 위한 막대 수의 제한 CountBars - 가격 움직임을 분석하기 위한 기록의 막대 수, 0에서 기록의 모든 막대가 분석됩니다. 색상 - 플랫으로 정의된 가격대의 색상 PriceTag - 가격 라벨 추가 도면 경고 - 사용자 데이터가 포함된 대화 상자 표시 텍스트 - 경고에 대한 사용자 정의 텍스트 Send_Mail - "메일" 탭의 설정 창에 지정된 주소로 이메일을 보냅니다. 제목 - 이메일 헤더 Send_Notification - "알림" 탭의 설정 창에서 MetaQuotes ID가 지정된 모바일 터미널에 알림을 보냅니다.

Professional Trend Convergence/Divergence Indicator TCD indicator is based on the Convergence/Divergence of Trend and shows you " up trend " (when trend grows) and " down trend " (when trend is falling).
In the middle is an adjustable "stop area" on which you cannot trade.
Briefly, the TCD shows you when to start or stop buy/sell .
TCD indicator can run many instances, for all time frames and includes all 0 lag MAs . (Please see MAi indicator code section)
With TCD your trading becomes more pre
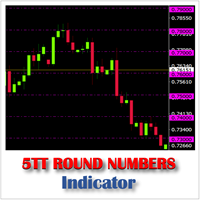
Like Support and Resistance levels, Round Numbers refer to price levels ending in one or more zeros, such as 125.00, 1.0350, 0.8750, 74.50, etc. These are psychological levels where financial institutions and traders expect price to either stall, retrace or breakthrough. On a price chart these figures are generally considered to rule off levels at the 50 and 100 mark. 5TT Round Numbers Indicator makes it absolutely easy for the trader to identify these levels on the chart without the laborious a

MetaCOT 2 CFTC ToolBox is a special library that provides access to CFTC (U.S. Commodity Futures Trading Commission) reports straight from the MetaTrader terminal. The library includes all indicators that are based on these reports. With this library you do not need to purchase each MetaCOT indicator separately. Instead, you can obtain a single set of all 34 indicators including additional indicators that are not available as separate versions. The library supports all types of reports, and prov

RSI EA Revolutionize Your Trading with Our Cutting-Edge RSI E Expert Advisor Tired of spending countless hours analyzing charts? Our advanced Expert Advisor, powered by the robust RSI E indicator and equipped with a sophisticated trailing stop loss feature, offers a fully automated solution to your trading needs. Key Features: * Fully Automated Trading : Set it and forget it! Our EA executes trades based on precise signals generated by the RSI E indicator. * Advanced Risk Management : Protect yo
Operation principles The Expert Advisor works on any timeframe and symbol. The main idea: flat is always followed by a strong movement. The EA determines when the price is located within a particular Delta_Range price range for a certain amount of time set in Time_Minus_Minut . Both parameters are customizable. The robot sets two BUYSTOP and SELLSTOP pending orders for a specified delta_stop_run time period on a Set_Delta_Price_Stop distance from the previous price range with the specified Set_T

A new way of managing your trades – efficiently, automatically and with no emotions. Control various markets and manage many different trades at one moment. Grasp your competitive advantage and ultimately find out what profitable trading looks like! Trademanager is a piece of software developed for MT4 platforms. This tool enables you to completely set up all parameters for many different trades on many different markets – at one time and with no emotions as psychological obstacles. Must-need to

The main objective of the indicator is an accurate forecast of short-term trends. A rising channel is usually broken downwards and replaced with a falling one when confirmed by tick volumes, while a falling one is usually broken upwards and replaced with a rising one again when confirmed by tick volumes. Sometimes, upward and downward channels are replaced with flats. A channel width and duration are defined by the market situation and market phase (bullish or bearish). In our case, tick volumes

The "Irisha" is an Expert Advisor, in which we attempted to implement the ability of trading on smaller timeframes (1-15 minutes). The main idea lies in opening frequent trades and in the ability to "cover" losing trades with profitable ones. However, we had to resort to the Martingale strategy to implement the idea. Due to this, it is recommended to have a large deposit and/or cent account for using this EA. Operation of the EA on a live account can be evaluated here: https://www.mql5.com/en/si

This is a simple and efficient indicator based on market logic. The indicator creates a range chosen by a trader. Trader selects only two parameters. The first one is the number of candles that define the frame. The second one is the number of candles needed for confirmation frame. The indicator shows all situations in history and works with the actual movement of the market. The indicator works on all timeframes . You are not limited by use of different timeframes, the indicator is able to adap
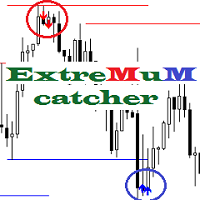
The Extremum catcher indicator analyzes the price action after breaking the local Highs and Lows, generates price reversal signals with the ability to plot the Price Channel. If you need the version for MetaTrader 5, see Extremum catcher MT5 . The indicator takes the High and Low of the price over the specified period - 24 bars by default (can be changed). Then, if on the previous candle the price broke the High or Low level and the new candle opened higher than the extremums, then a signal will

This utility provides the ability to use hot keys in manual trading instantly responding to the current market situation. You can assign hot keys to open/close positions by their type, close all positions on the current chart and remove all orders on the current chart. You can also assign hot keys for five predefined trade volumes and switch between them if necessary with no need to change the volume manually from time to time. It is also possible to set the auto calculation of a trade volume in

Super sniper is the indicator that you're looking for This indicator has an active signal that also able to send push notification to your mobile MetaTrader 4 (see the screenshot for tutorial), so you won't miss any signal during active market. The signal is very simple, " down arrow " for sell and " up arrow " for buy. There are several options as below _SEND_NOTIF_TO_MOBILE: to enable push notification to your mobile MetaTrader for signal _ALERT_SIGNAL: to enable alert signal _SHOW_EMA_TREND:
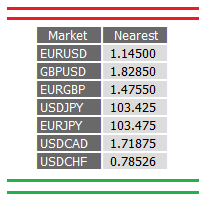
Price level alert is a software that gives you an overview of your all drawn levels (supports and resistances) for more than 10 markets in only one elegant table which you can see right in your chart. Price alert is not only this, it also sends you notification (alert) when a market has reached one of your predefined levels. Therefore, this is a must-have tool for all traders who want to cut the time sitting in front of a computer significantly and not to miss any trade.
Settings (inputs) Symbo
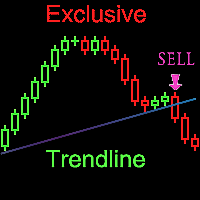
Every experienced trader knows that the trend lines should be paid attention in Forex trading. But plotting trend lines takes time, and there can be many of them on the chart as well... Yikes!!! Do you want to know how to easily and simply automate this process? Then read on. There is a solution - a smart and reliable indicator of trend lines - the Exclusive Trendline . All you need to do is attach the indicator to the chart, and it will draw all possible trend lines for you. You just have to ad

현재 20% 할인!
초보자 또는 전문가 트레이더를 위한 최고의 솔루션!
이 표시기는 Exotic Pairs Commodities, Indexes 또는 Futures와 같은 기호에 대한 통화 강도를 표시하는 데 특화되어 있습니다. 금, 은, 석유, DAX, US30, MXN, TRY, CNH 등의 진정한 통화 강도를 보여주기 위해 9번째 줄에 모든 기호를 추가할 수 있습니다. 이것은 독특하고 고품질이며 저렴한 거래 도구입니다. 우리는 많은 독점 기능과 새로운 공식을 통합했습니다. 새로운 추세 또는 스캘핑 기회의 정확한 트리거 포인트를 정확히 찾아낼 수 있기 때문에 거래가 어떻게 개선될지 상상해 보십시오.
사용 설명서: 여기를 클릭 https://www.mql5.com/en/blogs/post/708876
모든 시간대에 작동합니다. TREND를 빠르게 확인할 수 있습니다! 새로운 기본 알고리즘을 기반으로 설계되어 잠재적인 거래를 더욱 쉽게 식별하고 확인할 수 있습니다. 8개의

Professional 0 Lag MAs Trend Sensor Indicator MAtsi is a trend sensor indicator , where 2 MA-s operates simultaneously .
It is designed to cover a wider range of dynamic trends, where MAi is not so effective.
Included averages are described in MAi indicator code section.
MAtsi indicator can run many instances, for all time frames at once, so you can test and compare results with different settings.
It is very fast and has, like all our indicators, a built-in " slider history testing " technolog

Breakout based strategy, generates market entry signals when the price crosses a border of a certain price range. To create the strategy, we have used the history data with 99,9% quality for the last 15 years. The best signals had been selected and the false signals have been filtered out. The Expert Advisor performs technical analysis and considers only the breakouts that show the best result.
It uses a system of filtering false signals. The EA uses adaptive trailing stop. The EA uses a very

Professional 0 Lag Moving Averages Indicator MAi Indicator is a complete of moving averages with no lag .
With MAi you can finally trade in real time with no lag, so your trading becomes more precise, realistic and more effectively.
Please see included averages and the combinations with “Hull” equation below in code section.
MAi indicator can run many instances , for all time frames at once, so you can test and compare results with different settings .
It is very fast and has like all our indica

Bid Ask Level is a very simple indicator but, at the same time, very powerful . Using the logic of the minimum and maximum of the previous periods is able to intercept the important levels of demand and supply. The indicator permits setting the numbers of history candles to read very important levels in the past and show them in the current chart. You can see these power levels with horizontal lines designed on the chart. The indicator also permits uploading many different levels (of different t

The problem Are you tired of spending countless hours looking through your chart history to verify that your trading idea will work? Do you load up a chart with your favorite indicators and then scroll for hours looking for when you would have placed a trade based on your signal? Are you tired of trying to do the math to figure out how that trade would have turned out? Wouldn't it be nice to have a way to manually place trades while running through that history in your strategy tester? Wouldn't
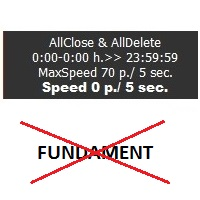
Sensor utility is a tool for protecting the capital against unexpected market movements. Today's markets are unpredictable. Are you afraid of big moves? This tool monitors the movements of the market and may remove pending orders or open positions while increased volatility. The utility works with the actual movement of the market. The indicator works on all timeframes. You are not limited by use of different timeframes, the indicator is able to adapt. On the screenshots, you can see basic setti

AMD Trend Risk Reward is an indicator which belongs to the group of trend indicators. It provides the possibility to take the correct decisions about timely market entrances or exits. Trend horizontal can cause a lot of headaches to the traders and can be the reason of money loss. By automatic optimizing the settings of our AMD Trend Risk Reward indicator you can avoid most of them and save your money. How to choose the best chart? Press the button [O] on the chart. Indicator automatically optim
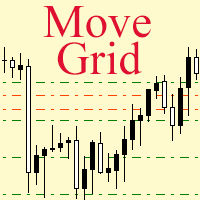
If a complex grid with specified stop loss and take profit levels has been created in the wrong place by mistake, it is not necessary to remove it and start over again. The grid can be moved to a new place using the mouse. Drag the script to the chart and drop it where the grid should be moved. The grid will be moved, keeping the distance between orders, distances to stop loss and take profit. The script works exclusively with pending orders , market orders will be left unchanged.
Input Paramet

Indicator for collecting and storing ticks from the real market. Ticks are available in offline mode. The tick chart works like the standard time charts in MetaTrader 4. All indicators work on the tick chart. It is good for finding "pins" and spikes before the news releases. The indicator is good for scalpers and scalper systems. Templates also work. Settings: Period. - number of the period for collecting ticks. Default value is 2. You cannot use the standard minutes 1, 5, 15, 30, 60(hour), 240(
The indicator determines and plots price channels or lines, reading information from multiple timeframes (from current, second and third) simultaneously. Color and width of lines for each timeframe can be customized. It is also possible to set different distance between the Highs and Lows for plotting channels or lines.
Parameters History - maximum number of bars to plot channels or lines; Distance - minimum distance from one High (or Low) to another when plotting lines; Shift - shift for sever

Master Levels mt4 ( version for MT5 ) analyzes market situation over the last few days and determines current levels. It tracks a breakout (or rebound) of these levels. Trades open in the breakout (rebound) direction. The EA is fully automated. Master Levels is equipped with a flexible position management system. There is opportunity to close a position with two parts. And there is a feature of a trailing stop, which allows to protect gain profit. Depending on the settings, the EA can work both

The "Volumes Alert Push Mail" is an indicator for the MetaTrader 4, which is based on the standard Volumes indicator with functions for generating alerts, sending messages to email and mobile terminals.
Advantages of the "Volumes Alert Push Mail" indicator Highly customizable visualization.
Receiving signals in any way possible: emails, push-notifications and alerts.
Free technical support from the developer.
Parameters Volume - indicator value for sending the messages.
Bar - the setting accep

The indicator determines the inside bar and marks its High/Low. It is plotted based on the closed candles (does not redraw). The identified inside bar can be displayed on the smaller periods. You may set a higher period (to search for the inside bar) and analyze on a smaller one. Also you can see the levels for Mother bar.
Indicator Parameters Period to find Inside Bar — the period to search for the inside bar. If a specific period is set, the search will be performed in that period. Type of in

RFX Market Speed is an indicator designed to measure a new dimension of the market which has been hidden from the most traders. The indicator measures the speed of the market in terms of points per second and shows the measurements graphically on the chart, and saves the maximum bullish and bearish speeds per each bar. This indicator is specially designed to help the scalpers of any market with their decisions about the short bias of the market. Note: The indicator uses real-ticks and CANNOT be
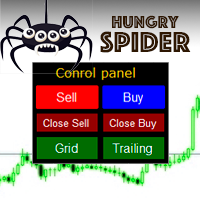
Hungry Spider EA is a convenient trading panel and a useful assistant to manage your trades and to set a grid of orders ( not pending orders ) with a push notification option.
Hungry Spider is a trading panel to help you save time while trading. The EA does not open orders, but it sets a grid. The grid then opens at actual prices without using pending orders. The grid can be turned on and off in a single click. The EA includes a Trailing Stop function, which can also be activated in a single cli
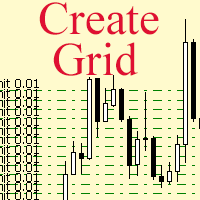
The script allows to use the mouse for placing a grid of orders with fixed or variable step quickly and with as few mistakes as possible. Drag the script to the chart using the left mouse button and release. The grid will be plotted starting from that point. If the current price is lower than the grid start point, the grid will be placed "to the north" towards the buys, and if higher - towards the sells, "to the south". Setting take profit and stop loss is left to trader's discretion.
Input Par

Two Period RSI compares long-term and short-term RSI lines, and plots a fill between them for improved visualization. Fill is colored differently according to an uptrend (short period RSI above long period RSI) or a downtrend (short period RSI below long period RSI). Short-term RSI crossing long-term RSI adds a more robust trend confirmation signal than using single period RSI alone. This is a small tool to help visualize and confirm RSI trends. We hope you enjoy! Looking for RSI alerts? You can
FREE
Tipu Stops is a simple indicator that plots buy/sell stop loss channels and pips value using commonly used indicators. Tipu Stops also works complementary to the Tipu Trader Panel. You can use the stop loss values from Tipu Stops in Tipu Trader before using the panel for trading.
How to Use Add the indicator to the chart and select your preferred method of stop loss plot. You may choose from the following methods: Average True Range on PRICE_CLOSE. Average True Range bands on Hull Moving Averag
FREE

SuperTrend Alerts adds alerts to the widely popular SuperTrend indicator. As the name suggests, SuperTrend is a trending indicator which works best in trendy (not choppy) markets. SuperTrend is extremely popular for intraday and daily trading, and can be used on any timeframe. Place a call when the price closes above the SuperTrend line, and place a put when the price closes below the SuperTrend line. These crossovers are highlighted by non-repainting up/down arrows.
Alerts Email, message and s

Two Period RSI + Alerts compares long-term and short-term RSI lines, and plots a fill between them for improved visualization. Fill is colored differently according to an uptrend (short period RSI above long period RSI) or a downtrend (short period RSI below long period RSI). Short-term RSI crossing long-term RSI adds a more robust trend confirmation signal than using single period RSI alone. This is a tool to help visualize and confirm RSI trends. We hope you enjoy!
Alerts Email, message, and

Great for scalper/intraday weapon for your ease daily trading. Scalper weapon will suit's you for any trading condition, whether it's intraday / scalper this tool is important for you which providing the missing function on the native MT4 platform. You have to check Allow Auto Trading by pressing Ctrl+O, going to Expert Advisors tab, and checking " Allow automated trading" . also to ensure the " auto trading " is green.
Input Parameters _MINIMIZED_AT_START: to chose whether the panel is minimiz
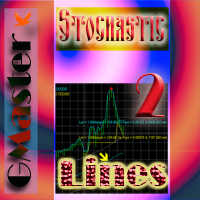
The Greed Master Stochastic 2 Lines indicator uses the Stochastic indicator. And based on the data on intersections with the levels , it plots two High and Low lines according to the rates for the change period of the Stochastic indicator. All parameters are set to default, but they can be adjusted if necessary. Also, the arrows show the High and Low price values for the specified period. If you correctly fill parameters of the account and exchange rate of the currency in the country the indicat

The indicator automatically identifies the 1-2-3 pattern on the chart. The indicator is able to monitor the formation of pattern in real time. It informs the trader when the pattern is completely formed (when the price breaks the line in point 2) and displays the completed patterns in history. The patterns are never redrawn. The indicator can identify patterns on any instruments (currency pairs, stock market, gold, etc.) without the need to adjust to each instrument. Simple and clear visualizati

If you are hiring the signal at website mql5.com to earn investment profits, the lot size on your MT4 software received from the signal will be limited to reduce risk. Because the lot size is too small, investment profits will be very small. This is a tool to increase the lot size of the order. This tool will automatically copy the order from the original order. The copied order will have the lot multiplier according to the parameters you declare. All the process of opening and closing the order

If an Expert Advisor cannot make profit on any instrument or any timeframe, it is a bad Expert Advisor. This algorithm used the regularities inherent to any market. You can adjust this EA for working on virtually any instrument, or even on all of them at once, it all depends on your trading style. The algorithm determines the reversal points with a certain probability based on the statistical data. The market is considered to be a random process. A random process has a normal distribution of pro
FREE
The Moving Average / Price Proximity Alert system is a highly configurable MT4 indicator which incorporates a fully automated alert system for monitoring a trader defined moving average in relation to price action. Automatically receive alerts when price action touches or crosses over a trader defined moving average Push alert capability Email alert options On screen pop up options Configurable alert module
Precision Alert Controls Traders can control: The minimum time between alerts in seconds

Automate your charting with the All-In-One SRES channel indicator. This is a complete package designed to address 3 questions: (1) when to enter a trade, (2) what is a good exit point, and (3) what is the probabilistic likelihood of success of the trade. Longevity and Flexibility : The All-In-One SRES calculates and charts S upport, R esistance, E xpected range, and a S queeze channel, and is enormously flexible for many trading strategies. Each option is customizable to fit your strategy, and c

The EA can trade multiple currencies. Please check our signals ( https://www.mql5.com/en/users/ugur-edin/seller ) for detailed information. No grid or martingale! No manual configuration or adjustment needed! Every trade is protected by stop loss. This Expert Advisor only trades for a short time frame at night, during the ending of the New York session. It uses low volatility moments and enters trades based on indicators. It then manages those trades with dynamic stop losses and take profits als

EMA Separation Coefficient reflects the separation between short-term and long-term exponential moving average trend resistance, as well as the direction of the current movement. Pay attention to potential crossover points when the coefficient approaches zero, this may indicate an upcoming breakout or reversal. Wait for confirmation of the trend before entering the trade, and exit when the coefficient forms a max (for calls) or a min (for puts). This is a small tool to help visualize the differe
FREE

EMA Separation plots 2 exponential moving averages, and a fill between them. The fill is colored differently according to an uptrend (short period EMA above long period EMA), or a downtrend (short period EMA below long period EMA). This is a small tool to help visualize the difference between long and short period averages. We hope you enjoy! EMA Separation can also be paired with our free EMA Separation Coefficient
Parameters Short period (Default=10): # bars used to calculate short period EMA
FREE

Now there is no need to check volatility on third-party websites in order to determine the average movement rage of a certain currency pair. The Truly Volatility indicator is designed for determining volatility for the specified period and is displayed in a separate window as a histogram and line. If attached to a chart with the Н1 timeframe, the indicator displays the average price movement for each hour (from 0 to 23) based on the history data. On the D1 timeframe it displays the average movem
FREE
SRB Grid is a grid trading Expert Advisor, which uses standard indicators Stochastic, Rsi, BBands for entries. Set_Name - the name of the set file TypeTrades - Expert Advisor operation mode MaxSpread - maximum allowable spread value MinLeverage - minimum leverage filter MagicNumber - unique ID for the EA's orders Slippage - slippage in points AutoMMBalance - automated money management. Example : BaseLotSize = 0.01, and AutoMMBalance = 1000, with a deposit of 5000$ the lot of the first order will
FREE
Expert Advisor for trading the GBP/USD on the M5 timeframe. It is based on the strategy of "waiting out", the market entry (and exit) points are determined on the basis of correlation of a number of indicators. The trading volume for opening a position depends on results of previous trades. It is possible to limit the amount of risk (AutoMM parameter). It is also possible to set the maximum spread, above which the EA will automatically pause trading (MaxSpread parameter).
Settings TakeprofitS -

Professional and highly customizable utility for automated trading. It can become an indispensable to any trader regardless of the skills. It will help to save the time that would be required for daily routine activities and it will allow to develop custom strategies. The utility can also work manually opened orders and orders opened by any other EAs. This can be applied to attempt to recover the losing trades or even save the trader form losing the deposit. The utility allows to automate the tr

Four-layer Neural Network Expert Advisor based on perceptrons that analyze the opening, closing of candles, the maximum and minimum price for a given period of history. The moving average serves as an additional filter. Several parameters are used in optimization of the perceptron, weight coefficient " x1 – x4 ", optimize from 5 to 100 with step 5 and " y1 – y4 " bar coordinate, optimize from 2 to 50 with step 2. Optimize on "every tick" on a history of 2–3 months. The feature of the EA is that

Simple and powerful CSM (Currency Strength Meter) Currency strength meter is the indicator you need to identify the current actual trend based on a unique calculation, which is generally used as another fundamental analysis for those who are not capable of reading the fundamental clearly. Currency strength meter will read the current strength of related currency pair (Forex) where generally consist of AUD, NZD, CAD, CHF, JPY, EUR, GBP, and USD for the main major currency.
Feature Easy reading b

The trading system is based on scanning for entries of large limit buyers or sellers. When the price fluctuates in a narrow range for a long time, it can be assumed that there are limit orders of major participants placed at that location. The feature of the EA is that it has the ability to change the strategy of closing and maintaining orders right from the built-in panel on the chart. For example, if placing pending orders is enabled, then all trailing functions will work as a whole based on t

The Expert Advisor with strategy based on the Bollinger Bands indicator. When the price is above or below the Bollinger Bands and the channel expands by the specified range, a trade is opened. For example, if the Ask price is less than the lower band of the indicator and the difference between the upper and lower bands of the indicator exceeds the distance of Delta, the EA will open a buy. For sell trades it is the opposite: if the Bid price is greater than the upper band of the indicator and th
MetaTrader 마켓은 MetaTrader 플랫폼용 애플리케이션을 구입할 수 있는 편리하고 안전한 환경을 제공합니다. Strategy Tester의 테스트를 위해 터미널에서 Expert Advisor 및 인디케이터의 무료 데모 버전을 다운로드하십시오.
MQL5.community 결제 시스템을 이용해 성능을 모니터링하고 원하는 제품에 대해 결제할 수 있도록 다양한 모드로 애플리케이션을 테스트할 수 있습니다.
트레이딩 기회를 놓치고 있어요:
- 무료 트레이딩 앱
- 복사용 8,000 이상의 시그널
- 금융 시장 개척을 위한 경제 뉴스
등록
로그인
계정이 없으시면, 가입하십시오
MQL5.com 웹사이트에 로그인을 하기 위해 쿠키를 허용하십시오.
브라우저에서 필요한 설정을 활성화하시지 않으면, 로그인할 수 없습니다.