Expert Advisor Based on Weekly Pivot Indicator

작업 종료됨

실행 시간 6 일
피고용인의 피드백
Thanks for the project. Looking forward to the next one!
고객의 피드백
Great understanding of how Expert Advisors works and specific specifications to a project. Will get the project requirements down and complete with 100% satisfaction. A+

명시

The expert advisor will use the weekly pivot indicator and either buy above the weekly pivot level to the next level(R1) or sell below the weekly pivot level to the next level (S1). This EA will be able to place stop losses and take profit based on prior weeks support and resistance levels. 

Please refer to documentation as specific rules must be followed to execute the trade. No trade will be held longer than a week, any trade will be closed prior to close of market on Friday at 430pm (EST).


Requirements Document:

The purpose of this document is to layout specific requirements


Pivot Level Trading Plan:


Indicators used:

Pivot Level Indicator with 7 support and resistance levels:

S1 = Support 1

S2 = Support 2

S3 = Support 3

WP = Weekly Pivot

R1 = Resistance 1

R2 = Resistance 2

R3 = Resistance 3


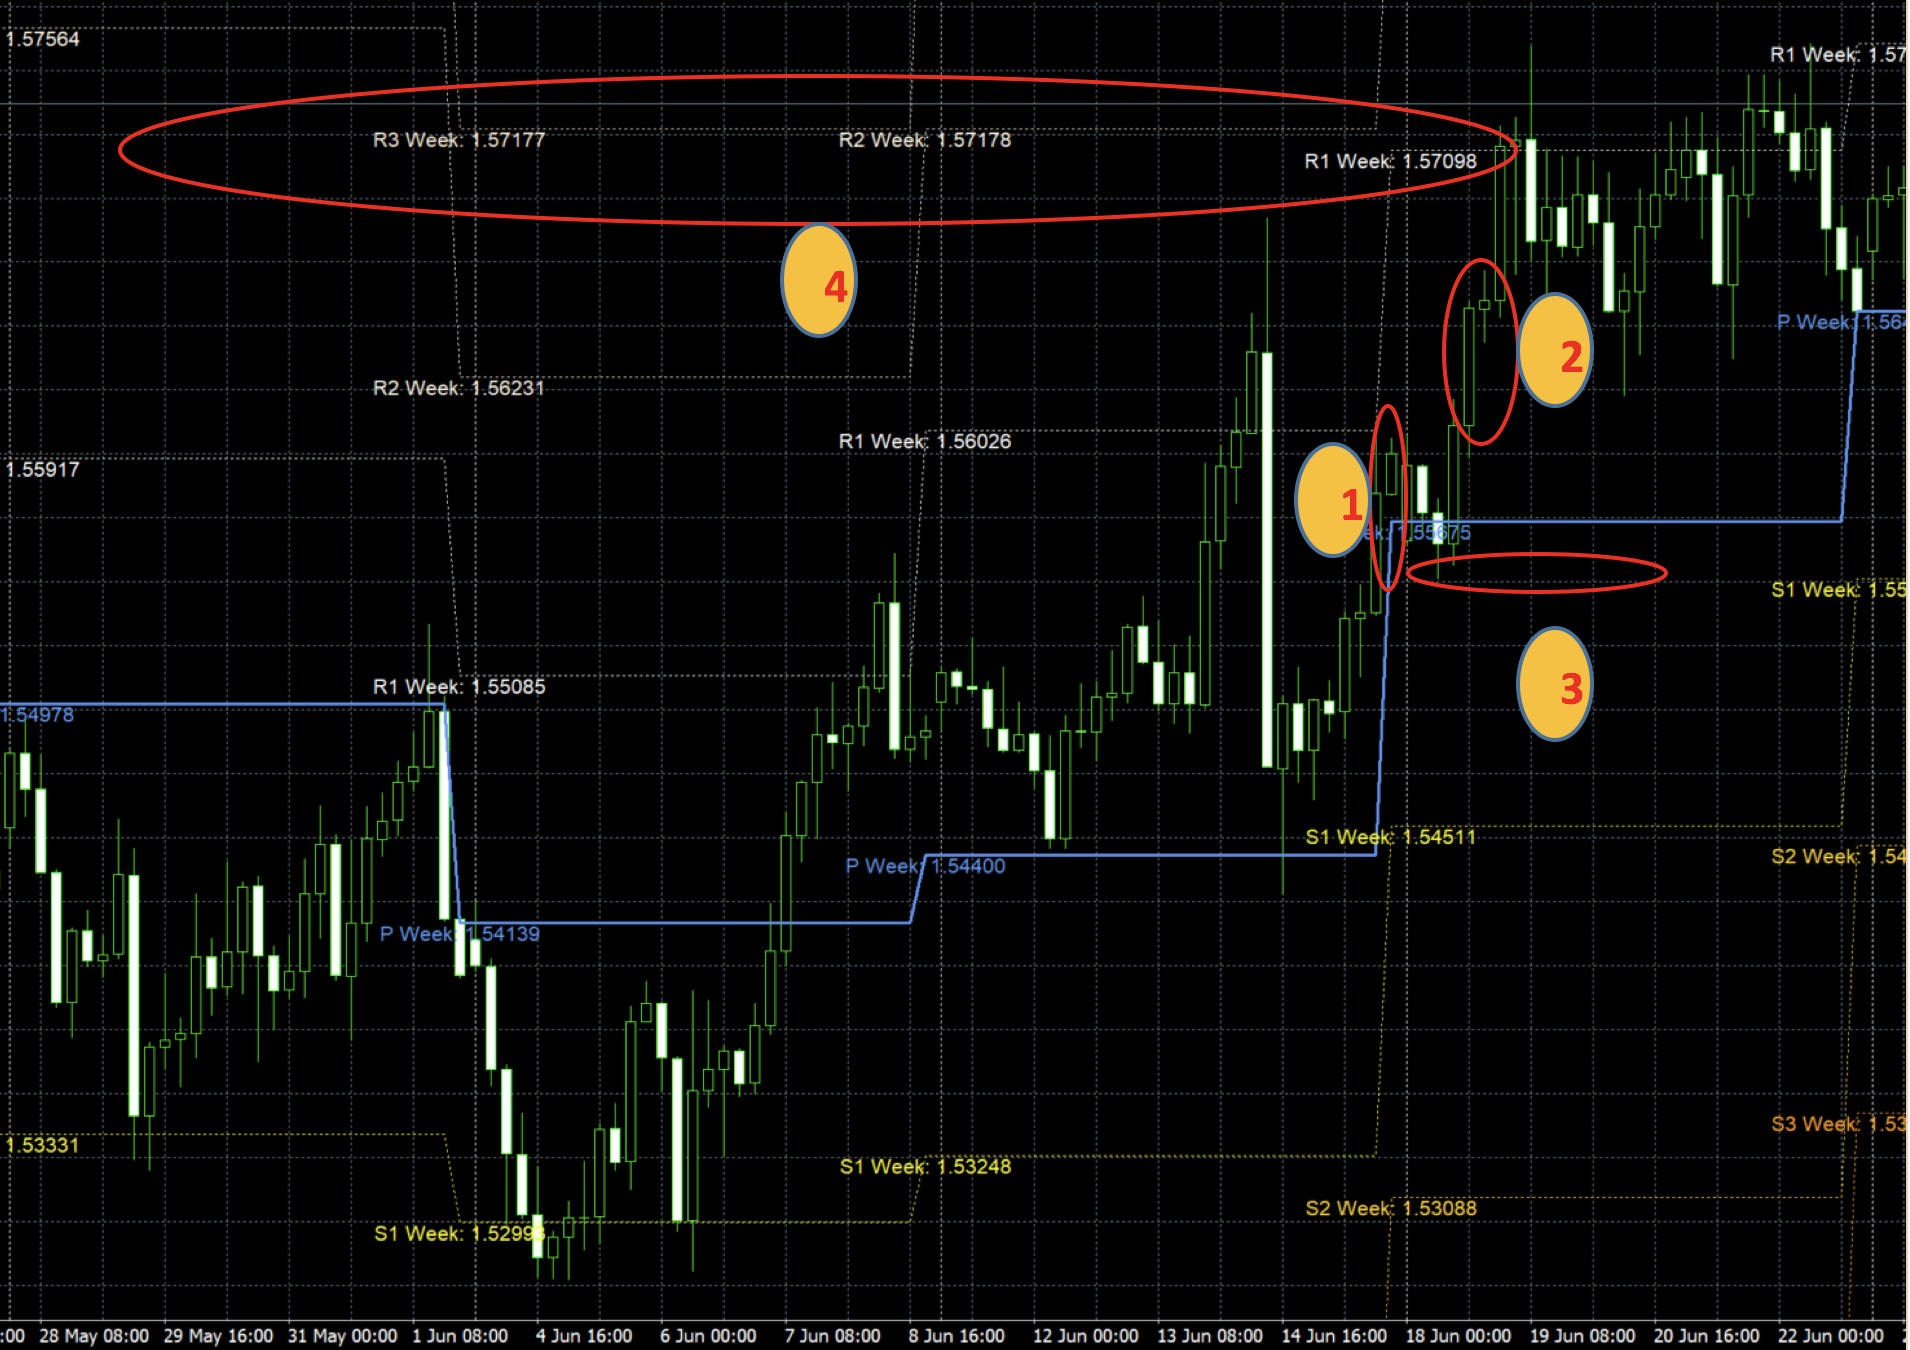
Buy Order Placement:

In order to be a buy order the following conditions must be met:


·            The price must close above the weekly pivot (WP)

·            1 bar must fully close above the weekly pivot (WP)

·            The barmustclose above the opening bar for that week (the very first bar for that week

·            Barmustbe a full/complete buy bar (no indecisive or small bars)


Afterallthe above conditions have been met then the following will apply to the order placed:


·            Lot size of 14.0 will be placed (should be adjustable/able to alter based on stop loss placement) 

·            Stop loss for the order will be placed be 20 pips below weekly pivot (WP) for that week

·            Take profit will be placed at resistance 1 for that week OR the system will look back 5 weeks in the past to look at the “best” place for take profit placement


Order will be closed if the take profit OR the stop loss has been executed for that trade


Example:


1.        This denotes that this is the first opening bar of the week

2.        This denotes that this is the bar that the trade should be entered on. This is a long buy bar that is above the blue line weekly pivot (WP) for that week

3.        This denotes that the stop loss should go below 20 pips below the blue line weekly pivot (WP) for that week

4.        This denotes that the take profit should be placed somewhere in that region belowR2/R3 week of either of the previous weeks. The system should be able to look at the current week for the pivot levels that are formed R1, R2 or R3 to see if a take profit will be suitable there OR look back 5 weeks to see if it will be better suited there. For this example it is better to place the take profit somewhere in the past (where the red oval highlights) R3 for the week of June 1stto June 8th, R2 for the week of June 8thfor June 18thor R1 for the week June 18thto June 22th.. There are three possible cases to place the take profit in this situation which have been outlined by the red oval.


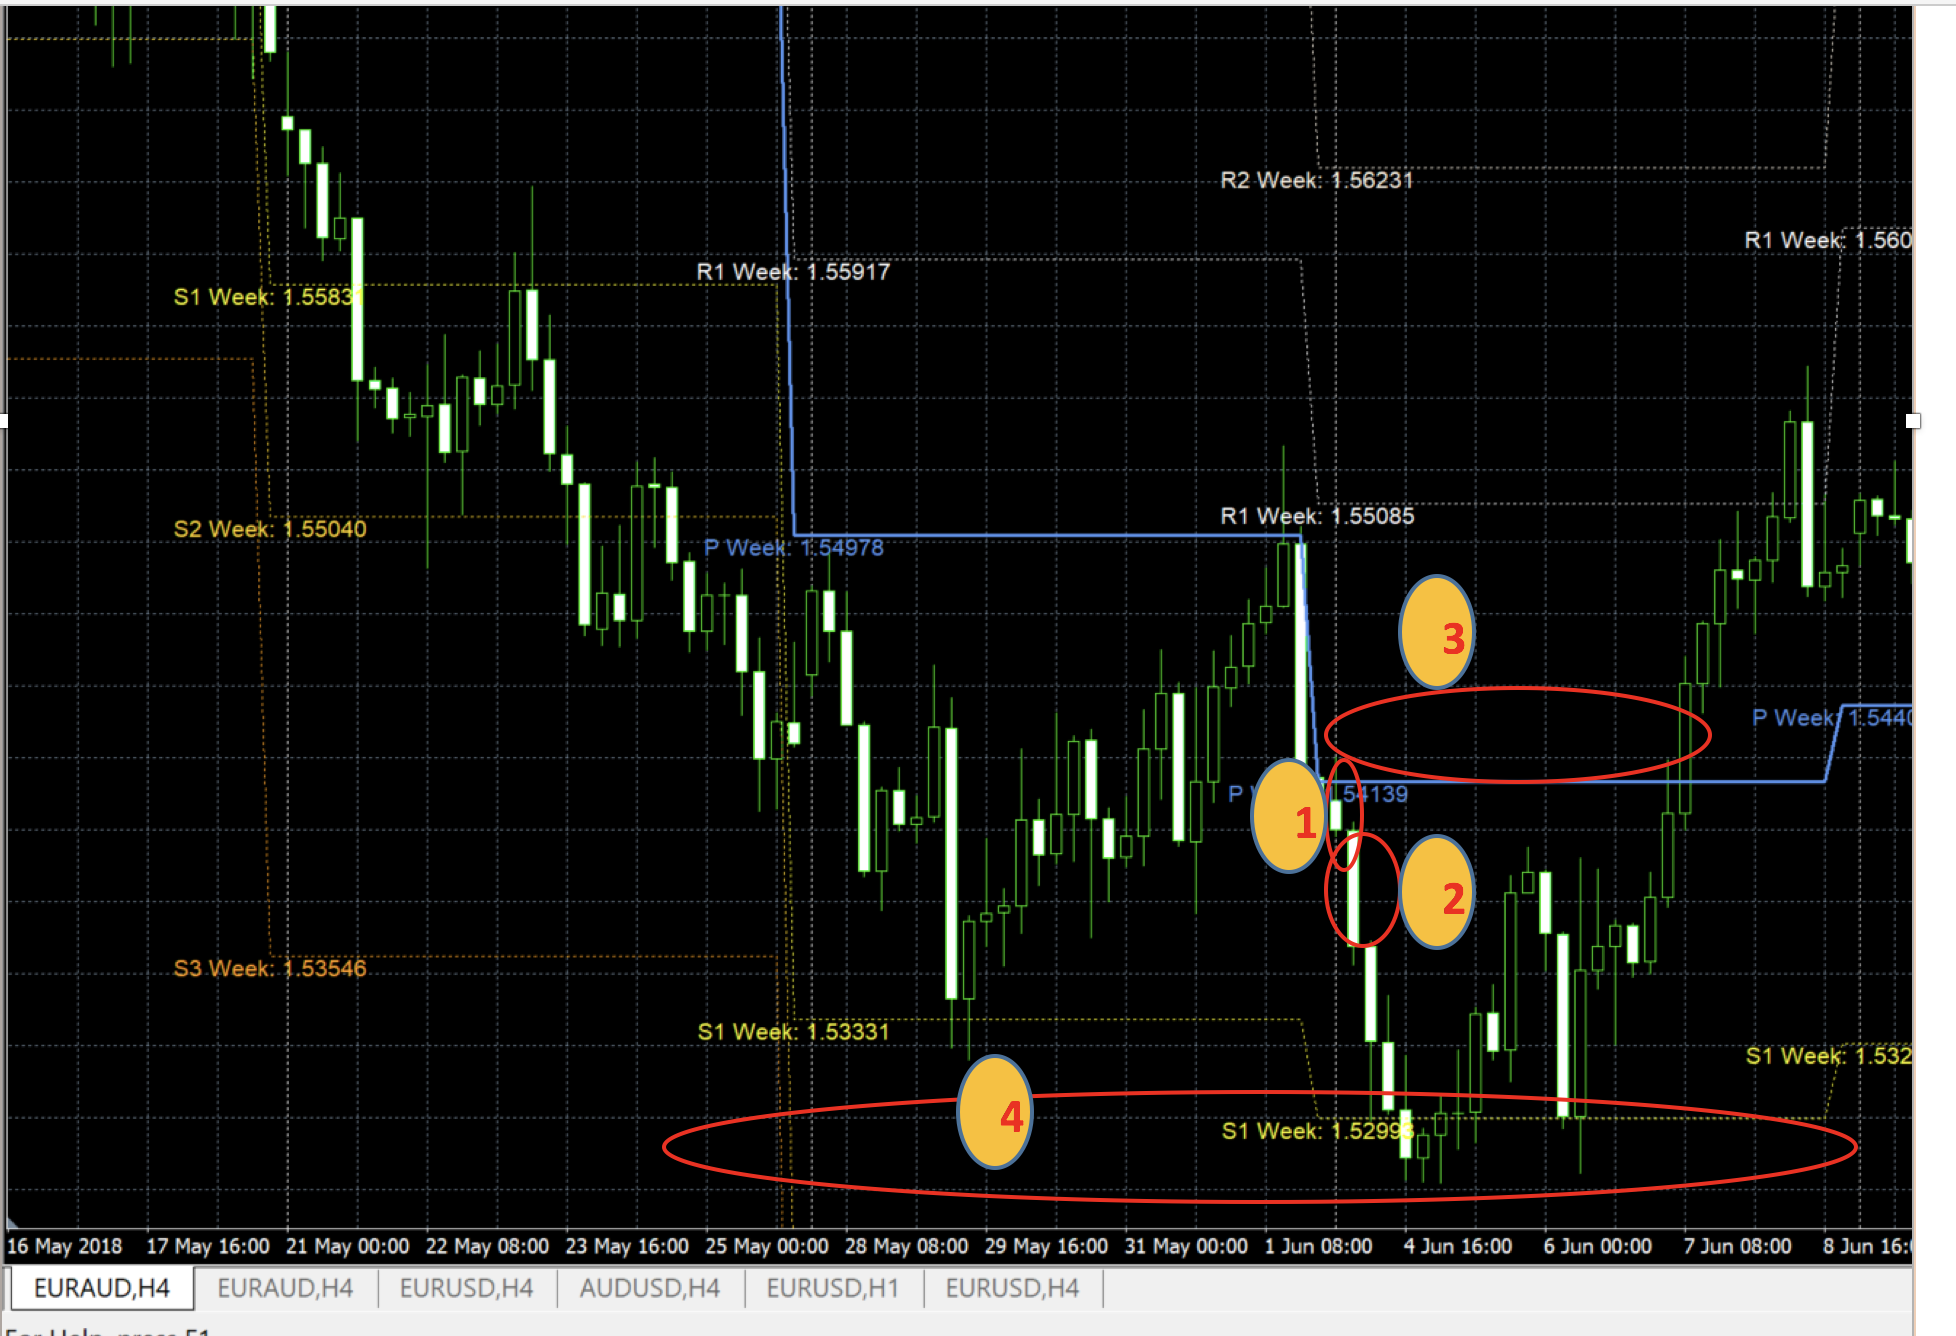
Sell Order Placement:


In order to be a sell order the following conditions must be met:


·            The price must closebelowthe weekly pivot (WP)

·            1 bar must fully closebelowthe weekly pivot (WP)

·            The barmustclose below the opening bar for that week (the very first bar for that week

·            Barmustbe a full/complete buy bar (no indecisive or small bars)


Afterallthe above conditions have been met then the following will apply to the order placed:


·            Lot size of 14.0 will be placed

·            Stop loss for the order will be placed be 20 pips above weekly pivot (WP) for that week

·            Take profit will be placed at support 1 for that week OR the system will look back 5 weeks in the past to look at the “best” place for take profit placement


Order will be closed if the take profit OR the stop loss has been executed for that trade


Example:


1.        This denotes that this is the first opening bar of the week

2.        This denotes that this is the bar that the trade should be entered on. This is a long sell bar that is below the blue line weekly pivot (WP) for that week

3.        This denotes that the stop loss should go below 20 pips above the blue line weekly pivot (WP) for that week

4.        This denotes that the take profit should be placed somewhere in that regionaboveS1 week for that week. The system should be able to look at the current week for the pivot levels that are formed S1, S2 or S3 to see if a take profit will be suitable there OR look back 5 weeks to see if it will be better suited there. For this example, it is better to place the take profit somewhere for that week (where the red oval highlights) S1 for the week of June 4THto June 8th. The System can look back in the past at S3 week for the week of May 21stto May 25thor S1 for May 28thto June 1st. 


응답함

1
개발자 1
등급
(4)
프로젝트
5
20%
중재
3
33% / 33%
기한 초과
0
무료
2
개발자 2
등급
(9)
프로젝트
10
10%
중재
4
25% / 75%
기한 초과
3
30%
무료
3
개발자 3
등급
(461)
프로젝트
902
77%
중재
25
16% / 68%
기한 초과
100
11%
무료
4
개발자 4
등급
(196)
프로젝트
318
35%
중재
64
13% / 56%
기한 초과
82
26%
무료
비슷한 주문
Trading bot 300+ USD
We need bot that trades when medium and low impact news hits It will release pending order both directions few min prior to news impact And will have certain risk management strategy attached Example If Monday and Tuesday news successful clears profits It will reduce risk for next news events until new week starts each week message on tg: Dstatewealthtrading NOTE: 4 YAERS OF EXPERIENCE UPWORD, YOU MUST BE A
I need someone the create a supertrend indicator based on Heikin Ashi candles instead of normal candles. Needs to be exactly the same as the supertrend (original one) + ha from tradingview. In m1,m5,m15 the indicator must have the same values ​​found with the tradingview. Work that meets this requirement will be accepted ( depending on the broker and spread, however, a few pips of difference will be accepted)
Here is a detailed instruction for the coder to implement the vertical lines based on the BrainTrainSignalAlert indicator: --- **Task: Implement Vertical Lines for Alerts from BrainTrainSignalAlert Indicator** **Objective:** Create a system that adds vertical lines on specified timeframes (M5 or M30) whenever an alert is generated by the BrainTrainSignalAlert indicator on the H1, H4, and D1 timeframes. The lines
are you aware of the Monday Range Strategy? https://www.youtube.com/watch?v=7B_yBBFx6z8 5pm EST time sunday - monday 5pm est and it has to be on the H1 chart , minimum 1:2 Risk to reward and break even function after 1:1
Hello, I need someone who have a great experience in ATAS platforms, I use ATAS software for orderflow and i would like tradingview to draw some light information from ATAS to tradingview. If you are capable of this please send me a message and let's proceed
### Summary of EA Requirements 1. **Time Period**: - The EA should operate on the H4 timeframe. 2. **RelicusRoad MACD v2 Indicator**: - **Parameters**: - Fast EMA Period: 12 - Fast EMA Type: Close price - Slow EMA Period: 24 - Slow EMA Type: Close price - Signal SMA Period: 9 - The EA should use this indicator to determine the crossover condition between the MACD line and the signal line. 3
Delete the minutes field the days dirctaly =1440 ( hide for the customer ) . The indicator setting appears with the indicator on the screen in the same color chosen The possibility of more than one indicator appearing on the screen. Good arrangement
An EA that executes when the 21 and 55 SMA Cross on certain time frame also the EA will understand supply and demand levels and executes when price reacts on this levels specified and target/stoploss levels will be predetermined...also the robot will also comprise stochastic oscillator
I need a robot for forex trading~~The way the robot should work is that when I put it into a 5 minute chart, the chart will show 15 minutes, one hour, Regardless of whether they are buying or selling, they must buy or sell in the same color at the same time~~~ Use the following indicators: HalfTrend 1 & alerts mtf Trafficlight indicator.MQ4 When placed into a 5 minute chart ~ the chart will show 15 minutes, one
I am looking for a programmer to do EA trader. If you can understand what I want from the video i do and you can do it, contact me because you will be able to do what I want. https://drive.google.com/file/d/1wbHxbUQQqCkdpr0-pHfIh2b288LzYTV2/view?usp=sharing maximum budget = 150$ Preference is given to someone who: -speaks Arabic so I can explain it clearly to him - And the lowest price

프로젝트 정보

예산
30+ USD
개발자에게
27 USD