고객의 피드백

피고용인의 피드백
My old indicator show red down arrow as sell signal, and show pink up arrow as buy signal.
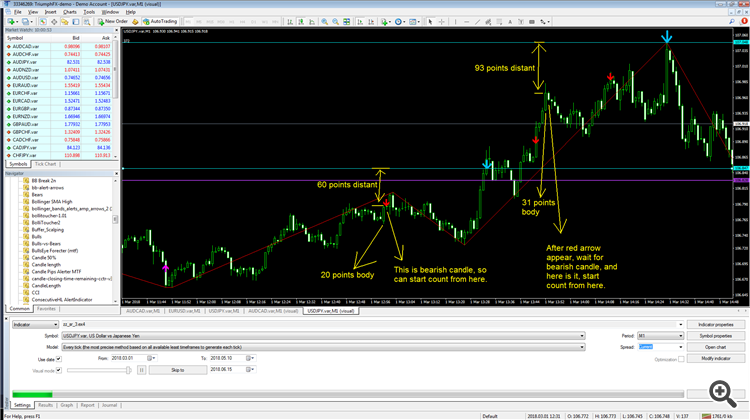
Step 1 : When red arrow appear (price might continue keep going up), wait for bearish candle appear.
Step 2 : Compare body size of the bearish candle and the previous last bullish candle, take the 1 that bigger body size. For example, if bullish body size is 20 points but bearish body size is 15 only, so take 20 points.
Step 3 : body size x 3 times = distant. Example just now take 20 points at step 2, so 20 points x 3 = 60 points distant. Draw a horizontal line at 60 points above the candle body.
Step 4 : when price go up touch the horizontal line, pop up alert "USDJPY Sell". And draw blue down arrow at the horizontal line where the price touch it.
Step 5 : Repeat the 4 steps above in opposite direction for pink arrow.
Picture reference at below (please ignore the purple horizontal line because it is draw by my old indicator)

Hope can complete it in few hours. Let me know how many hours u can complete it. Thanks.
비슷한 주문
Hello Im looking for professional trading developer who htf ready made trading with best and working strategy with low risk level with average of 30 to 60 percent profit margin, broker is not problem, any broker is welcomed and any trading pairs are welcomed as well
Connect from Mt4 via binary derive account api. I have a bot. You need to convert the bot to an indicator. After converting I need to connect with my binary deriv through api. I want to trade my derivative binary account through mt4. If anyone can setup via API then contact me
Moving average cross strategy that has no stop but will just reverse direction each time the crossover happens. But will have a 3 step profit taking method at certain percentage points. It will be used for futures options on the buy side. 3 days out
Reposting: I have posted this add earlier and had worked with Developer initially in trial mode. I was wondering if that developer is still available as I want buy this code from him with some modifications which I need. Hello - I am looking for some thing like this. 1- Moving Average MA value as line on Chart with label. i.e. 5min, 50, Exponential ( Labels should be selectable, Hide / Unhide, or display on Right /
My EA calls recent and live Polygon tick data, stores it locally and then displays it on the chart. I need someone who can modify the EA so that it can use information from TickDataSuite or any other tick repository instead of polygon so it can be used while backtesting. More information about the EA can be given. Price is negotiable if you have a backlog of completed orders and good reviews
I want to add lot Size filter in my MQ5 EA. based on account balance increseing lot size must be increseing and when balance decrese lot size also decresed..that's all i want
I have a mql4 license mql4 code,, there have a 1 error '( WebRequest' - no one of the overloads can be applied to the function call) fix this error,, and make sure it work properly,,{ it's bass on kernel32.dll } this license system Base on pc volume serial number. If you're a expert developer kindly contact with me ,, Write a text " License system devoloper " Telegram @Gw_rakib1
Looking for a skilled freelancer to create a simple indicator that displays key data directly on the chart during a backtest on MetaTrader 4. The indicator should show: - **Balance** - **Profit in $** - **Profit in %** I already have the sample in MT5 (.mq5 file), but I need it converted and optimized for MT4. This is a straightforward task with a quick turnaround time—just 2 hours. I'm offering $250 for this
(Below is a link that shows you how to calculate standard deviation) https://youtu.be/UaaaSx83Exg?si=UJGBkOf-XzvakVwC 1. Scan and sorts the entire watchlist for symbols with the largest current Standard Deviation absolute value (Using OPEN price)(Sorted: Greatest-Least): :: Timeframes :: - Current Day - Current Week - Current Month (:::::::::: DISPLAY ::::::::::) (1nd Row): Daily | Weekly | Monthly (2rd Row)
Bonjours, j’ai un EA avec des dossiers mqh à compiler ensemble pouvez-vous le faire ? les autres dossiers mqh pour ceux qui sont intéréssé Vous pouvez aussi me contacter via whatsapp +33766393794, télégramme « Doxa Man »
