명시
Write an indicator/script that output the following variable:
1. PriceHighBox = #Price_level
2. PriceLowBox = #Price_level
3. PriceBoxDirection = up or down
4. Draw red and blue dots to indicate support and resistance
I'll need the script for this indicator.
User input:
1. Y pips to define peaks and support,
2. X pips for clearance rule
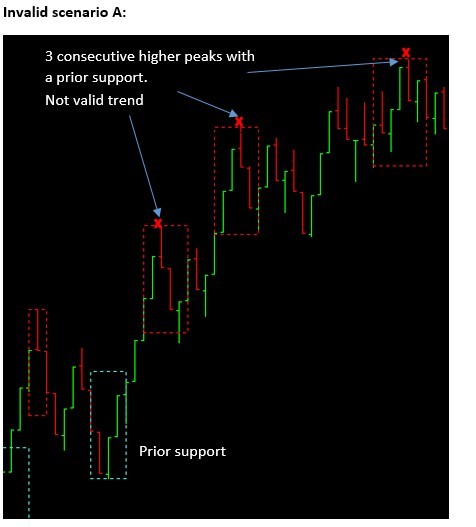
Valid scenario A:
A peak has to rise up and down in price by Y amount of pips (user input). Vice versa for support.
[A: The highest price of 3 peaks (for uptrend; 3 peaks cannot be consecutively higher) with [B: one identified support or resistance] that has a [C: clearance more than X pips]. Draw [D: blue dot (below low)] and [E: red dot (above high)] on chart. (see graphic below)

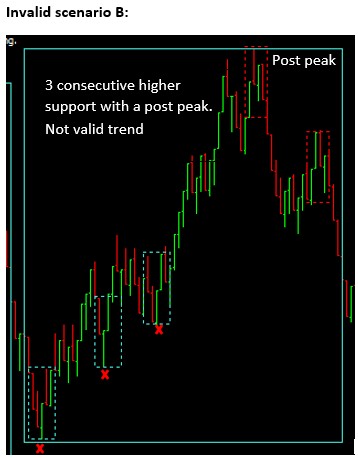
Valid scenario B:
[A: The Lowest price of 3 supports (for downtrend; 3 supports cannot be consecutively lower) with [B: one identified peak] that has a [C: clearance more than X pips]. Draw [D: blue dot (below low)] and [E: red dot (above high)] on chart. (see graphic below)

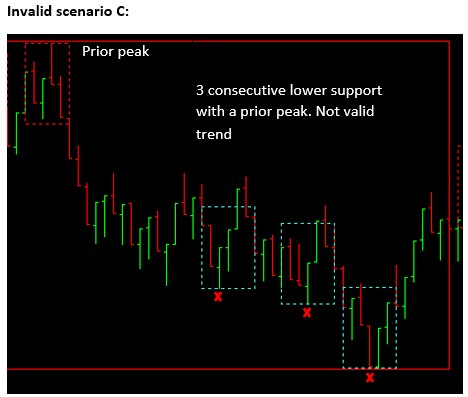
Valid scenario C:
[A: The highest price of 3 peaks (for downtrend; 3 peaks cannot be consecutively lower) with [B: one identified support] that has a [C: clearance more than X pips]. Draw [D: blue dot (below low)] and [E: red dot (above high)] on chart. (see graphic below)

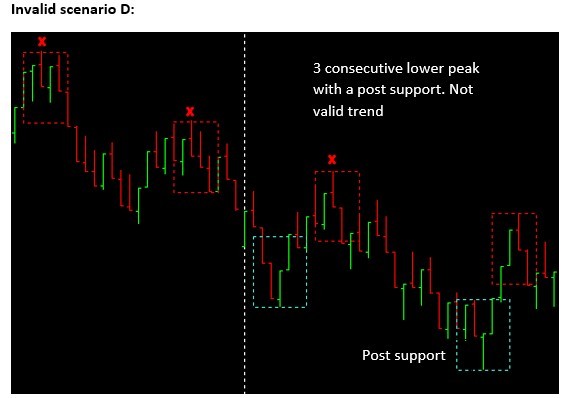
Valid scenario D:
[A: The Lowest price of 3 supports (for uptrend; 3 supports cannot be consecutively higher) with [B: one identified peak] that has a [C: clearance more than X pips]. Draw [D: blue dot (below low)] and [E: red dot (above high)] on chart. (see graphic below)