Convert TV Strategy into a Mt4 or Mt5 EA

MQL5 지표 전문가

작업 종료됨

실행 시간 17 분
피고용인의 피드백
Thank you for the job. Good luck!

명시

Hi, I am looking for a developer to convert a TV strategy into a Mt4 or Mt5 EA. The strategy is based on the EMA and the CVD volume indicator. I dont have the Mt4 or Mt5 version of these indicators. Copy the code below and place it in your TV to see the strategy. Other features:

Stop loss - Option to either use pips of my choosing or close on opposite signal appears. 

Take profit -  Option to either use pips of my choosing or close on opposite signal appears. 

EMA Filter - Must have the option to turn off and on and choose the EMA length 

Time Filter 

Trailing Stop - Can be based on pips or any other idea you may have 

Recovery - Martingale - Allow me to choose the lot size it will increase by. It will only kick in if the previous entry or entries close in a loss. It must stop or reset 

Add to winning trade - For example, a buy trade is taken and its in profit, sometimes price pulls back with 2 or more red candles, after this, a green candle must engulf any of the red candles. Once this happens additional buy entries must be taken. Allow me to choose the lot size. 

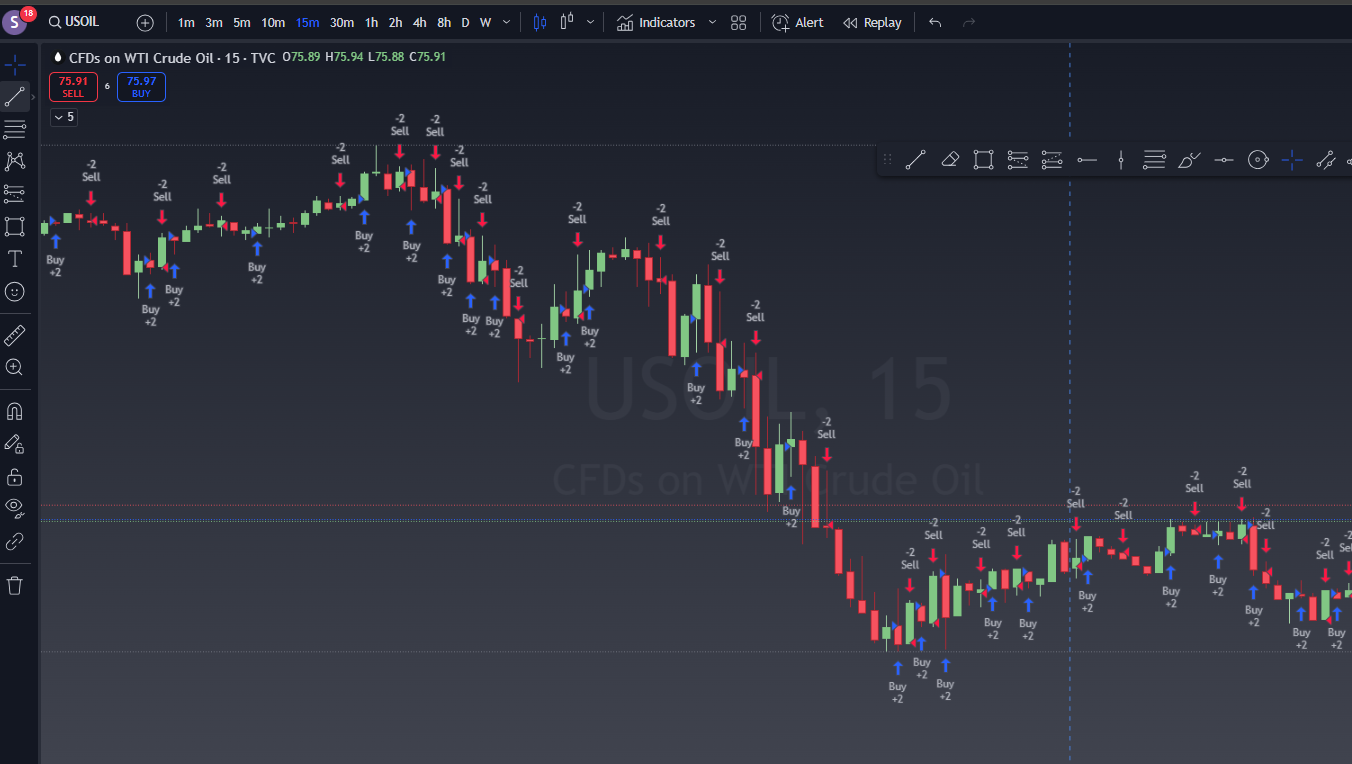
How It Takes Buy and Sell Entries:

  • Buy Entry Example:

    1. The price candle closes higher than it opened (green candle).
    2. The CVD indicator shows positive net buying (teal candle).
    3. The price is above the EMA, indicating an uptrend.
    4. The price has not crossed above the EMA more than once, and fewer than two buy signals have been generated since the last EMA crossover.
    5. All conditions are met, so the strategy enters a long position.
  • Sell Entry Example:

    1. The price candle closes lower than it opened (red candle).
    2. The CVD indicator shows negative net selling (red candle).
    3. The price is below the EMA, indicating a downtrend.
    4. The price has not crossed below the EMA more than once, and fewer than two sell signals have been generated since the last EMA crossover.
    5. All conditions are met, so the strategy enters a short position.

Summary:

This strategy combines the Cumulative Volume Delta, price action, and an EMA filter to identify trading opportunities aligned with the prevailing trend. The entry limit logic helps avoid overtrading by restricting the number of entries after an EMA crossover, while the option to enable or disable the EMA filter provides flexibility in strategy application. This approach aims to capitalize on strong, confirmed market movements while minimizing false signals.


//@version=5
strategy("CVD with Price Action and EMA Filter", overlay=true)

// Inputs
anchorInput = input.timeframe("1D", "Anchor period")
useCustomTimeframeInput = input.bool(false, "Use custom timeframe")
lowerTimeframeInput = input.timeframe("1", "Timeframe")

// EMA Filter Inputs
useEMAFilter = input.bool(true, "Use EMA Filter")
emaLength = input.int(50, "EMA Length")
emaSource = input.source(close, "EMA Source")

// Function to calculate up and down volume
upAndDownVolume() =>
    posVol = 0.0
    negVol = 0.0
   
    var isBuyVolume = true    

    switch
        close > open     => isBuyVolume := true
        close < open     => isBuyVolume := false
        close > close[1] => isBuyVolume := true
        close < close[1] => isBuyVolume := false

    if isBuyVolume
        posVol += volume
    else
        negVol -= volume

    posVol + negVol

// Determine lower timeframe
var lowerTimeframe = switch
    useCustomTimeframeInput => lowerTimeframeInput
    timeframe.isseconds     => "1S"
    timeframe.isintraday    => "1"
    timeframe.isdaily       => "5"
    => "60"

// Get volume delta for lower timeframe
diffVolArray = request.security_lower_tf(syminfo.tickerid, lowerTimeframe, upAndDownVolume())

// Calculate CVD
getHighLow(arr) =>
    float cumVolume = na
    float maxVolume = na
    float minVolume = na

    for item in arr
        cumVolume := nz(cumVolume) + item
        maxVolume := math.max(nz(maxVolume), cumVolume)
        minVolume := math.min(nz(minVolume), cumVolume)

    [maxVolume, minVolume, cumVolume]

[maxVolume, minVolume, lastVolume] = getHighLow(diffVolArray)

var cumulLastVolume = 0.0
anchorChange = timeframe.change(anchorInput) or (not na(lastVolume) and na(lastVolume[1]))
cumulOpenVolume = anchorChange ? 0.0 : cumulLastVolume[1]
cumulMaxVolume = cumulOpenVolume + maxVolume
cumulMinVolume = cumulOpenVolume + minVolume
cumulLastVolume := cumulOpenVolume + lastVolume

// Determine CVD color
cvdColor = cumulLastVolume >= cumulOpenVolume ? color.teal : color.red

// Plot CVD as candle
hline(0)
plotcandle(cumulOpenVolume, cumulMaxVolume, cumulMinVolume, cumulLastVolume, "CVD", color = cvdColor, bordercolor = cvdColor, wickcolor = cvdColor)

// EMA Calculation
ema = ta.ema(emaSource, emaLength)

// Entry limit logic
var int buyEntryCount = 0
var int sellEntryCount = 0

// Detect EMA cross
emaCrossedUp = ta.crossover(close, ema)
emaCrossedDown = ta.crossunder(close, ema)

if emaCrossedUp or emaCrossedDown
    buyEntryCount := 0
    sellEntryCount := 0

// Trading logic with EMA filter
priceGreen = close > open
priceRed = close < open
cvdGreen = cvdColor == color.teal
cvdRed = cvdColor == color.red

buySignal = priceGreen and cvdGreen
sellSignal = priceRed and cvdRed

if useEMAFilter
    buySignal := buySignal and close > ema and buyEntryCount < 2
    sellSignal := sellSignal and close < ema and sellEntryCount < 2

// Increment entry counts and place trades
if buySignal
    buyEntryCount := buyEntryCount + 1
    strategy.entry("Buy", strategy.long)
if sellSignal
    sellEntryCount := sellEntryCount + 1
    strategy.entry("Sell", strategy.short)

// Plot Buy and Sell signals
plotshape(series=buySignal, title="Buy Signal", location=location.belowbar, color=color.green, style=shape.labelup, text="Buy")
plotshape(series=sellSignal, title="Sell Signal", location=location.abovebar, color=color.red, style=shape.labeldown, text="Sell")

// Plot EMA line
plot(useEMAFilter ? ema : na, title="EMA", color=color.blue, linewidth=2)


파일:

응답함

1
개발자 1
등급
(2)
프로젝트
5
0%
중재
3
0% / 100%
기한 초과
1
20%
작업중
2
개발자 2
등급
(102)
프로젝트
105
60%
중재
0
기한 초과
0
무료
3
개발자 3
등급
(30)
프로젝트
38
29%
중재
1
0% / 100%
기한 초과
2
5%
작업중
4
개발자 4
등급
(77)
프로젝트
243
74%
중재
7
100% / 0%
기한 초과
1
0%
무료
게재됨: 1 기고글
5
개발자 5
등급
(87)
프로젝트
121
68%
중재
5
80% / 0%
기한 초과
12
10%
작업중
6
개발자 6
등급
(1)
프로젝트
0
0%
중재
0
기한 초과
0
무료
비슷한 주문
Im after a person to copy, exactly MACD in TRADINGVIEW to use on MT5. Ive tryed alot of the apps available...Tradingview works for me. Im also after a person to make a real time chart, overlayed on the delayed chart Thanks
need a dots marking of a simple rules pullback indicator. in the .tpl file look at 28 Jan 2026, TF M5 basically it is just overlaping lows or highs of the previous candle price. there are 2 scenario to accomodate: 1. simple pullbacks 2. pullbacks with inside bar and outside bar involved
buy condition when blue color appears sell condition when yellow color appears close all buys when there is a sell order close all sells when there is a buy order
I would like to build a very very low budget bot and test run it to see if it would be profitable on the long run or if it will just be a waste of money and resources It is python 70% of the engine logic codes needed are already existing on githubs and python traders community So you are not building from scratch at all So kindly go through it Thank you
Società di investimento con attività tra Sanremo e Monaco ricerca un giovane collaboratore con esperienza nell’utilizzo avanzato di MetaTrader 5. Si richiede la conoscenza della lingua italiana e inglese. Attività Il collaboratore si occuperà di: • eseguire backtest di strategie di trading su MT5 • effettuare ottimizzazioni parametri tramite Strategy Tester • analizzare risultati e robustezza delle strategie •
I am looking for an experienced MT5 developer to build a custom, aggressive XAUUSD scalping EA with structured basket management and momentum continuation logic. This is not a generic EA — it requires careful architecture and proper risk control. Key Requirements: Instrument & Timeframes: XAUUSD only M1 execution chart M5/M15 for directional bias and structure context Execution & Basket Logic: Aggressive basket-style
​1. Project Overview ​ Asset: XAUUSD (Gold) ​ Timeframe: M1 (1-Minute) for execution; M5/M15 for trend filtering. ​ Objective: Execute high-frequency scalps during peak liquidity (London/NY overlap) to capture 10–30 pip movements with high precision. ​ Core Logic: The "Poverty Bot" strategy relies on Mean Reversion combined with Momentum Burst (Price Action + RSI/EMA filters). ​2. Strategy Logic (The "Poverty"
Simple MA indicator with buy and sell arrow with a push notification. Conditions for buy or sell should be when price breaks above or below the MA and then retraced back to the MA creating a HH/HL or LH/LL then the buy/sell signal arrow should be at the reversal candle that forms the HL/HH. And on indicator window1 RSI cross over MA and the RSI line
Hi, I hope you doing Greate, Let me share details , so the original EA already working but you can check and verify everything fine.First you verify that all original EA features are working correctly then add a user dashboard showing the number of detected zones, buy sell both none status, and an on off button. also ensure mitigated zones disappear properly and that trades follow the zone rules, and integrate the
I need to calculate the following from existing MT4 and MT5 account trading history: Maximum floating loss Maximum floating profit By “floating loss / floating profit,” I mean the largest unrealized loss and unrealized profit that occurred at any moment while positions were still open, not the final closed P/L. My requirements are: The calculation should be based on historical trading records It should ideally

프로젝트 정보

예산
40+ USD
기한
에서 2 일