작업 종료됨
실행 시간 22 시간
명시
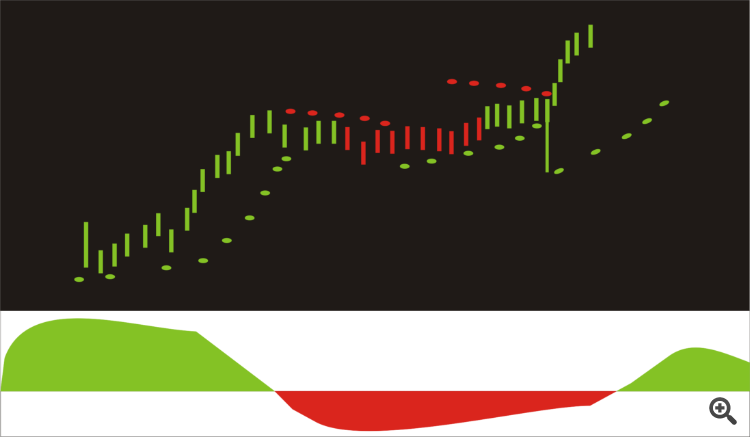
Write a simple programme that will do the job specification whenever Parabolic SAR Indicator and MACD Indicator move up and down at the chart.
Parabolic SAR Indicator:
In the above diagram all-the-up parabolic SAR is lime color and all-the-down parabolic SAR is red color.
1. Use default Parabolic SAR settings
2. Allow user to adjust settings
MACD Indicator:
In the above diagram MACD and bar up, bar down, bull up, bear down candlestick at the chart are lime colors whenever MACD crosses below -0.00 and then MACD and bar up, bar down, bull up, bear down candlestick at the chart are red color whenever MACD crosses above +0.00.
Note:
1. Use fast ema 12, slow ema 50, macd sma 1 as default.
2. Allow user to adjust settings
응답함
1
등급
프로젝트
114
37%
중재
8
88%
/
0%
기한 초과
0
작업중
2
등급
프로젝트
100
30%
중재
1
100%
/
0%
기한 초과
2
2%
작업중
3
등급
프로젝트
3
0%
중재
0
기한 초과
0
작업중
4
등급
프로젝트
1444
45%
중재
49
73%
/
12%
기한 초과
36
2%
무료
5
등급
프로젝트
4
0%
중재
0
기한 초과
1
25%
작업중
6
등급
프로젝트
79
9%
중재
34
9%
/
56%
기한 초과
6
8%
로드됨
7
등급
프로젝트
424
34%
중재
54
37%
/
39%
기한 초과
155
37%
작업중
8
등급
프로젝트
1430
62%
중재
21
57%
/
10%
기한 초과
43
3%
무료
9
등급
프로젝트
28
11%
중재
6
33%
/
50%
기한 초과
4
14%
로드됨
10
등급
프로젝트
76
25%
중재
9
33%
/
56%
기한 초과
8
11%
작업중
11
등급
프로젝트
373
21%
중재
43
60%
/
23%
기한 초과
44
12%
바쁜
12
등급
프로젝트
181
72%
중재
4
100%
/
0%
기한 초과
1
1%
무료
13
등급
프로젝트
548
32%
중재
24
67%
/
8%
기한 초과
16
3%
작업중
14
등급
프로젝트
107
24%
중재
8
38%
/
25%
기한 초과
8
7%
작업중
15
등급
프로젝트
180
46%
중재
0
기한 초과
5
3%
무료
16
등급
프로젝트
1
0%
중재
1
0%
/
0%
기한 초과
0
작업중
17
등급
프로젝트
1331
59%
중재
28
82%
/
0%
기한 초과
10
1%
무료
18
등급
프로젝트
539
50%
중재
55
40%
/
36%
기한 초과
224
42%
작업중
비슷한 주문
Sell_Moment
30 - 40 USD
Hi, the quest is to prepare both alert (email or telegram etc.. ) and EA based on the same. ONLY Sell option for automated trade is in query. Simple cross of two indicators (ATR&RSI on single chart) would give an alert (optional) with the possibility of auto-trade (selectable option) : (as attached) furthermore - customized parameters like settings (period) of both indicators, comment - recognition of the EA
בס"ד A separate window indicator that calculates a value for each bar from all history ticks for the bar. This value will be shown in the indicator by MA methods. I need the source code
1. (price 80) I have an equity reporter. This equity reporter displays the maximum and minimum equity reached over a specific interval. So, if the interval is set to 24 hours, the script will generate data in the format: "Profit ATT" (profit AtThatTime) shows max./min. during the specific interval This specific report shows data in pips. It can also be set to display in price or percentages. The interval is also
i have a specific mql5 indicator but its not compatible with mt2trading auto connector...can edit my source cod and make my indicator compatible with mt2tradin platform so that its signals can be detected by it
i have a specific mql5 indicator but its not compatible with mt2trading auto connector...can edit my source cod and make my indicator compatible with mt2tradin platform so that its signals can be detected by it
I have a s canner I want to add 2 features to Feature 1 I want to make the buttons clickable so when you click them the mt4 terminal the scanner is on goes to that instrument on that chart Feature 2 I want to change the buttons on the scanner to have buy and sell Im looking for this to be a quick job and to have this done asap if you can do this please apply thank you in advance
Make indicator lighter/faster
30+ USD
Hi, I need to improve the code of an indicator that is too heavy when used with iCustom inside another indicator or EA, in order to make it run faster as possible. I'll provide indicator after job acceptance. I request final source code mql5 file. Thank you Regards
This Indicator is for the 15minutes timeframe but it should be able to work on higher timeframes and with any currency pairs. I want an indicator that draws two horizontal lines - One from the Highest High, the other from the Lowest Low. The lines start from the start of a new Trading day and ends at 04:00 am. So the indicator draws the line from the highest high between time 0 and 4am AND the line from the lowest
Hello I would like to replicate ThinkTrader desktop version indicators to be used in MT4 . The indicators are 1) Trendrisk Trend and 2) Supertrend. These indicators will paint the candlestick of the chart. thanks
I nees an expert advisor
100+ USD
The idea of the trading system is as follows : market entries are performed when MACD's main and signal lines intersect in the current trend direction . 2. Trend is determined based on the Exponential Moving Average with the specified period (InpMATrendPeriod). If the current EMA value is greater than the previous one, the trend is seen as growing (ema_current > ema_previous). Alternatively, if current EMA is
프로젝트 정보
예산
30+ USD
개발자에게
27
USD
기한
에서 1 로 5 일
