작업 종료됨
명시
Hi
Please convert the oscillator from tradingview to the mt5 strategy.
The strategy is to open a long position when the Red Oscillator line crosses the lower band from the bottom up (above the value of 0) and close the position when the red oscillator line crosses the upper band from the top down (below the value of 1) and when closing the long position it is to open the position short, i.e. when the red oscillator line crosses the upper band from the top down (below the value 1) and close the short position when the red oscillator line crosses the lower band from the bottom up (above the value 0) (conditions opposite to opening a long position)
The position is to be opened after the candle closes.
If at a given moment we have an open position, e.g. a short position, and the conditions for opening a short position are met again, we do not open the position again but wait for the conditions to close the position to be met (only one position can be open at a given time), this can be seen in the photo where the conditions occurred again to open a short position, but we do not add to the already open position, we wait for it to be closed.
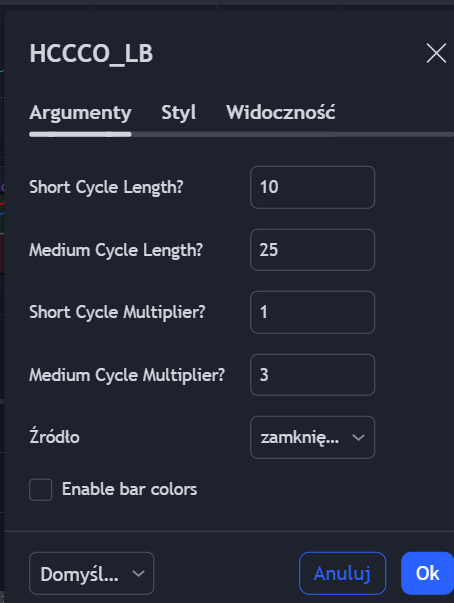
This is oscillator from tradingview Cycle Channel Oscillator [LazyBear]
//
// @author LazyBear
// List of my public indicators: http://bit.ly/1LQaPK8
// List of my app-store indicators:
//
study("Hurst Cycle Channel Clone Oscillator [LazyBear]", shorttitle="HCCCO_LB", overlay=false)
scl_t =  input(10, title="Short Cycle Length?")
mcl_t =  input(30, title="Medium Cycle Length?")
scm =  input(1.0, title="Short Cycle Multiplier?")
mcm =  input(3.0, title="Medium Cycle Multiplier?")
src=input(close, title="Source")
scl = scl_t/2, mcl = mcl_t/2
ma_scl=rma(src,scl)
ma_mcl=rma(src,mcl)
scm_off = scm*atr(scl)
mcm_off = mcm*atr(mcl)
scl_2=scl/2, mcl_2=mcl/2
sct =  nz(ma_scl[scl_2], src)+ scm_off
scb =  nz(ma_scl[scl_2], src)- scm_off
mct =  nz(ma_mcl[mcl_2], src)+ mcm_off
mcb =  nz(ma_mcl[mcl_2], src)- mcm_off
scmm=avg(sct,scb)
ul=plot(1.0, title="UpperLine", color=gray), ml=plot(0.5, title="MidLine", color=gray), ll=plot(0.0, title="LowerLine", color=gray)
fill(ll,ml,color=red), fill(ul,ml,color=green)
omed=(scmm-mcb)/(mct-mcb)
oshort=(src-mcb)/(mct-mcb)
plot(omed>=1.0?omed:na, histbase=1.0, style=histogram, color=purple, linewidth=2, title="MediumCycleOB")
plot(omed<=0.0?omed:na, histbase=0.0, style=histogram, color=purple, linewidth=2, title="MediumCycleOS")
plot(oshort>=1.0?oshort:na, histbase=1.0, style=histogram, color=purple, linewidth=2, title="ShortCycleOB")
plot(oshort<=0.0?oshort:na, histbase=0.0, style=histogram, color=purple, linewidth=2, title="ShortCycleOS")
plot(oshort, color=red, linewidth=2, title="FastOsc")
plot(omed, color=green, linewidth=2, title="SlowOsc")
ebc=input(false, title="Enable bar colors")
bc=(oshort>0.5)?(oshort>1.0?purple:(oshort>omed?lime:green)):(oshort<0?purple:(oshort<omed?red:orange))
barcolor(ebc?bc:na)
Strategy Photo:
