트레이딩 로봇 주문 방법을 보십시오
주문을 실행하거나 포스트하기 전에 규칙을 읽으십시오
MQL5 및 MQL 4의 트레이딩 로봇을 주문하는 방법
로봇을 주문하기 위해샘플 요구 사항을 보십시오
카테고리의 새로운 주문:
30 - 200 USD
30 - 40 USD
30+ USD
30 - 50 USD
30+ USD
200 - 250 USD
명시
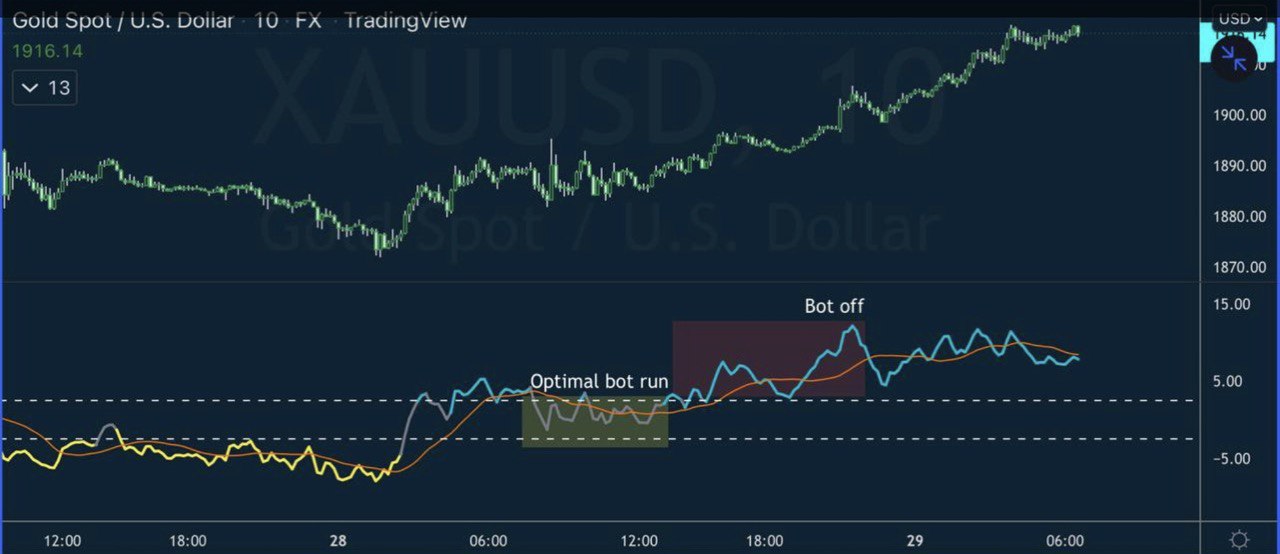
Need to create an indicator for Tradingview based on this original indicator. It's intended to measure the trend. It oscillates around a centerline of "0" and it moves very similar to an RSI indicator. The top HLINE is 2.5 and the bottom HLINE is -2.5. When the oscillator goes above the top HLINE, it becomes blue signaling a bullish market. When it goes below the HLINE it turns red , signaling a bearish market.
응답함
1
등급
프로젝트
0
0%
중재
0
기한 초과
0
무료
비슷한 주문
hello there I need a copy trade for mt4 can ANYONE help me with and let discuss on how to go about it kindly send me message to signify and let discuss mind you i need this urgently let connect to discuss and conclude
Hello there, am in need of an expert pinescript programmer who can work on an existing code to add some indicators and features. Please bid if you understand pinescript well and can work on existing code
TIME FRAME: 15 MIN LOT SIZE: 0.01 CANDLE START TIME: 2:00 CANDLE END TIME: 2:14 ENTRY BUFFER: 1 SL BUFFER: 1 TARGET $: 10 MARTINGALE % : 200 (All the above data should be adjustable) Details: 1. We have to mention candle start time and end time (ie: 4.00 to 4.59). If the candle breaks the high of the given time it should go for buy. If it breaks the low of the given time it should go for sell. 2
Create trading chat room with custom sessions.
30 - 90 USD
I need help with creating a website traders chatroom, it must show traders online,offline,inactive. the chatroom top section must show four clocks with different times and time scale like this.. the chatroom must have a history data of up to 10days, then longer history must be deleted automatically. if you have better chatroom please say your recommendations
Lucy spontenious trade
50+ USD
dreams good and have a great Cash out from your smart phone , tuyoywuiy glamorous flood see full idk idk slow so dolls stupid sis workouts who's spark koalas oral waits also doggo idk
It is using EMA/SMA for triggers of long or short (green long/red short) and the line above or below is the stop loss, profit triggers would need to figure out or allow it until next trigger. Already in thinkscript And add parameters
A “grid” display style like the attached image. User can choose up to 3 EMA’s to monitor on up to 6 Time Frames. If the EMA slope is greater than 0 = Green If the EMA slope is less than 0 = Red If the EMA slope is 0 = Black The grid should be customizable on it’s size, colors, and placement on the chart. Each EMA should update per tick. A label at the top of the grid should read “SLOPES” Indicator 2: A “grid” display
Convert Pivot mq4 to Sierra Chart
50 - 100 USD
Requirement: 1. Convert Pivot source code .mq4 to Sierra Chart mq4 source code is provided .mq4 as attached .mq4 2. upon conversion to add a button code on Sierra chart .cpp to allow display/hide the pivot line in Sierra Chart ---- *no need alert, make it light without any alert, just a button to display/hide pivot line will do :) to continue, pivot font text also no need I"ve mark with red cross to remove see
I have 2 (indicators) I coded and I use on Tradingview I just need converted to use on Ninjatrader i will be looking for great developer to bid for it and for more details
Ready-Made Server for Forex Data Manipulation
30 - 200 USD
Hello, I'm seeking a freelancer with access to a ready-made server solution for an educational forex project. Requirements: Ability to control or manipulate live or historical trading data. Platform to execute simulated trades with exaggerated outcomes. Tools for real-time trade simulation (white-label or virtual dealer solutions). If you have a suitable server or can help me find one, please reach out with details
프로젝트 정보
예산
30+ USD
개발자에게
27
USD
기한
로 1 일