
고객의 피드백
피고용인의 피드백
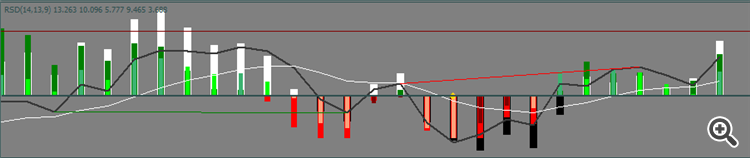
I want to check momentum deviation of RSD and Histogram, using data that we already have within the framework. I looked around the internet found one indicator with the same name( Free download of the 'Momentum deviation' indicator by 'mladen' for MetaTrader 4 in the MQL5 Code Base, 2021.12.12). but i don't want to use momentum of price/price itself. but the momentum of the indicator, so this will be a custom momentum, I was also looking at this explanation, they use RSI as an example to measure momentum( Trading Divergence and Understanding Momentum (investopedia.com)) another example which include velocity, which we just completed as histograms, inside the environment( Relation Between Kinetic Energy And Momentum - Derivation, Graph (byjus.com)) Maybe "RSD & RSD_Histogram" can act as mass, and new histograms(completed project) act as velocity, then apply mathematical equation to find this momentum and plot results as moving average within the environment. I don't know, it seems that we have all details, they just need smoothing, and planning..
According to byjus.com
If "byjus" is right about momentum application, we are close. But how about deviation, is it look back allowance of trend agreement..? I don't know..! What does that code of momentum deviation tells us about deviation prospects..?
this is all data we will use, for this application..
Only developers who checked details can apply, see you in the chatroom, for more info..
비슷한 주문
I need a chart to replicate/track my equity + Balance Curve into my mt4. Also this chart i need to be able to add Stochastic / Bollingerband / Moving average on the equity/balance curve. Besides the equity curve i would like the indicator to show the Line-chart of my win + 1 and my loss -1 which results in a win-loss curve. ( i will discuss this with the choosen developer in depth. ) More information on what i want
I want to export the live feed from my market watch to my technical analysis software. They have provided me an api also. Is there a way that their api can be integrated and take rates from my mt5 client terminal
Starting from scratch, I need a solution to develop my own crypto trading and exchange platform. This platform should compare prices across various exchanges like Coinbase, Binance, KuCoin, and Unocoin, as well as different cryptocurrencies. The solution must identify opportunities to buy on one platform and sell on another for a profit, transferring funds to my personal wallet instantly for security. The bot should
I need a AI signal generating and executing bot for forex trading. The bot should operate such that when i put it in a chart it will analyze the market, after several minutes it will display whether the trade is buying or selling and then execute a trade. It should display the one minute, five minute,15minute, 30 minute, one hour, 4 hours and daily time frame whether they are buying or selling. If it is buying the
looking for help to get my ibkr automated, i have strategies already built in composer and have JSON for them, i really just need to he setup and explanation on how to maintain it and add new strategies
I need a AI signal generating bot for forex trading. The bot should operate such that when i put it in a chart it will analyse the market, after several minutes it will display whether the trade is buying or selling. It should display the one minute, five minute,15minute, 30 minute, one hour, 4 hours and daily time frame whether they are buying or selling. If it is buying the arrow should be green and if it is
Using Bollinger Band only. When price closes above upper BB, open Buy. If the length of the candle body that closed above the upper BB is more than Y pips, then do not Buy and remove the EA. Otherwise, continue to open Buy if crosses and close above upper BB and the number of positions is not more than Max No of Positions. The user will choose either Buy or Sell only. When price closes below the lower BB, close all
The expert Advisor will place trades during high-impact news releases. it will then close trades by trailing stop methods after reaching the breakeven points. It should be built in such a way that it will allow adjustments of parameters like opening distance points, initial stop loss, breakeven points etc
Hello freelancers here, I need an expert to help me with coding my script which is already working in pinescript, Moreover, i want a system whereby i can sell my trading bot and can give access with a license, I need an expert that can help me with this
I need an EA which only trades the news data. The EA has to analyze the news-data and needs to classify them into categories. The Strategy includes the following points and this features needs to be included : 1. Filter for news Data : Pairs : USD ● EUR ● AUD ● GBP News Events : GDP Unemployment rate (initial claims) CB Consumer Confidence (US) Retail sales Consumer Price Index (CPI) Purchasing Managers' Index (PMI)
