
고객의 피드백
피고용인의 피드백
Hi, this is hopefully the first step of a greater project.
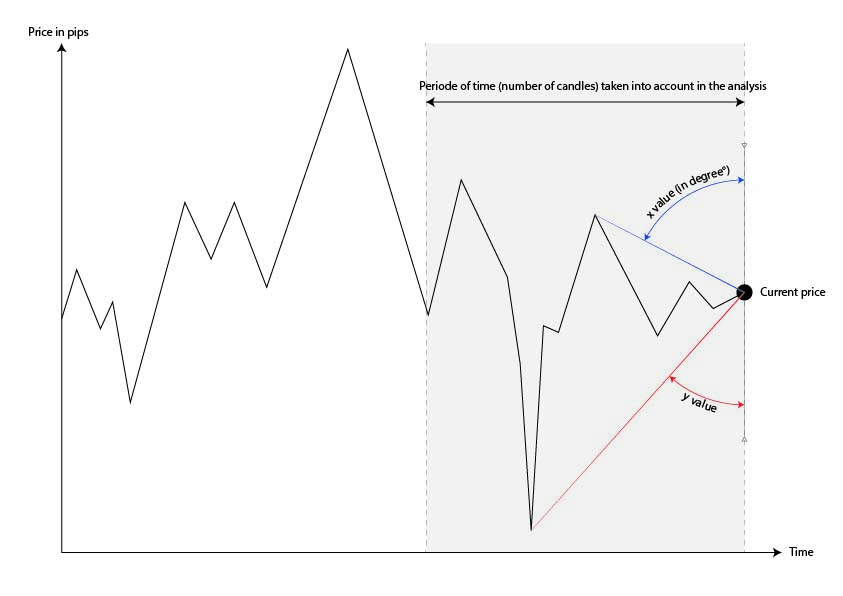
The main idea of this new indicator is that, for any given period of time (or number of candles), the indicator draws two lines :
-One line between current price and highest price in that period, so that all the prices are below that line.
-Another line between current price and lowest price in that period, so that all the prices are above that line.
Thus, the two lines are the two tangents so that all the prices are between those two lines.
Please see the attached draft for further understanding, in this example for the blue line, the line isn't between the current price and the highest price, but between the current price and the price so that the angle with the current price vertical (x value in degree) is the lowest.
The algorithm takes all the candles in the given time period and compares them one by one with current price. The indicator then draws the two lines and
diplays on pannel the two values x and y. It repeats the same operation as long as the current price is changing. So for each new candle we have two new values of x and y and so on. x and y would be the numeral basis for signals in next step.
For this analysis to take place, it's up to you to find the best technical solution.*
*What I've found on my side is that we can use trigonometry : Let's give for each candle 1 unit value, and for each pip 1 unit value. Let's say the price we want to analyse is 50 candles away from current price and 20 pips higher. So we have the two sides of a perpendicular triangle between horizontal current price and price of candle 50. Opposite value is 20, adjacent value is 50. So tangent value is opposite/adjacent or 20/50 = 0.4. With arctan we can deduce the angle with horizontal is 22° And then we can have x value = 90-22= 69°. If you find another solution as long as it respects the main idea above no problem.
It should be possible to change the time period (or number of candles) in the indicator parameters. But the indicator should work on any chart you want to attach on it.
The development of the project in next step looks toward a multitimeframe analysis in order to make a weighted average of x and y in a multimeframe scale.
The collaboration is completed once the indicator works close to expected behavior and the code is delivered.
비슷한 주문
preciso de um robô com duas médias móveis, uma exponencial high e uma exponencial low. preciso também ter a opção de utilizar e todos os tempos gráficos e alterar os parâmetros das médias. entrada de compra será feita quando um candle de alta romper e fechar a cima da média high e fechará a posição quando um candle de baixa romper e fechar a baixo da média low. a venda será feita quando o candle de baixa romper e
Greetings, As the title suggests, I am trying to convert an indicator that calls itself via an iCustom call like this. iMAArray_Buffer[loop_1] = iCustom ( NULL , Selected_TF, MQLInfoString ( MQL_PROGRAM_NAME ), "calculate" , RPeriod, MType, MPeriod, 1 , shift); Full code will not be provided, only the position that needs fixing. I cannot get this working in MQL5 but the original code runs smoothly in MQL4. Please
I need a chart to replicate/track my equity + Balance Curve into my mt4. Also this chart i need to be able to add Stochastic / Bollingerband / Moving average on the equity/balance curve. Besides the equity curve i would like the indicator to show the Line-chart of my win + 1 and my loss -1 which results in a win-loss curve. ( i will discuss this with the choosen developer in depth. ) More information on what i want
Greetings great developer, I am in search of a highly skilled developer to assist with an exciting project. I need to convert two open-source TradingView indicators to NinjaTrader 8 and implement a usage restriction based on computer IDs. If you have experience with NinjaTrader 8 coding please let me know. I’d be happy to discuss the details further
Hello, This is pretty simple and its an indicator with On/Off button 1-Off will remove all indicator from the chart. 2-On will put them all back again with the same settings
We need bot that trades when medium and low impact news hits It will release pending order both directions few min prior to news impact And will have certain risk management strategy attached Example If Monday and Tuesday news successful clears profits It will reduce risk for next news events until new week starts each week message on tg: Dstatewealthtrading NOTE: 4 YAERS OF EXPERIENCE UPWORD, YOU MUST BE A
I need someone the create a supertrend indicator based on Heikin Ashi candles instead of normal candles. Needs to be exactly the same as the supertrend (original one) + ha from tradingview. In m1,m5,m15 the indicator must have the same values found with the tradingview. Work that meets this requirement will be accepted ( depending on the broker and spread, however, a few pips of difference will be accepted)
Here is a detailed instruction for the coder to implement the vertical lines based on the BrainTrainSignalAlert indicator: --- **Task: Implement Vertical Lines for Alerts from BrainTrainSignalAlert Indicator** **Objective:** Create a system that adds vertical lines on specified timeframes (M5 or M30) whenever an alert is generated by the BrainTrainSignalAlert indicator on the H1, H4, and D1 timeframes. The lines
Hello Guys! I want to modify/fix the indicator that uses sequential type of entries (it calculates from 1 to 9) and if the conditions are met it provides an arrow (signal) with alert. The problem is that, sometimes (for unknown for me reasons) it repaints arrow signal. Like on the picture: Signal 1 - correct signal Signal 2 - correct signal Signal 3 - correct signal Signal 4 - repaints (signal 3 arrow dissapeared
Hi, I have a Live Data feature for my trading accounts that lets me check details like total open positions, number of lots, profits, etc. I need someone to add the number of pending orders to this live data. This is important for me to ensure that all accounts have the same number of pending orders, since I use a copy trading system. Also, there is a website where I check all the data. In this case, you would need