RSI_SR_EA

MQL4 전문가

작업 종료됨

실행 시간 17 일
피고용인의 피드백
great customer, polite and rational

명시

Please provide your quote and timeframe for Phase I and for Phase II.

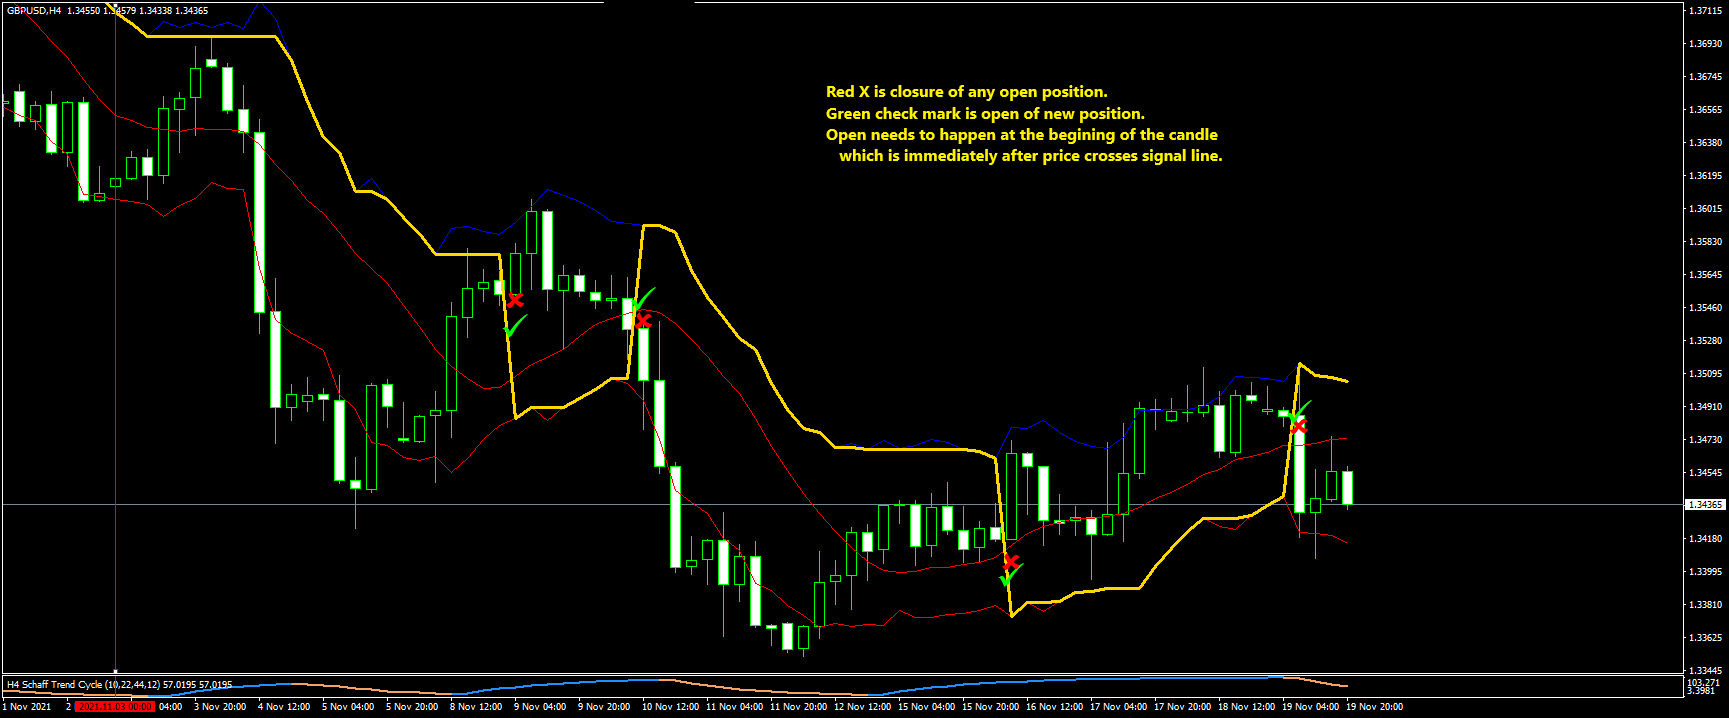
Please see the attached picture.

Please see indicator, attached.

RSI_SR_EA

EA based on indicator

Indicator is RSI stop&reverse

Phase I: Proof of concept

Long Entry:  Enter long when signal line is falls below price.

Short Entry:  Enter short when signal line line rises above price.

Stop Loss:  in pips, set by user.

Note:  It is important that the position is opened at the candle indicated in the provided picture.

Take profit:

Two take profit levels will be available.

TP1:  Pips set by user

TP2:  Use TP2 (true/false; user will have the option of using TP2 or not)

Pips set by user

There will also be two chances to move the stop loss:

User will have the option of using BE movements or not.

BE1:  If TP1 is hit then move stop loss to X pips from entry price.  This may be a negative number or a positive number.

BE2: If TP2 is hit then move stop loss to X pips from entry price.  This may be a negative number or a positive number.

Most trades will close with TP or BE/stop loss.  

Any position that may be open when price crosses the signal line will be closed.  At the same time a new position will be opened as per   

This condition will essentially be a "stop and reverse"

Timeframe is "use chart timeframe"

User will be able to adjust and optimize all "inputs" of the indicator.


Phase II:

User will be able to to set the line colors and thickness within the EA settings.


Notice:  The signal line begins to shift during the life of a candle.  If, because of the nature of the indicator, 

a position cannot be opened at the start of the candle as indicated in the screen capture, 

it may be necessary to open the new position before the candle completes.

If necessary, the EA will open a position before the candle completes.  

The programmer will offer suggestions such as a delay or possibly a pending order based on last candle before the signal line finishes its cross.


Take profit:

Add three more take profit levels will be available.

TP3: Use TP3 (true/false)

Pips set by user

TP4: Use TP3 (true/false)

Pips set by user

TP5: Use TP3 (true/false)

Pips set by user


Add two more BE levels:

BE3: If TP3 is hit then move stop loss to X pips from entry price.  This may be a negative number or a positive number.

BE4: If TP4 is hit then move stop loss to X pips from entry price.  This may be a negative number or a positive number.


Provide an on screen chart that shows:

1. quantity, pip value and dollar value of each TP level that is hit.

2. quantity, pip value and dollar value of each BE level that is hit.

3. quantity, pip value, and dollar value of each SL that is hit.\

4. quantity, pip value, and dollar value of each trade that closes at signal line cross.

Chart will have 11 lines:  TP1, TP2, TP3, TP4, TP5, BE1, BE2, BE3, BE4, SL, CAC (for close at cross).

Chart will have three columns:  Quantity (this is a count of the number of times the condition is met and executed), PIP value at execution, dollar value at execution.

User will set:  display chart (y/n) font color, font size, position on the screen such as upper right, lower right, lower left, upper left.

응답함

1
개발자 1
등급
(56)
프로젝트
176
71%
중재
4
100% / 0%
기한 초과
1
1%
무료
2
개발자 2
등급
(45)
프로젝트
59
44%
중재
8
50% / 38%
기한 초과
7
12%
무료
비슷한 주문
I need a graphic designer that is good at voice overs and object animation. I have a dialogue project that I intend it to deliver a certain message for marketing purposes. The project is to be done by cartoons and they should be much humanized in terms of graphics. The project has to be in the form of video that lasts up to 3 minutes longest and not less than 2 minutes. Creativity is the most important requirement
I am looking to develop an automated trading bot based on a strategy involving the crossing of four Simple Moving Averages (SMA). The bot should be capable of entering trades based on this strategy. Additionally, I would like to incorporate some custom diversions tailored for NinjaTrader
RSI trading bot 50 - 80 USD
Good morning, I'm looking to have an RSI based trading bot developed, which focuses on having many options for closing trades in order to diversify my trading opportunities, and to be good for experimentation in backtesting. Here are the features I'd like: -Being able to have as many of the following options activated as I want, to try all combinations of them -To work on all timeframes, though I will be focusing on
Looking for an EA which can produce less than 5% drawdown. Also profit factor above 1.5 (preferably 2.0) Please give me proper explanation how your EA works too Has anyone programmed it before? is it limited to forex only
1) the EA can compound the lot size from 0.01 to 0.02 so on 2) the EA must able to trade different kind of pair 3) the EA will have stoploss or take profit 4) long term profit 5) for equiry will be 100 for every 0.01 lot Developer will have that kind of EA may apply and introduce any investor account! this EA must have mql4 file
p.p1 {margin: 0.0px 0.0px 0.0px 0.0px; font: 13.0px 'Helvetica Neue'} Hello Looking for someone to help me improve my current strategy on my own algorithm and to also add hedging mode
I want the script in mql5 language for my martingale strategy. The script should open trades in both directions buy and sell and if any trade closes in loss then open new trade in that direction by using the next volume and when trade closes in profit then reset the volume to first from volume list and also maximum consecutive losses limit will apply. If trades closes consecutively in losses and hits the limit then
Long Position 1. Trend Line: When a Lower High (LH) is formed, draw a trend line from the previous Higher High (HH) to the new LH. 2. Trend Line Adjustment: If a new Lower High (LH) is formed without breaking the trend line, redraw the trend line to the new LH. Draw a trend line between the Higher High (HH) and the Higher Low (HL). If a new Higher High (HH) is formed, remove the previous trend line and draw a new one
Please watch the video on this youtube channel and download the Indicator from there. https://www.youtube.com/watch?v=ldTomLu8DxE&amp ;t=32s Rules are explained on the video and the download of the indicator is on the same video
I would like an EA that follows exactly this steps to trade de daily candle. Watch the video and then see if you can do the task. https://www.youtube.com/watch?v=g3oDYq4P9ZE Document is one this link https://cdn.discordapp.com/attachments/1135977927469703230/1135978751461695598/Daily_Bias-TTrades_edu.pdf?ex=669a9a27&amp ;is=669948a7&hm=96de195f7e695a381c1261b065f67b94fae319d02a0c88641b146f8b2978320c& Should have

프로젝트 정보

예산
30 - 100 USD
개발자에게
27 - 90 USD
기한
에서 1  2 일