Currency Strength Indicator display on Daily/Weekly/Monthly Basic

작업 종료됨

실행 시간 8 일
고객의 피드백
Jabir deliver excellent quality code and product even with high-end graphic requirement! If you are finding a developer that can deliver a QUALITY + AESTHETIC PLEASING program, he is the one!!!
피고용인의 피드백
Very precise customer and behavior very gentle. Like to work with him again and again...

명시

I would like to develop an indicator that can display Bid Ratio, Buy/sell Ratio and Gap (3 stuff) in 1 indicator. The formula to calculate each value will be given in the specification later. However, here is the general description

  1. Bid Ratio (Blue line - customisable ) - Current Bid price % with respect to high and low over a day (Default) /week/month (broker TF - customisable)
  2. Buy/Sell Ratio (Red line - customisable ) - Currency strength of the current currency
    1. It calculate 7 base pair Bid ratio and minus 7 quote pair bid ratio
  3. Gap (Lime line - customisable) - Change in Buy/Sell Ratio over the past XX minutes (30 minute by default but is also customisable)

All the value needed to reset over day (Default) /week/month (customisable - same setting use for Bid Ratio). To ease the visualisation, a vertical grey line will be draw at where the indicator calculation will reset.


Only 1 value will display at 1 time. So I need a button at the bottom right (Allow me to change position as well) of the Indicator to allow me navigate between this 3 value. Just make a small button with using the short cut below. Font size is 10 ( Default - allow me to change in the setting).

  • BR = Bid ratio. 
  • BS = Buy Sell ratio
  • G = Gap

After the desire value has been plotted, starting from the where the indicator reset ( Eg. Daily), calculate the Bollinger band value of the indicator. For example

  1. I am using Buy Sell Ratio now and is reset on daily basic 
  2. It will calculate the mean price of the BS ratio and plot out the mean line together with Buy Sell Ratio
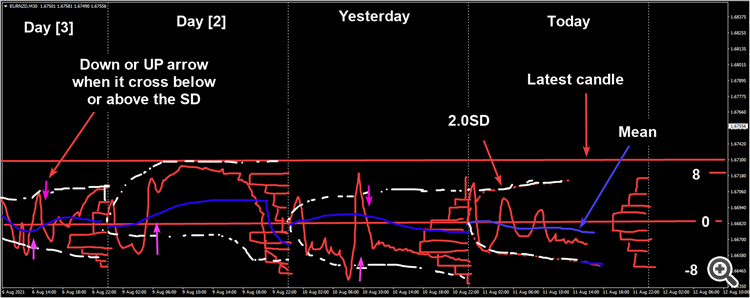
  3. A ( 2.0SD - customisable) will plot around the mean based on the standard deviation (SD) of indicator value (in this case BS ratio). This should continue and repeat for the past YY (default = 10) day
    1. (Optional) If possible, create an downward arrow when the value from top cross below the 2.0SD. Vice versa.
  4. A histogram chart will plotted on the left(or right - can change in setting) side where the indicator will reset by itself. In this case it will place on every day with hour=0. The histogram should only occupy 20% of the period. Meaning 1 day, the hour is 0 -24, and max value should only occupy from hour 19-24 (since it is at the right side).
    1. By default the bin size is 0.2and max/min value is +- 8(any number beyond that will be added here). This value need to be in setting as well.
    2. Calculate based on Current close price candle (fix)


Having the setting to export the data out and store in CSV. The indicator value for the past  YY (default = 10) day will be first store. The CSV will continue append the latest data every10sec (Default & changeable) The required data are:

  1. Symbol
  2. Broker time
  3. Local Time
  4. Close price
  5. Bid Ratio
  6. Buy Sell
  7. Gap

When the export setting is true, create a "Debugging" Yellow text at the top right of the chart so I know the CSV is collecting.

The file name is following the format: custom_name ( Default=CSIndi) + broker short name + symbol + date (year.month.day)


Expected final outcome


Ps: I forgot to draw 3 little button at the right side to change the indicator value type. But it is needed.


I do not accept indicator code that is generated.


Highly welcome developer that is communicative and experience in MQL indicator. Please communicate with me on your experience so I know if you are suitable in working with this project or not.

Source code is needed by the end of the project.


응답함

1
개발자 1
등급
(115)
프로젝트
129
18%
중재
11
27% / 55%
기한 초과
4
3%
무료
2
개발자 2
등급
(15)
프로젝트
16
19%
중재
2
0% / 50%
기한 초과
1
6%
무료
3
개발자 3
등급
(155)
프로젝트
239
70%
중재
3
67% / 33%
기한 초과
20
8%
무료
4
개발자 4
등급
(71)
프로젝트
97
43%
중재
2
50% / 0%
기한 초과
2
2%
무료
비슷한 주문
Hey, great developer I have a thinkorswim script I want to convert it into TradingView. Can you please let me know if you can i will be looking for great developer that will bid for it best regards
Tradingview developer 30 - 35 USD
Hey greetings. I am in need of tradingview developer that can modify an open source PineScript indicator code to add additional features. Kindly bid for this project if it is what you handle and let proceed with the project
looking for help to get my ibkr automated, i have strategies already built in composer and have JSON for them, i really just need to he setup and explanation on how to maintain it and add new strategies
Specify your Requirements Specification here point by point. Try to describe your requirements briefly and clearly, so that your potential developer is able to correctly assess its complexity and cost, as well as the required execution time. A bad or too generic description will result in your order being ignored, or you will spend a lot of time negotiating the details with each applicant. Remember: It is better to
I wish an indicator that can import data from the websites below: https://www.fastbull.com/speculative-sentiment?textType=1&amp ;id=-1 https://www.fxblue.com/market-data/tools/sentiment After importing the data. I want the developer to create a simple text dashboard showing at least the major pairs in Forex with the correspondent sentiment from each website. The format of the dashboard or its visual aspects do not
Hi I need a software like Mirror trade copier ( https://www.antonnel.net/mirror/ ) which directly connect to the Accounts over api with out MT4 terminal and copies trades from mater to client. I want the same and possible improvement like can be accessed over a url and dashboard for some basic metrics (optional)
I need a AI signal generating bot for forex trading. The bot should operate such that when i put it in a chart it will analyse the market, after several minutes it will display whether the trade is buying or selling. It should display the one minute, five minute,15minute, 30 minute, one hour, 4 hours and daily time frame whether they are buying or selling. If it is buying the arrow should be green and if it is
Using Bollinger Band only. When price closes above upper BB, open Buy. If the length of the candle body that closed above the upper BB is more than Y pips, then do not Buy and remove the EA. Otherwise, continue to open Buy if crosses and close above upper BB and the number of positions is not more than Max No of Positions. The user will choose either Buy or Sell only. When price closes below the lower BB, close all
Hello freelancers here, I need an expert to help me with coding my script which is already working in pinescript, Moreover, i want a system whereby i can sell my trading bot and can give access with a license, I need an expert that can help me with this
I need an EA which only trades the news data. The EA has to analyze the news-data and needs to classify them into categories. The Strategy includes the following points and this features needs to be included : 1. Filter for news Data : Pairs : USD ● EUR ● AUD ● GBP News Events : GDP Unemployment rate (initial claims) CB Consumer Confidence (US) Retail sales Consumer Price Index (CPI) Purchasing Managers' Index (PMI)

프로젝트 정보

예산
50 - 150 USD
개발자에게
45 - 135 USD
기한
에서 5  10 일