거래 로봇을 무료로 다운로드 하는 법을 시청해보세요
당사를 Telegram에서 찾아주십시오!
당사 팬 페이지에 가입하십시오
당사 팬 페이지에 가입하십시오
스크립트가 마음에 드시나요? MetaTrader 5 터미널에서 시도해보십시오
- 조회수:
- 29818
- 평가:
- 게시됨:
- 2006.10.16 11:46
- 업데이트됨:
- 2014.04.21 14:55
-
이 코드를 기반으로 한 로봇이나 지표가 필요하신가요? 프리랜스로 주문하세요 프리랜스로 이동
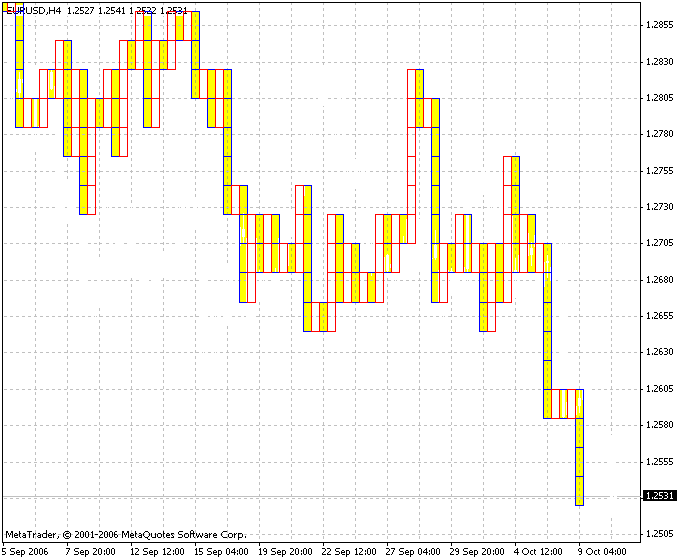
Point & Figure Charts (P&F) differ from normal price charts through that they fully ignore the time values and only show changes in prices. Instead of showing prices at Y axis and time at X axis, the P&F charts show price changes in both axes.
In these charts, "X" (the cross - the red check) is drawn when prices increase by a certain basic value (RazmBox), and "O" (the outh – the yellow check) when prices decrease by the same value. Note that neither Xs nor Os are drawn if prices have increased/decreased by a value under this certain basic value.
Every column drawn can contain either crosses or ouths, but not both elements. To switch between columns (for example, from crosses column to the ouths column), the price must change by a certain value in the opposite direction. Change of column means change of the pricing trend.
To hide price charts, it is necessary to set up the background color in the chart window properties (the "Properties" command in the chart window context menu – the "Colors" tab), in fields "Bar Up:", "Bar Down:", "Bull Candle:", "Bear Candle:" and "Line".
Parameters
RazmBox - base value.

 NRTR WATR
Being one of indicators of group NRTR (Nick Rypock Trailing Reverse), the NRTR WATR indicator is a dynamic price channel adapted by volatility.
 SHI Channel true
Indicator SHI_Channel_true shows Barishpolts' dynamic moving channels in the chart in automated mode.
 10 points 3
The Expert Adviser 10 points 3 uses the histogram of the standard indicator Moving Average Convergence/Divergence, MACD.
 ZeroLag MACD
The Indicator ZeroLag MACD is an indicator Moving Average Convergence/Divergence, MACD with zero delay.