당사 팬 페이지에 가입하십시오

Drag and Drop Support and Resistance "segment lines" with color differentiation - MetaTrader 4용 스크립트
- 조회수:
- 33159
- 평가:
- 게시됨:
- 2010.06.08 09:24
- 업데이트됨:
- 2014.04.21 14:54
-
 이 코드를 기반으로 한 로봇이나 지표가 필요하신가요? 프리랜스로 주문하세요
프리랜스로 이동
이 코드를 기반으로 한 로봇이나 지표가 필요하신가요? 프리랜스로 주문하세요
프리랜스로 이동
NEW REVISION:
*********************
DROP_RESISTANCE_SEGMENT_LINE_Rev1 and DROP_SUPPORT_SEGMENT_LINE_Rev1: Both scripts have been revised. With the new revision the scripts will work also when MT4 is not connected to server. The old version could only work when the platform was connected to server.
*********************
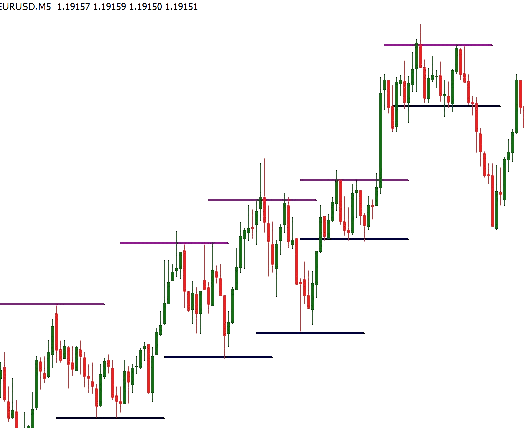
If you want to draw several resistance and support lines as a "little segment line", differentiating the color of both types of line. (example, all Resistance Lines: Magenta color // all Support Lines: Blue color) but you don’t want to change the color of the horizontal line using the “properties button”, each time a new line has been created, you can use these scripts:
DROP_RESISTANCE_SEGMENT_LINE.mq4: You just need to drag and drop this script in the place of the chart where you want to draw a resistance line. The horizontal line will be drawn with the color and the width wanted.
DROP_SUPPORT_SEGMENT_LINE.mq4: You just need to drag and drop this script in the place of the chart where you want to draw a support line. The horizontal line will be drawn with the color and the width wanted.
Parameters that you can modify on both scripts:
You can easily change the following parameters by editing the script code:
- Color of the Segment Line.
- Width of the Segment line
- Length of the Segment line.
- Change Segment Line to Ray (full Horizontal Line)
 Progressive Grid Positionning System (Entry and Exit)
This systems allows you to progressively enter and exit the market. You define the amount you want to risk (%) and it calculates automatically the different levels of entering and exiting the market according to the amount of levels you have defined.
 Higher timeframe candles on your chart
This indicator allows you to draw candles of an higher timeframe on your chart. Example: Draw H1 candles on your M1 chart.