당사 팬 페이지에 가입하십시오
- 조회수:
- 42172
- 평가:
- 게시됨:
- 2010.04.20 10:52
- 업데이트됨:
- 2014.04.21 14:54
-
 이 코드를 기반으로 한 로봇이나 지표가 필요하신가요? 프리랜스로 주문하세요
프리랜스로 이동
이 코드를 기반으로 한 로봇이나 지표가 필요하신가요? 프리랜스로 주문하세요
프리랜스로 이동
Description:
This indicator is EMAs drawn by Fibonacci numbers.
There are part1 and part2:
Part1-->EMA 34(High,Close,Low), 55, 89, 144, 200
Part2--->EMA 233, 377, 610, 987, 1598
Images:
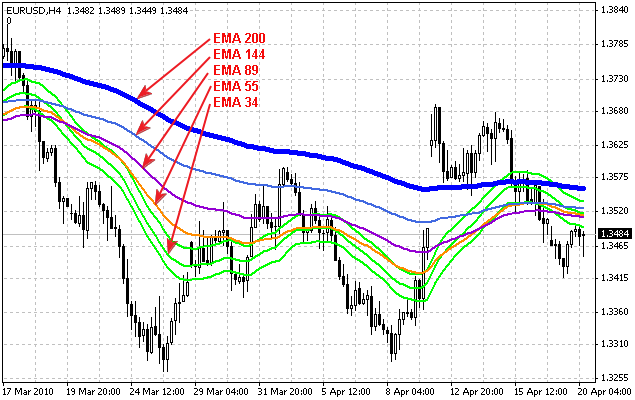
Figure 1. Fibonacci-based Moving Averages- Part 1
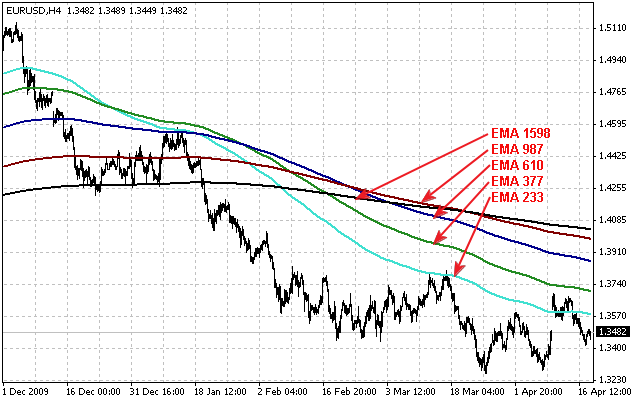
Figure 2. Fibonacci-based Moving
Averages- Part 2
 Simple Adviser EMA WMA RSI
Simple Expert Advisor. In this version RSI and Trailing Stop has been added.
 Three Indians
Detection of a pattern "three Indians" on the basis of the ZigZag.
HighLowLines
Shows you the value of the highest high, the lowest low and the average of both over the last x Bars (to be set in the input tab).
Support and resistance levels
This a bollinger band indicator with an extra deviation level. If you keep the period at 25 and deviations of 1.0 and 2.0, It will show you all your resistance and support lines. And also overbought and oversold levels.