당사 팬 페이지에 가입하십시오
- 조회수:
- 18854
- 평가:
- 게시됨:
- 2009.11.25 09:38
- 업데이트됨:
- 2016.11.22 07:32
-
이 코드를 기반으로 한 로봇이나 지표가 필요하신가요? 프리랜스로 주문하세요 프리랜스로 이동
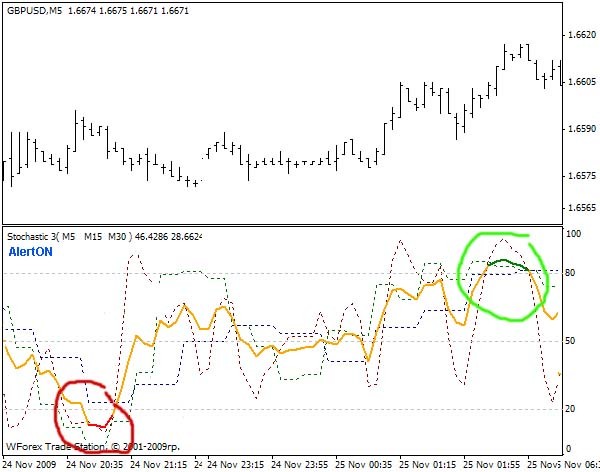
My first stategy was to buy when several stochastics are below 20, and sell when they are above 80.
It was unconvenient to change periods every time, so I have developed this indicator, maybe it can be useful.
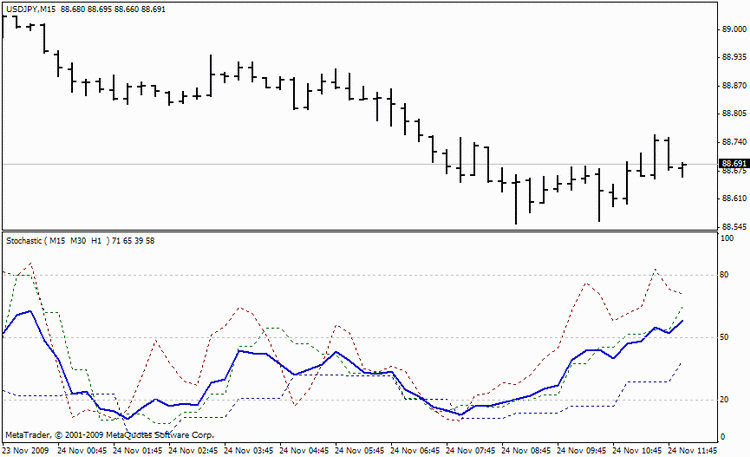
It shows Stochastics for several timeframes in a single chart, also it calculates the average value (blue line on the chart).
Image:

My other solutions: https://www.mql5.com/ru/users/cmillion/publications Good Luck!
Editor's remark:
Note that it's a mirror translation of the original Russian version.
If you have any questions to the author, suggestions or comments, it's better to post them there.
If you have found this code useful for trading or educational purposes, don't forget to thank author.
-------------------------------------------------------------------------------------------------------------------------
Stochastic3_v2.mq4

Good Luck!
MetaQuotes Ltd에서 러시아어로 번역함.
원본 코드: https://www.mql5.com/ru/code/9352
 Fine Fractal Channel
A finer resolution channel made of three bar fractals.
 Open and Close positions using the lines
It opens and closes positions using the crossing of the movable lines.
 10 points on EURUSD & GBPUSD
The strategy is based on breakthrough of the maximum and minimum price values of the previous trading day.
 Trade-Arbitrage
It works without losses. It uses the market inefficiency for the arbitrage.