당사 팬 페이지에 가입하십시오

- 조회수:
- 9215
- 평가:
- 게시됨:
- 2009.11.12 08:44
- 업데이트됨:
- 2016.11.22 07:32
-
 이 코드를 기반으로 한 로봇이나 지표가 필요하신가요? 프리랜스로 주문하세요
프리랜스로 이동
이 코드를 기반으로 한 로봇이나 지표가 필요하신가요? 프리랜스로 주문하세요
프리랜스로 이동
Shortly:
Graphic displaing of the statement, carring of a data from the *.htm table to the graph, for convenience of the analysis.
and studying.
The description:
I welcome! Suffice the new useful program.))
In a network, at forums often are offered Statements in a format *.HTM on which it is possible to track technics of trade or to consider efficiency of this or that strategy. But to use such "inventory" of transactions in a tabulared kind extremely inconveniently.
It is much more habitually and more evidently to observe and "feel" all this on the graph of the terminal where it is possible to analyze conveniently points of an input and accompanying signals, to cover with indicators, etc..I have decided to not potter with HTML - code, StatementToGraph reads a simple text file in which the "business" part of the table Statement is preliminary copied and saved.
The step-by-step instruction:
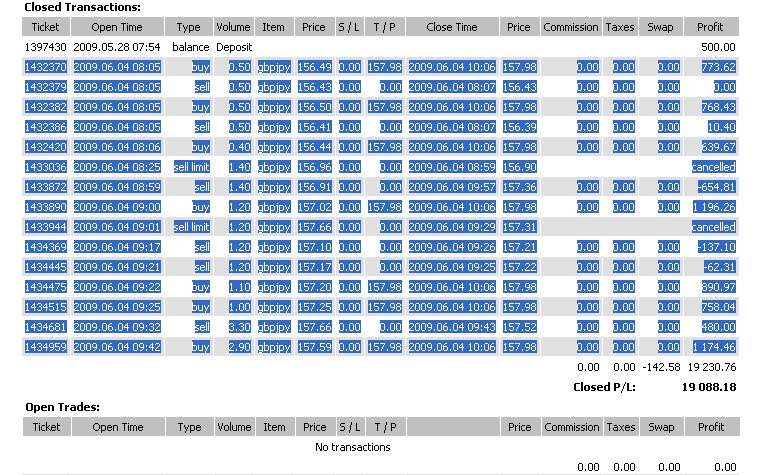
To open in a browser the report (Statement), to select and copy only a part of the table with the orders.
To paste into an empty text file and to save it in a folder experts \files in a directory of your terminal.
For example: С:\Program Files\ ... \experts \files
It is possible to save it under the name Statement.txt or under another (in this case it will be necessary to change parameter of script FileName at its use).

Script StatementToGraph.mq4 should be placed in a folder experts \scripts in a directory of the terminal.
Then it is possible to start the terminal, and to open the chart of that currency that is in the Statement. If there are
some currencies - for everyone open the separate schedule.Attention!
Since the script works on historical data, should be downloaded Archive of quotations on the given currency in the Tools - History Center, otherwise - press F2 ...
The name of currency in a file should correspond to a symbol of the graph i.e. if in report the symbol is specified as gbpjpy_s and in the terminal is only gbpjpy, it needs to replace all "gbpjpy_s" in a text file by "gbpjpy". I hope, clearly.
Having dropped a script on the graph, check up a correctness of a name of a file:
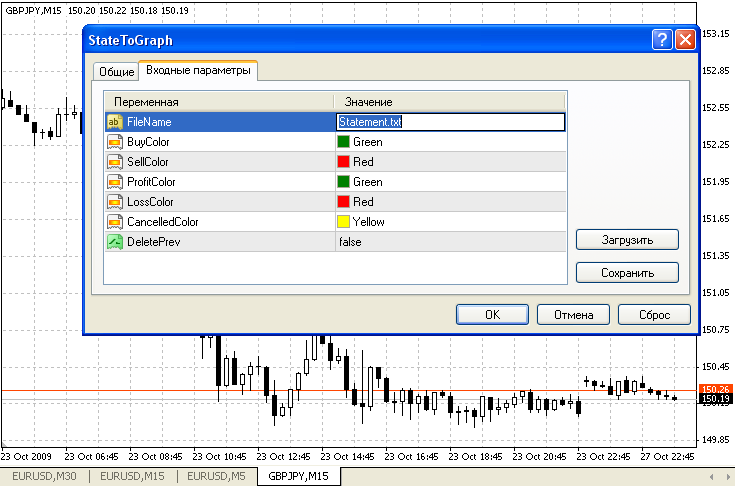
... and Allow DLL imports

Allow DLL imports
Press OK and data of the report will become the
graph:
StatementToGraph
Green arrows - orders BUY, red- SELL, yellow- the cancelled pending orders.
Green lines - profitable transactions, red - unprofitable, yellow horizontal - not taken place.
Blue and red short hyphens - take
profits and stoplosses of orders.Read also pop-up helps.
Colors, certainly it is possible to change.
The parameter DeletePrev is responsible for the removal of the graphics that were created by a script earlier.
And in summary...
Whoo...
Well, analyze, study, solve strategy, share the reasons.
On the basis of our general researches it is possible to write more many of the interesting programs.
And I on former wait for your responses, ideas and offers...
MetaQuotes Ltd에서 러시아어로 번역함.
원본 코드: https://www.mql5.com/ru/code/9300
 LineMA
Indicator shows color lines between two MA crosses
Best MACD final
Classical MACD with Impulse System.
Monitoring-Spread
It's an instrument for spread monitoring for a real and synthetic currency pairs.
 MACD-STOCH Trader
EA based on MACD and STOCH. It will be helpful, if you test this EA with other currencies and report me, thx.