당사 팬 페이지에 가입하십시오
- 조회수:
- 52711
- 평가:
- 게시됨:
- 업데이트됨:
-
이 코드를 기반으로 한 로봇이나 지표가 필요하신가요? 프리랜스로 주문하세요 프리랜스로 이동
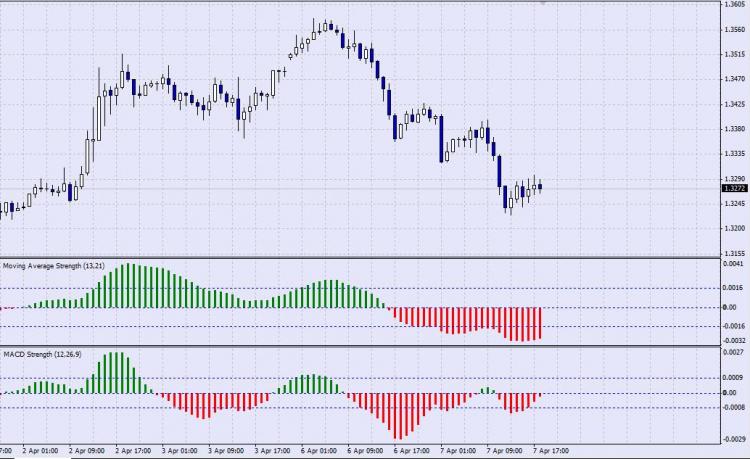
This indicator displays, in histogram form, the difference between either:
- a fast and slow moving average (MA_Power=true)
- main and signal lines of a MACD indicator (MACD_Power=true)
- main and signal lines of a stochastic indicator (Stochastic_Power=true)
Only one option can be choosen (default is moving average) at any one time, although another indicator can be opened for another option.
This indicator also displays average (strength) levels of difference values above and below the zero line. This feature can be disabled (Set_Levels=false).
This indicator is meant to gauge the power/strength behind a price move.
 Customized Buy Sell Close v2 -- Now in one script
It's version 2 of Customized Buy and sell v1 .... http://codebase.mql4.com/4901
 AIS4 Trade Machine
Trade machine for manual trading with automatic risk management and "SuperTrainer" mode
 Bollinger Bandwidth
An investigation of the Bollinger band has shown that when the bandwidth (distance between the top and bottom bands) is below 4, the market is compressed and about to break out. When the bandwidth reaches 11, there is a strong wave for scalp trading. Be
 Bollinger Bandwidth 2
This tool combines the original Bands with Bollinger Bandwidth and removes the extra window for Bollinger Bandwidth. Instead Bandwidth is now a value in the comment in the top left corner. This makes more efficient use of the chart space and still allow
