당사 팬 페이지에 가입하십시오
- 조회수:
- 8707
- 평가:
- 게시됨:
- 2016.07.01 11:42
- 업데이트됨:
- 2016.11.22 07:32
-
이 코드를 기반으로 한 로봇이나 지표가 필요하신가요? 프리랜스로 주문하세요 프리랜스로 이동
The script allows to preview the indicator behavior on a real chart from the specified point with the minimum computation resources, both in the mode of manual control over the shift point, and in the automatic mode with tick generation delay.
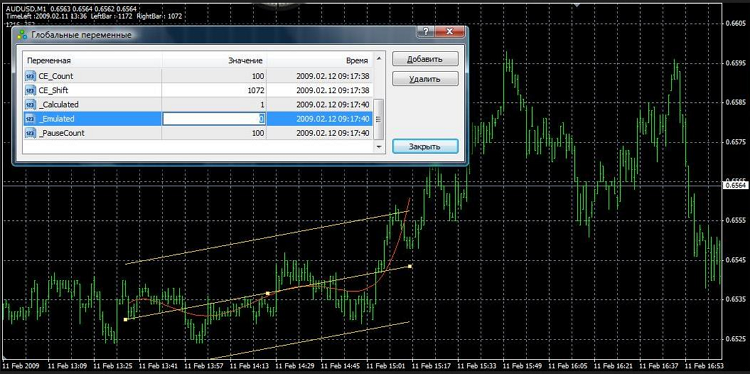
The script is designed for setting two shift parameters and the number of calculated data for an indicator, EA or another script via the global variables. It is also possible to automatically iterate over the data range from the initially set bar until the zero bar with a delay.
Provided is an example of linear regression indicator in conjunction with the attached script. The indicator can perform calculations both independently and in conjunction with the script (presence of a running script).
If used in conjunction with the script, the parameters required in indicator calculation (shift and the number of calculated data) are stored in the global variables (CE_Shift and CE_Count, respectively).
The script has the ability to manage the indicator both in manual mode (set shift - positioning the linear regression object with the mouse) or in the automatic mode (set shift - positioning the linear regression object through setting the new coordinates with a shift of -1).
The manual and automatic management mode is set using the _Emulated global variable:
- _Emulated=0 - manual mode
- _Emulated=1 automatic mode.
Once the object reaches the zero bar in automatic mode, the script switches to manual control mode. The _PauseCount global variable sets the delay parameter for the next run of the indicator. The _Calculated global variable defines the readiness of the indicator to perform the next calculation. Once the calculation completes the indicator sets the flag _Calculated=true.
If the edges of the linear regression object go beyond the chart screen, the chart is automatically moved to display the new selected range.
The script operation is concluded with the deletion of all linear regression objects followed by a confirmation to unload.
My thanks for the initial idea to Oleg Poddubny and his script Mover.mq4.

MetaQuotes Ltd에서 러시아어로 번역함.
원본 코드: https://www.mql5.com/ru/code/8710
 Channels
The indicator plots channels on three different timeframes (by default 1 hour, 4 hours, 1 day) and displays them on one chart. Also, for greater clarity, it displays the boundaries of each channel on the chart.
 NTK 07
Expert Advisor for trend trading with lot increase
 Tick emulation for accelerated testing of indicators ver.2
Modernization of the first version of the script with the ability to manage multiple indicators
 BW-Zone
Visualizer indicator (what a terrible phrase to use!). Colors the chart bars according to the logic of determining the state of the fourth dimension of the Chaos Theory by B. Williams - Zone.