거래 로봇을 무료로 다운로드 하는 법을 시청해보세요
당사를 Telegram에서 찾아주십시오!
당사 팬 페이지에 가입하십시오
당사 팬 페이지에 가입하십시오
스크립트가 마음에 드시나요? MetaTrader 5 터미널에서 시도해보십시오
- 게시자:
- Biantoro Kunarto
- 조회수:
- 11459
- 평가:
- 게시됨:
- 2012.04.13 08:59
- 업데이트됨:
- 2016.11.22 07:32
-
이 코드를 기반으로 한 로봇이나 지표가 필요하신가요? 프리랜스로 주문하세요 프리랜스로 이동
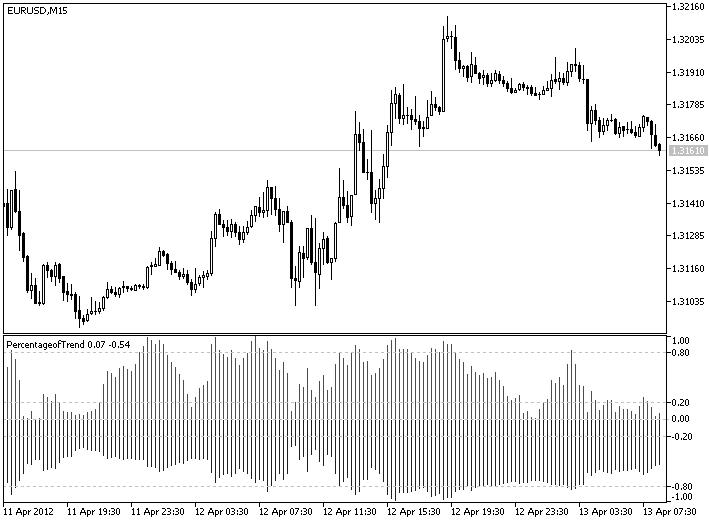
The indicator values are calculated by this formula :
- For first period (red color) = (Close - LowValue) / (HighValue - LowValue)
The value is between 0 - 1.
The higher value means uptrend, the lowest value means downtrend, value in the middle means sideway.
- For second period (blue color) = (Close - LowValue)*-1 / (HighValue - LowValue)
The value is between -1 - 0.
The higher value means downtrend, the lowest value means uptrend, value in the middle means sideway.
where :
- HighValue - the highest high for n period;
- LowValue - the lowest low for n period;
Input parameters:
- InpPeriod1 - First period for calculating trend;
- InpPeriod2 - Second period for calculating trend;

 Statistics.mqh Functions
The library that contains various statistical functions including the calculation of an average value, variance, asymmetry, excess, covariation, correlation etc.
 Objects Description Activator
Enables the "Chart Objects Description" for non-programmers. For any open chart window.
 ColorChart
Simple script to randomize all colors of your chart. Just click on it and see results yourself!
 Expert Advisor Demonstrating LibCustomChart Application
The Expert Advisor shows the use of the free LibCustomChart library for the automatic connection of the Expert Advisors and indicators to iCustomChart custom charts created on the basis of custom history files.
