당사 팬 페이지에 가입하십시오
- 조회수:
- 28624
- 평가:
- 게시됨:
- 2008.11.13 07:30
- 업데이트됨:
- 2016.11.22 07:32
-
 이 코드를 기반으로 한 로봇이나 지표가 필요하신가요? 프리랜스로 주문하세요
프리랜스로 이동
이 코드를 기반으로 한 로봇이나 지표가 필요하신가요? 프리랜스로 주문하세요
프리랜스로 이동
Author: Watasi
How a trend changes? How to determine a flat? How to trade? ... etc. This indicator will help to answer these questions.
If you assume that the trend within N bars is a straight line you can calculate the parameters of that line. You know the equation of the straight line from the school, it is y = bx + с. The inclination of the line is characterized by the "b" coefficient or tangent of the angle of slope. The indicator calculates this parameter using the linear regression on every bar and display it in a separate window. If the color is green it means that the value is greater than the previous one, i.e. the angle of slope increases, the red color means the opposite.
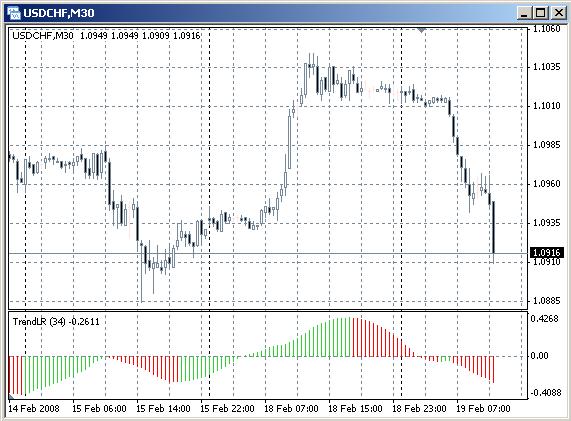
In sober fact, the "b" coefficient in the context of the charts is formed by two coefficients: tangent of the angle of the line and the coefficient that characterizes the currency pair (probably Point), so the scale of the indicator is different on different currency pairs.
How to use the indicator? I think there are several variants:
1. crossing the zero line.
2. maximum value passage.
3. if you determined a zone near the zero line then it is a flat and you can trade on a break through.
If any one has the ideas of how to improve the indicator or how else it can be used I will appreciate.
MetaQuotes Ltd에서 러시아어로 번역함.
원본 코드: https://www.mql5.com/ru/code/7883
 Chande QStick v1
Indicator QStick represents a simple n-period moving average for the difference of the close and open prices.
ChandelierStops_v1
A modified verion of the Chande & Kroll's Stop indicator. The author consider that the ChandelierStops_v1 is very similar to it and look better than the Chande & Kroll's Stop.
Large Time Frame
Indicator LargeTimeFrame. It draws the candlesticks of a larger timeframe on the chart.
Median
The indicator shows the average between the maximum and the minimum price within a time range.