거래 로봇을 무료로 다운로드 하는 법을 시청해보세요
당사를 Facebook에서 찾아주십시오!
당사 팬 페이지에 가입하십시오
당사 팬 페이지에 가입하십시오
스크립트가 마음에 드시나요? MetaTrader 5 터미널에서 시도해보십시오
- 게시자:
- Nikolay Kositsin
- 조회수:
- 66
- 평가:
- 게시됨:
-
이 코드를 기반으로 한 로봇이나 지표가 필요하신가요? 프리랜스로 주문하세요 프리랜스로 이동
실제 저자:
tageiger
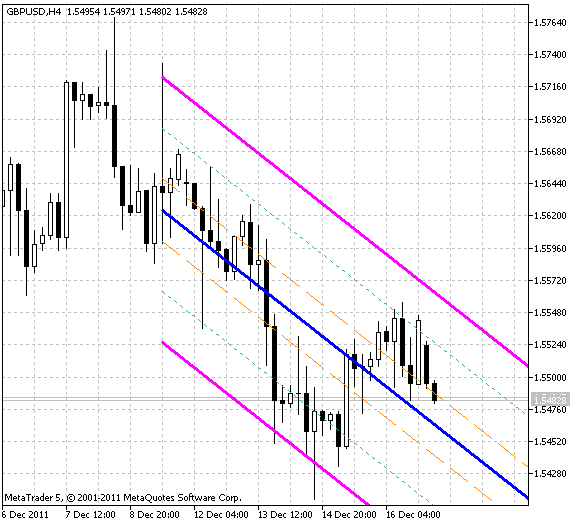
금융 시장에 적용할 때 이 방법은 일반적으로 "정상" 수준에서 가격이 과도하게 벗어나는 순간을 식별하는 데 사용됩니다.
선형 회귀법에 의한 추세선 구성은 최소제곱법을 기반으로 합니다. 이 방법은 가격 포인트에서 선까지의 거리가 최소화되는 방식으로 가격 포인트를 통해 직선을 그린다고 가정합니다. 내일의 가격을 예측할 때는 내일의 가격이 오늘 가격과 비슷할 것이라고 가정하는 것이 합리적입니다. 상승 추세가 있는 경우 가장 좋은 가정은 가격 값이 약간의 상승 편향이 있는 오늘의 값에 근접할 것이라고 가정하는 것입니다. 회귀 분석은 이러한 가정을 통계적으로 확인할 수 있습니다.
이 지표는 MQL4에서 처음 구현되었으며 2007.09.10. 에 mql4.com의 코드베이스에 게시되었습니다.

MetaQuotes Ltd에서 러시아어로 번역함.
원본 코드: https://www.mql5.com/ru/code/765
 QuickTradeKeys123
QuickTradeKeys 123은 사용자 친화적인 메타트레이더 5용 EA(Expert Advisor)로, 키보드에서 숫자 '1'과 '2'를 누르기만 하면 매수 및 매도 주문을 빠르게 체결할 수 있습니다. '3'을 누르면 모든 오픈 포지션이 청산됩니다. 이 EA는 마우스를 사용하지 않고 수동 개입이 필요한 신속한 거래 및 테스트 목적에 이상적입니다.
 Simple Yet Effective Breakout Strategy
간단하면서도 효과적인 돈치안 채널 돌파 전략. 이 전략은 시대를 초월한 전략입니다!
