당사 팬 페이지에 가입하십시오
- 조회수:
- 11717
- 평가:
- 게시됨:
- 2014.05.21 06:39
- 업데이트됨:
- 2016.11.22 07:32
-
이 코드를 기반으로 한 로봇이나 지표가 필요하신가요? 프리랜스로 주문하세요 프리랜스로 이동
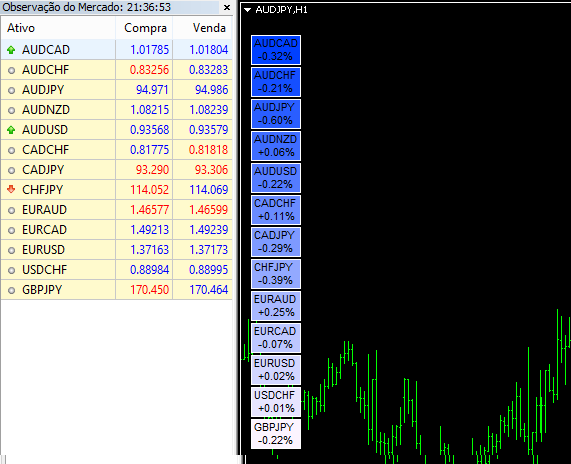
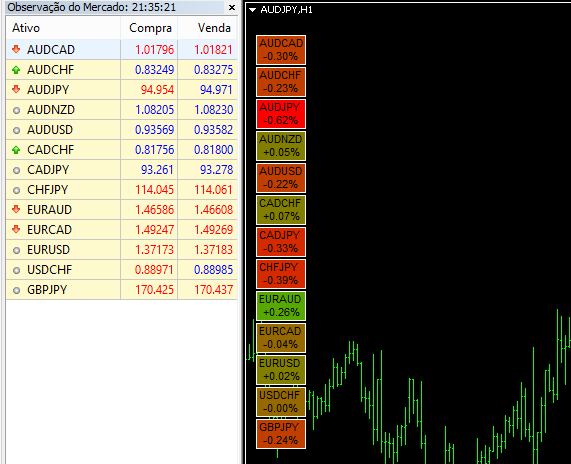
The purpose of this code is to demonstrate how easy it is to create color scales, color gradients and heatmaps with the MQL5 language and functions.
In order to facilitate things, we will work with the RGB color model and the standard conversion function StringToColor. Other color conversion methods can be implemented in MQL5, however we have decided to use the RGB color model due to the facility to perform mathematical operations on the colors.


Recommendations:
- It's recommended to use this whenever you want to know the daily percent change of all the assets you have on the Market Watch.
- It's recommended to use at least 5 symbols and at most 20-25 symbols (in order to fit on the screen).
- You can choose one of the 3 display modes: Scale, Gradient or Heatmap.
 HighsLowsSignal_HTF
The HighsLowsSignal indicator with the timeframe selection option available in input parameters.
 Exp_HighsLowsSignal
A trading system using the HighsLowsSignal semaphore arrow indicator.
 Channel Trailing
The EA for trailing along a price channel.
 Horizontal line for max/min prices of the last 2 years
Example code on how to draw an horizontal line for maximum and minimum prices of the last 2 years.