당사 팬 페이지에 가입하십시오
- 조회수:
- 6916
- 평가:
- 게시됨:
- 2024.07.16 22:37
-
이 코드를 기반으로 한 로봇이나 지표가 필요하신가요? 프리랜스로 주문하세요 프리랜스로 이동
This code demonstrates how you can modify the objects in an indicator without having the source code. There are some indicators that don't use buffers, they are only using objects. It would be easy if inputs could be changed with iCustom, but this is only possible if the indicator is using buffers to draw the elements. What if the indicator only uses objects?
For the demonstration, a free market indicator for MT5 called "PZ Multidiagonals MT5" is used. You would need to install this indicator from the market before attempting to test this code as it is.
We need an object prefix name in order to begin manipulating the objects. The function LogChartObjectNames() is created to log all of the names of the objects which exist in the indicator.
Objects are then manipulated using the ModifyChartObjects() function which passes two parameters. The prefix name (which should be the beginning part of a descriptive object name), and an integer which is for passing how much objects should unmodified or "spared" for that particular object.
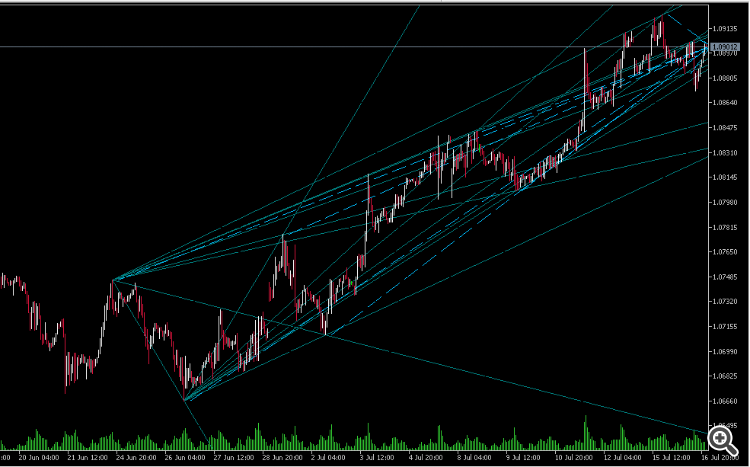
The PZ Multidiagonals indicator is a trend indicator which automatically draws trend lines, but goes a little overboard. Here is how the default preset looks:
From the data window, it's evident that no buffers are used in this indicator. Everything is constructed with objects.
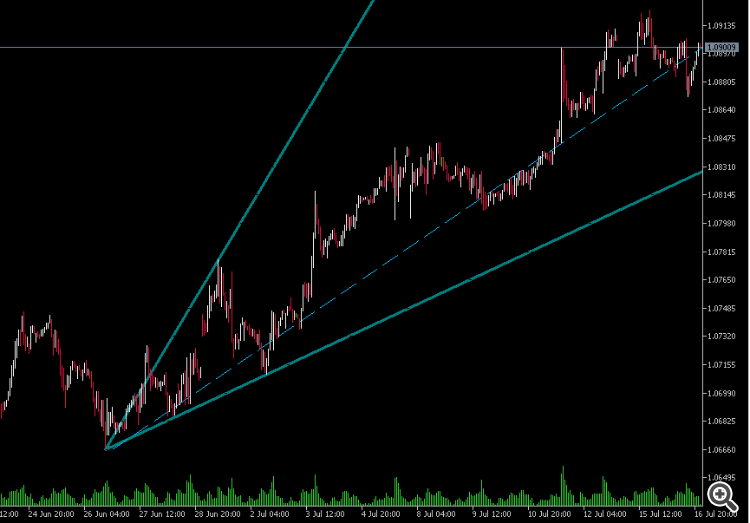
Now by starting from a clean chart, and loading this indicator "Hacking Objects.mq5", you will see how I removed a lot of the trend lines, and left what are in my opinion the most relevant not by accessing the inputs, but by hacking the objects:
 Raymond Cloudy Day For EA
Raymond Cloudy Day For EA, a revolutionary trading tool created by Raymond and expertly developed for the MT5 platform. This innovative indicator integrates a cutting-edge calculation method with advanced algorithms, surpassing traditional Pivot Points to enhance trading strategies with unparalleled precision.
 DPO - MA modified
main point is changing of MA curve to horizontal line and DPO curve shall represent to distance from close price to zero level or MA curve
 Decision Colored Candles - MT5
higher confidence to get into trade
 Find Swing Highs Swing Lows
The Swing High/Low Identifier for MetaTrader 5 marks significant swing highs and swing lows directly on your chart with color-coded arrows. This tool helps traders quickly identify key price levels, which can serve as resistance and support, and is ideal for trend reversal analysis, support and resistance mapping, and enhancing price action strategies. By highlighting these crucial swing points, it provides valuable insights for making informed trading decisions and optimizing trading strategies.

