당사 팬 페이지에 가입하십시오
- 게시자:
- Nikolay Kositsin
- 조회수:
- 16015
- 평가:
- 게시됨:
- 2011.10.21 17:01
- 업데이트됨:
- 2016.11.22 07:32
-
이 코드를 기반으로 한 로봇이나 지표가 필요하신가요? 프리랜스로 주문하세요 프리랜스로 이동
Real author:
Luis Guilherme Damiani
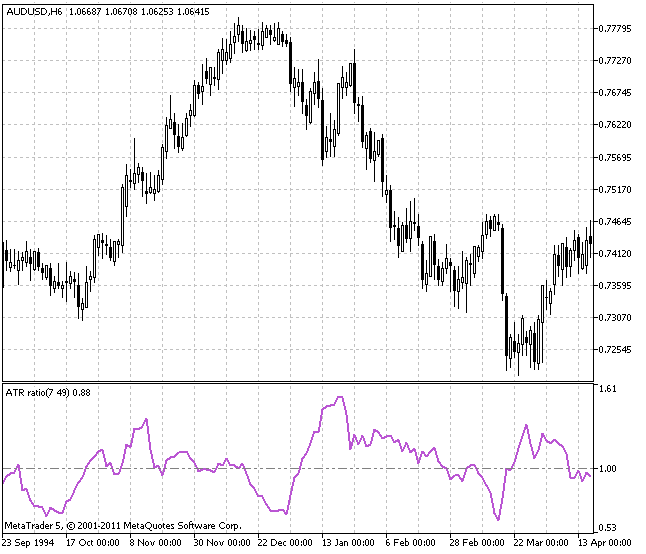
The indicator of the ratio between fast Average True Range (ATR) and slow ATR.
ATR ratio often reach high values after the prices quick and strong movements. Low indicator values often correspond with long periods of flat that can be observed on the market top and during consolidation. It can be intepreted according to same rules as other volatility indicators. Forecasting method using ATR ratio is as follows: the higher is the indicator value, the higher is the probability of a trend change; the lower is the value, the weaker is the trend movement. In case the indicator value climbs above the blue horizontal line, it is time to buy or sell.
High ATR ratio price levels often correlate with high volatility. Low ATR ratio price correlates with low volatility, as the prices stabilize or move along the channel flat movement up to the possible breakout point.
The indicator itself does not submit sufficient amount of signals and must be used together with other indicators. Volatility movements happen in the direction of a trend. Like moving averages systems, volatility systems for trend markets will not work well during a flat.
This indicator was first implemented in MQL4 and published in Code Base at mql4.com 08.08.2006.

MetaQuotes Ltd에서 러시아어로 번역함.
원본 코드: https://www.mql5.com/ru/code/495
 DailyPivotShift_Full
DailyPivot_Shift indicator differs from the common DailyPivot indicator, as the main levels can be calculated with day start shift. This variant of the DailyPivot_Shift_Full indicator can be built for any chart bar and allows to clearly see the market behaviour relative to the indicator levels at each bar.
 XCCI
XCCI
Standard Commodity Channel Index with the standard average deviation formula and the possibility to select smoothing algorithm and dynamically changing oversold/overbought levels.
 BykovTrend
Simple indication of a newly born trend using colored arrows on a chart.
 MFCS Currency Correlation Chart
An indicator to put correlated currency charts on a given currency chart. It shows only bars currently. Color/monochrome mode is configurable. It also supports currency inversion for handling EURUSD & USDCHF like pairs.