당사 팬 페이지에 가입하십시오
- 조회수:
- 21064
- 평가:
- 게시됨:
- 2011.09.29 10:34
- 업데이트됨:
- 2023.03.29 13:43
-
이 코드를 기반으로 한 로봇이나 지표가 필요하신가요? 프리랜스로 주문하세요 프리랜스로 이동
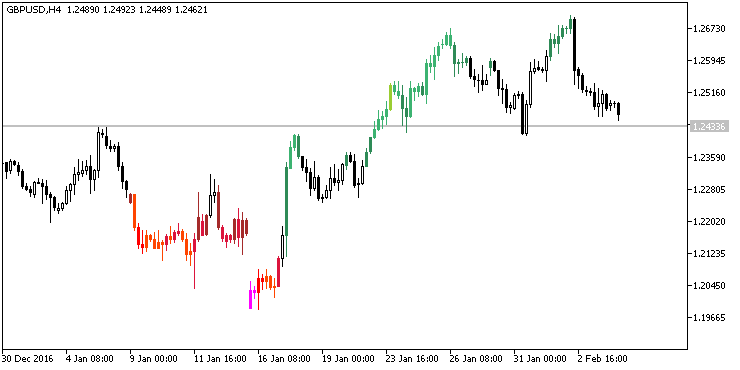
This indicator paints the candlesticks in different colors depending on a trend power and direction.
The indicator is based on five symmetrical Bollinger Bands with different deviation input parameters values. Breakout of the channel with a big deviation value results in a brighter color of a candlestick. Spring green color shades are used for the rising market, while maroon color shades are intended for the falling market.
Five deviation levels and ten colors for trend display are used. In case the weakest deviation level is not passed, the candlesticks are not colored and have a common coloring.
The indicator uses SmoothAlgorithms.mqh library classes (must be copied to the terminal_data_folder\MQL5\Include). The use of the classes was thoroughly described in the article "Averaging Price Series for Intermediate Calculations Without Using Additional Buffers".

MetaQuotes Ltd에서 러시아어로 번역함.
원본 코드: https://www.mql5.com/ru/code/477
 LeManSignal
The indicator shows market entry points as colored dots. Signal dots locations can indicate the levels for setting a protective Stop Loss or a new Trailing Stop position.
 DailyPivotPoints_Full
The indicator helps to compose a picture of market future movements, in distinct from the other tools that hang behind the market. The information that became available in the course of the previous day is used to calculate the check points of the minor trend of the current day.
 Color Smoothed Momentum
More smoothed Momentum with colored indication of the current trend.
 MACD_Histogram
The indicator displays MACD histogram and price divergence on a chart.