당사 팬 페이지에 가입하십시오
- 조회수:
- 3682
- 평가:
- 게시됨:
- 2023.09.10 15:14
- 업데이트됨:
- 2023.09.10 18:18
-
 이 코드를 기반으로 한 로봇이나 지표가 필요하신가요? 프리랜스로 주문하세요
프리랜스로 이동
이 코드를 기반으로 한 로봇이나 지표가 필요하신가요? 프리랜스로 주문하세요
프리랜스로 이동
This is an indicator which will automatically plot the previous highs and lows of the selected period with a colored horizontal line.
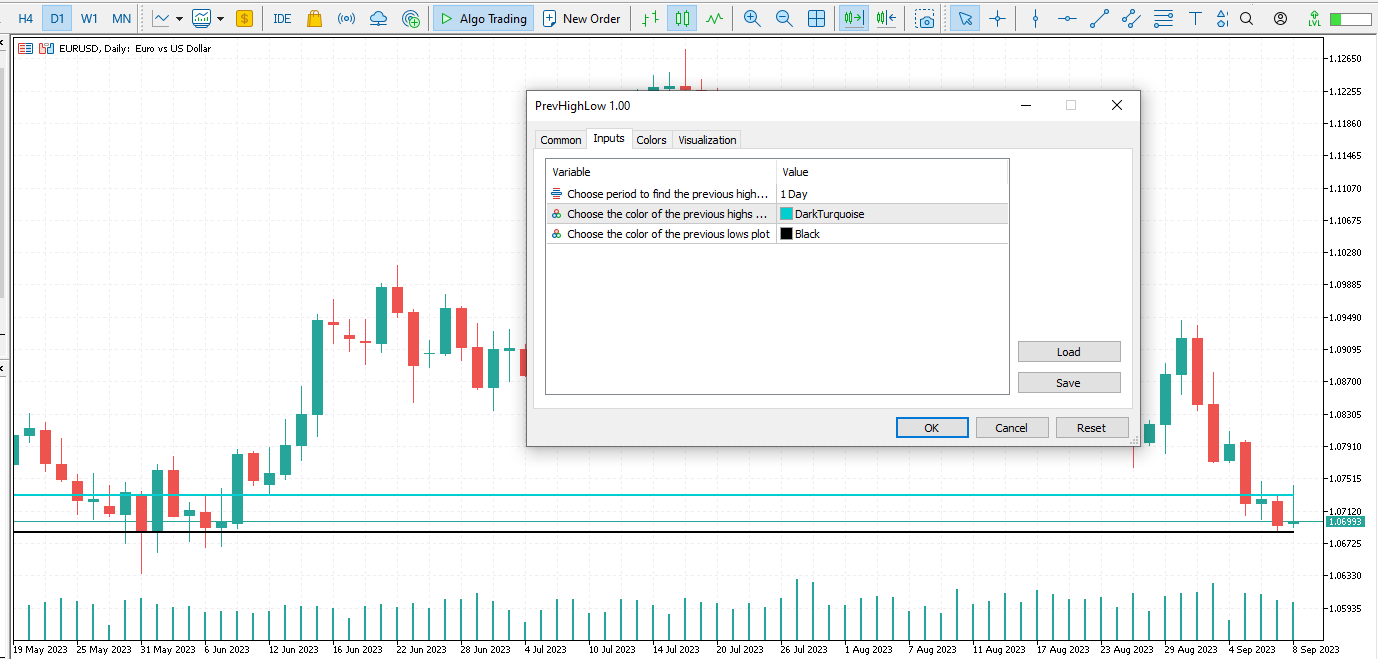
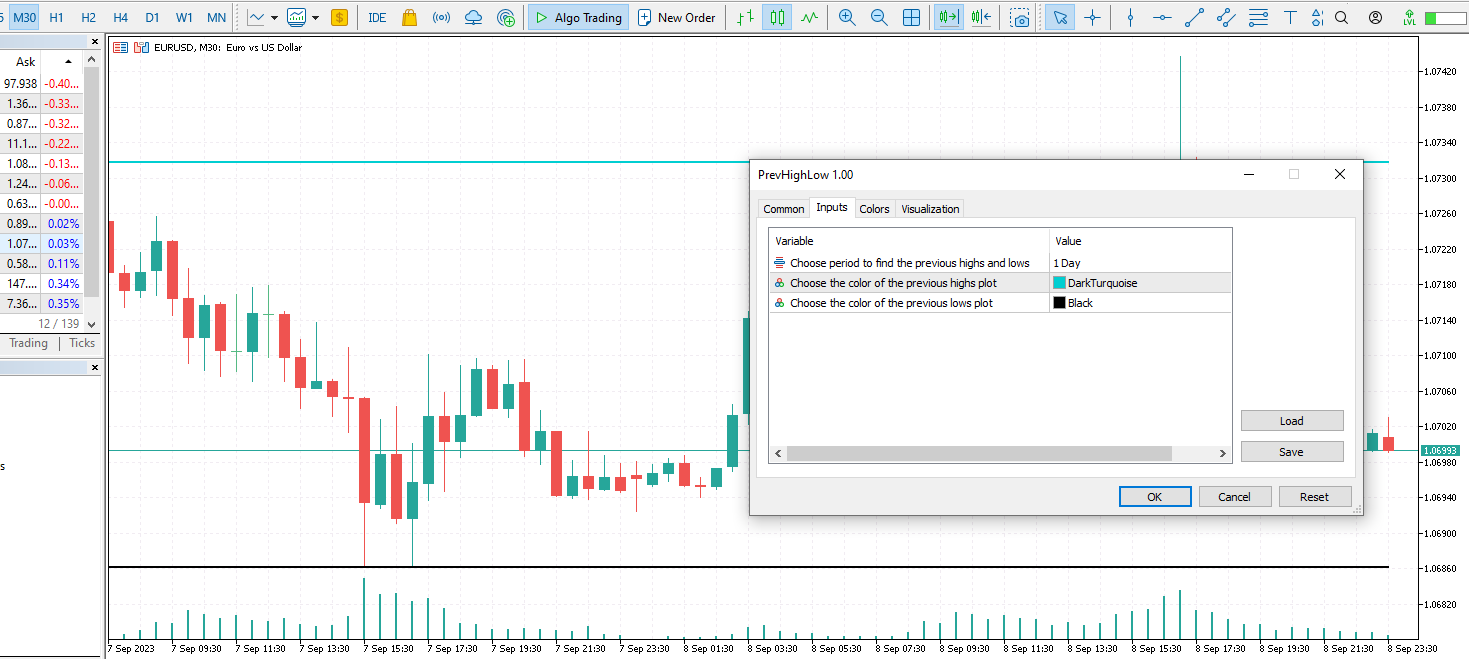
The indicator will maintain the previous high price and previous low price for the selected period when switching timeframe:
The default is plotting the previous day highs and lows.
You can adjust the period in the input so that you may also automatically plot the previous hourly highs and lows, the previous 30 minute highs and lows...and so on.
----------------------------------------------------
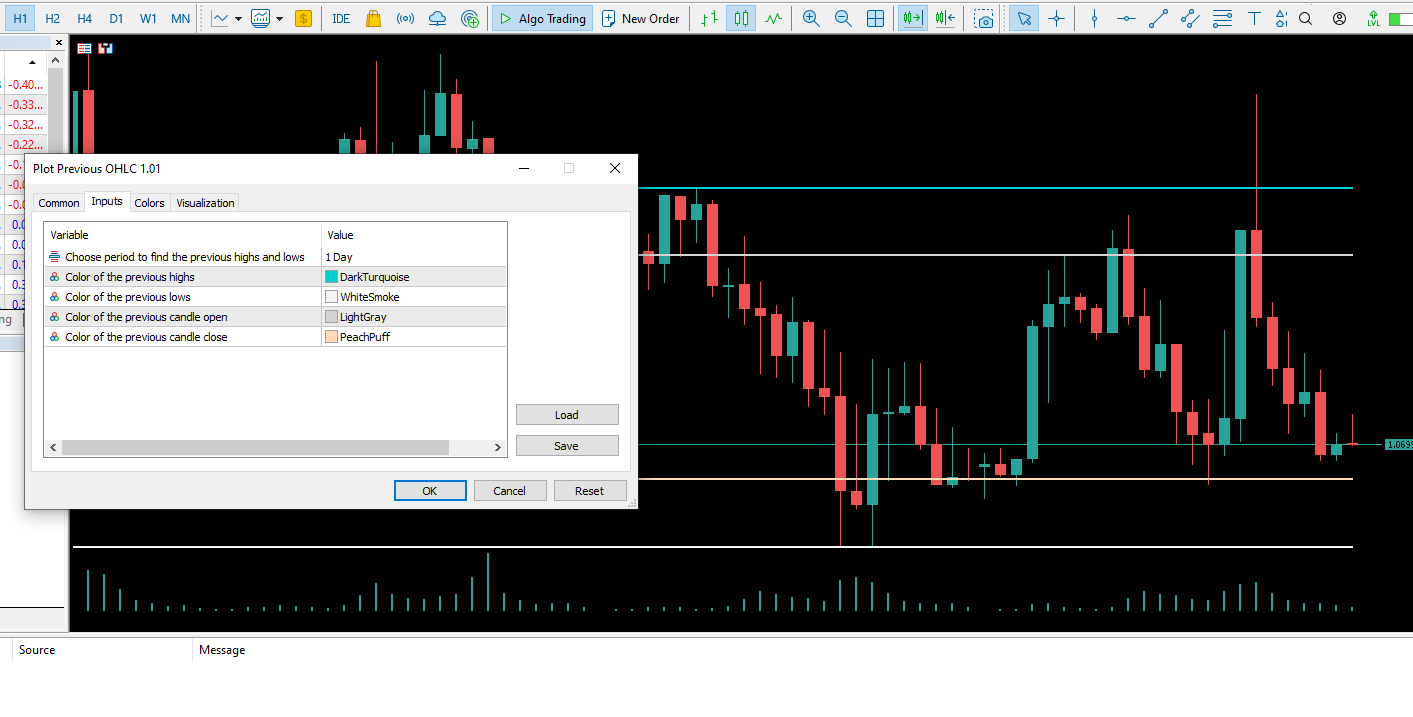
EDIT: An updated version now plots highs and lows as well as the open and close for the previous candle of the selected period.
 Translating mouse click on chart into price value (Helper function)
This is a helper function which enables you to find the price of the symbol (the prices on the Y-axis) wherever you click the mouse on the chart. Using OnChartEvent, we don't have an MQL5 function in the API to do this, we can only obtain X and Y pixel values with mouse click.
 Drag and Drop Move TakeProfit
Set TakeProfit by just dragging and dropping script on the desired price level.
Stochastic code for beginners by William210
Stochastic beginner tutorial to learn how to code in MQL5
Automatic Chart Refresher
A tool which refreshes the chart automatically and will make active indicators update if something stopped plotting on the chart.