당사 팬 페이지에 가입하십시오
- 조회수:
- 14152
- 평가:
- 게시됨:
- 업데이트됨:
-
이 코드를 기반으로 한 로봇이나 지표가 필요하신가요? 프리랜스로 주문하세요 프리랜스로 이동
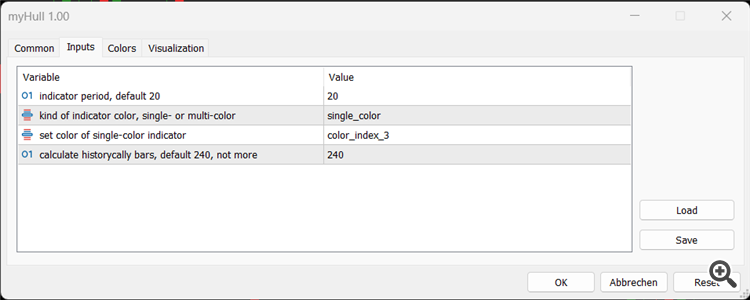
I did not understand the source of other Hull MA implementations, so i decide to implement it myself. It has four input parameters:
- InpHmaPeriod = 20
- InpColorKind = single_color
- InpColorIndex = color_index_3
- InpMaxHistoryBars = 240
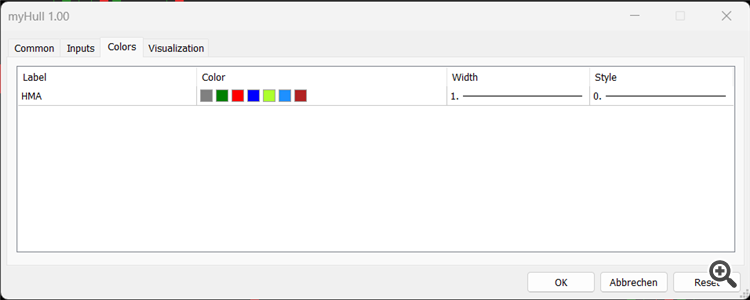
These parameters are self explanatory. The enumeration ENUM_COLOR_KIND switches between single and multi color, default is single color. In multi color, the Hull MA has another color for rising and a different one for falling values. In single color mode, the ENUM_COLOR_INDEX sets the single color of the Hull MA. In multi color mode, the default color is grey. On upslope the color is green and on downslope it is red. You can see it in the following two pictures.
The code:
//+------------------------------------------------------------------+
//|                                                     MelzHull.mq5 |
//|                                       Copyright 2022, wm1@gmx.de |
//|                                                 https://melz.one |
//+------------------------------------------------------------------+
/*
  === My Hull Moving Average implementation

  In my indicator you can choose between single- and multi-color for
  the indicator line.

*/

enum ENUM_COLOR_KIND {  // single or alternating color
  single_color,
  multi_color
};

enum ENUM_COLOR_INDEX { // index of indicator_color1 colors
  color_index_0,
  color_index_1,
  color_index_2,
  color_index_3,
  color_index_4,
  color_index_5,
  color_index_6
};

#property copyright   "Copyright 2022 by W. Melz, wm1@gmx.de"
#property link        "https://melz.one"
#property version     "1.00"
#property description "Implementation of my Hull Moving Average"
//--- indicator settings
#property indicator_chart_window              // draw in chart window
#property indicator_buffers 4                 // buffers for: fullWMA, halfWMA, vHull, cHull
#property indicator_plots   1                 // plot only one line
#property indicator_type1   DRAW_COLOR_LINE   // draw as color line
// color index to select from:    0        1      2       3              4             5            6, feel free to extend the list up to 64 colors
#property indicator_color1  clrGray,clrGreen,clrRed,clrBlue,clrGreenYellow,clrDodgerBlue,clrFireBrick
#property indicator_width1  1                 // line width
#property indicator_label1  "HMA"             // indicator name

//--- input parameters
input int                 InpHmaPeriod        = 20;             // indicator period, default 20
input ENUM_COLOR_KIND     InpColorKind        = single_color;   // kind of indicator color, single- or multi-color
input ENUM_COLOR_INDEX    InpColorIndex       = color_index_3;  // set color of single-color indicator
input int                 InpMaxHistoryBars   = 240;            // calculate historycally bars, default 240, not more

//--- indicator buffers
double valueBuffer[];           // store Hull indicator values
double colorBuffer[];           // store Hull indicator color at bar
double fullWMABuffer[];         // store calculation of WMA full period
double halfWMABuffer[];         // store calculation the WMA half period

//--- Indicator global variables
int hmaPeriod, fullPeriod, halfPeriod, sqrtPeriod, maxHistoryBars;  // store input value or default value

//+------------------------------------------------------------------+
//| Custom indicator initialization function                         |
//+------------------------------------------------------------------+
int OnInit() {
  ENUM_INIT_RETCODE result = checkInput();                // check for correct input parameters

  SetIndexBuffer(0,valueBuffer,INDICATOR_DATA);           // store indicator buffer mapping
  SetIndexBuffer(1,colorBuffer,INDICATOR_COLOR_INDEX);    // store indicator candle color
  SetIndexBuffer(2,fullWMABuffer,INDICATOR_CALCULATIONS); // store result of fullWMA calculation
  SetIndexBuffer(3,halfWMABuffer,INDICATOR_CALCULATIONS); // store result of halfWMA calculation
  IndicatorSetInteger(INDICATOR_DIGITS,_Digits);          // set indicator digits
  string shortName = StringFormat("HMA(%d)",hmaPeriod);   // name for DataWindow and indicator subwindow label
  IndicatorSetString(INDICATOR_SHORTNAME,shortName);
  PlotIndexSetString(0,PLOT_LABEL,shortName);

// calculate global values for indicator
  fullPeriod = hmaPeriod;                             // period from input
  halfPeriod = fullPeriod / 2;                        // calculate half period
  sqrtPeriod = (int)round(sqrt((double)fullPeriod));  // calculate square root of period

  return(result);                                     // success or failure, init finished
}

//+------------------------------------------------------------------+
//|                                                                  |
//+------------------------------------------------------------------+
ENUM_INIT_RETCODE checkInput(void) {      // change this function for your own indicator parameters
  if(InpHmaPeriod <= 0) {                 // check for correct input value range
    hmaPeriod = 14;                       // if invalid input set period to 14
    PrintFormat("Incorrect input parameter InpTestPeriod = %d. Indicator will use value %d for calculations.",InpHmaPeriod,hmaPeriod);
  } else
    hmaPeriod = InpHmaPeriod;             // set period from input

  maxHistoryBars = InpMaxHistoryBars;   // else use input value

  return(INIT_SUCCEEDED);                 // or INIT_FAILED
}

//------------------------------------------------------------------
// Custom indicator de-initialization function
//------------------------------------------------------------------
void OnDeinit(const int reason) {
  ArrayFree(valueBuffer);
  ArrayFree(colorBuffer);
  ArrayFree(fullWMABuffer);
  ArrayFree(halfWMABuffer);
}

//+------------------------------------------------------------------+
//| Custom indicator iteration function                              |
//+------------------------------------------------------------------+
int OnCalculate(const int rates_total,
                const int prev_calculated,
                const datetime &time[],
                const double &open[],
                const double &high[],
                const double &low[],
                const double &close[],
                const long &tick_volume[],
                const long &volume[],
                const int &spread[]) {
  if(rates_total < maxHistoryBars + hmaPeriod)  // test for available bars, adjust for period when calculating other indicators
    return(0);                                  // when no bars available, do nothing on this tick.

  int startBar;                 // store index values
  if(prev_calculated == 0) {    // if no historical bar calculated before
    //Print("--- Calculating historically bars");
    // first tick, calculate all historical bars, oldest index 0, plus rates_total - InpMaxHistoryBars -1 for start at index
    startBar = rates_total - maxHistoryBars - hmaPeriod - 1;
    PlotIndexSetInteger(0,PLOT_DRAW_BEGIN, startBar + hmaPeriod);  // set plot begin from the bar with index of startBar + hmaPeriod
    // do calc
    CalcHma(startBar,rates_total,close);   // calculate the Ma's over the volume and compare to bar size
  }

  if(rates_total - prev_calculated == 1) {
    //Print("-- Calculating new bar");
    startBar = rates_total - 1; // calculate the actual new open bar
    // do calc
    CalcHma(startBar,rates_total,close);   // calculate the Ma's over the volume and compare to bar size
  }

  // do calc
  //Print("- Calculating every tick");
  return(rates_total);  // return value of prev_calculated for next call
}

// calculate Ma from startBar to rates_total on array buf
void CalcHma(int startBar, const int rates_total, const double &buf[]) {
  for(int bar = startBar; bar < rates_total && !IsStopped(); bar++) { // Loop over bars

    // (1) Indicator calculations, WMA full period
    double sum = 0.0;                                       // store period sum value for later division
    double wMA = 0.0;                                       // store calculated value for that bar
    int wf = 1;                                             // set start weighting factor to 1
    int sumWf = 0;                                          // set sum of weighting factors to 0
    for(int i = fullPeriod - 1; i >= 0 ; i--) {             // loop over full period for actual bar
//      sum += getPrice(open,high,low,close,(bar - i)) * wf;  // get price applied and add prices over n bars, start at oldest bar, lowest index
      sum += buf[(bar - i)] * wf;                           // get price applied and add prices over n bars, start at oldest bar, lowest index
      sumWf += wf;                                          // add all weighting factors for division
      wf += 1;                                              // increase weighting factors for linear weighting of next newer bar
    }
    wMA = sum / sumWf;                                      // calculate linear weighted averaged value for full MA period
    fullWMABuffer[bar] = wMA;                               // save value to buffer for later use

    // (2) Indicator calculations, WMA half period
    sum = 0.0;                                              // store period sum value for later division
    wMA = 0.0;                                              // store calculated value for that bar
    wf = 1;                                                 // set start weighting factor to 1
    sumWf = 0;                                              // set sum of weighting factors to 0
    for(int i = halfPeriod - 1; i >= 0 ; i--) {             // loop over half period for actual bar
//      sum += getPrice(open,high,low,close,(bar - i)) * wf;  // get price applied and add prices over n bars, start at oldest bar, lowest index
      sum += buf[(bar - i)] * wf;                           // get price applied and add prices over n bars, start at oldest bar, lowest index
      sumWf += wf;                                          // add all weighting factors for division
      wf += 1;                                              // increase weighting factors for linear weighting of next newer bar
    }
    wMA = sum / sumWf;                                      // calculate linear weighted averaged value for half MA period
    halfWMABuffer[bar] = wMA;                               // save value to buffer for later use

    // (3) Indicator calculations, calculate Hull
    sum = 0.0;                                              // store period sum value for later division
    wf = 1;                                                 // set start weighting factor to 1
    sumWf = 0;                                              // set sum of weighting factors to 0
    for(int i = sqrtPeriod - 1; i >= 0 ; i--) {             // loop over half period for actual bar
      sum += (2 * halfWMABuffer[bar - i] - fullWMABuffer[bar - i]) * wf;// calculate sum of sqrt(period) and multiply by weighting factor
      sumWf += wf;                                          // add all weighting factors for division
      wf += 1;                                              // increase weighting factors for linear weighting of next newer bar
    }
    wMA = sum / sumWf;                                      // calculate linear weighted averaged value for half MA period
    valueBuffer[bar] = wMA;                                 // store the HMA for displaying

    // (4) Indicator color calculations, adjust to your needs
    colorBuffer[bar] = getColor(bar);
  }
}

// calculate color for every bar, adjust to your needs
double getColor(int bar) {
  double retval;                                  // store return value
  if(InpColorKind == single_color)                // set single_color
    retval = InpColorIndex;                       // blue
//    retval = InpHullColor;
  else {                                          // set multi_color, default is grey
    retval = 0;                                   // grey
    if(valueBuffer[bar - 1] < valueBuffer[bar])   // if indicator upslope, then green
      retval = 1;                                 // green
    if(valueBuffer[bar - 1] > valueBuffer[bar])   // if indicator downslope, then red
      retval = 2;                                 // red
  }
  return(retval);                                   // return calculated color
}

//+------------------------------------------------------------------+
Enjoy to use it.
 Wick Ratio Candlesticks
Wick Ratio Candlesticks are recognized by its upper and lower wick ratio instead of open and close properties.
 Advisor Based on RSI and Martingale
"This advisor uses the RSI indicator to determine optimal entry and exit points in the market. A unique feature of the advisor is its martingale strategy, which allows for position reversal with an increased lot size during market reversals. The advisor offers flexible trading time settings: you can set a working time range and disable trading during specific hours to filter out news events."
 Fractals - adjustable period and prices
Fractals - adjustable period and prices for MT5
 Rsi without Irsi() code for beginners by William210
Rsi without Irsi() beginner tutorial to learn how to code in MQL5

